| Param | Original file | Final file |
|---|---|---|
| Filename | modeM0/AS1G05_191T01_9000000524_04109cztM0_level2.evt | modeM0/AS1G05_191T01_9000000524_04109cztM0_level2_quad_clean.evt |
| Size (bytes) | 497,638,080 | 89,928,000 |
| Size | 474.6 MB | 85.8 MB |
| Events in quadrant A | 3,459,386 | 581,662 |
| Events in quadrant B | 3,579,888 | 582,899 |
| Events in quadrant C | 4,304,684 | 567,477 |
| Events in quadrant D | 3,301,135 | 553,257 |
| Mode M0 | |||
|---|---|---|---|
| Quadrant | BADHDUFLAG | Total packets | Discarded packets |
| A | 0 | 14303 | 3 |
| B | 0 | 14704 | 2 |
| C | 0 | 16913 | 2 |
| D | 0 | 14025 | 2 |
| Mode M9 | |||
|---|---|---|---|
| Quadrant | BADHDUFLAG | Total packets | Discarded packets |
| A | 0 | 15 | 0 |
| B | 0 | 15 | 0 |
| C | 0 | 15 | 0 |
| D | 0 | 16 | 0 |
| Mode SS | |||
|---|---|---|---|
| Quadrant | BADHDUFLAG | Total packets | Discarded packets |
| A | 0 | 126 | 0 |
| B | 0 | 126 | 0 |
| C | 0 | 126 | 0 |
| D | 0 | 126 | 0 |
| Quadrant | Total seconds | Saturated seconds | Saturation percentage |
|---|---|---|---|
| A | 6280 | 110 | 1.751592% |
| B | 6280 | 186 | 2.961783% |
| C | 6280 | 388 | 6.178344% |
| D | 6280 | 128 | 2.038217% |
Noise dominated data is calculated using 1-second bins in cleaned event files. If a bin has >2000 counts, and if more than 50% of those come from <1% of pixels, then it is considered to be noise-dominated and hence unusable.
| Quadrant | # 1 sec bins | Bins with >0 counts | Bins with >2000 counts | High rate bins dominated by noise | Noise dominated (total time) | Noise dominated (detector-on time) | Marked lightcurve |
|---|---|---|---|---|---|---|---|
| A | 7515 | 6280 | 33 | 33 | 0.44% | 0.53% | 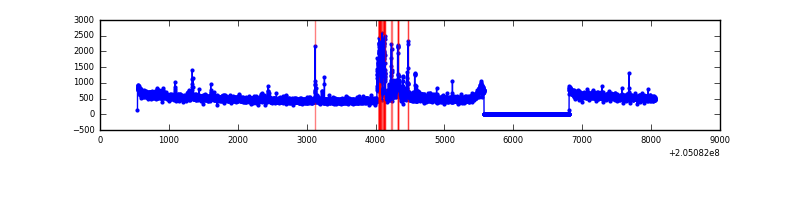 |
| B | 7515 | 6280 | 77 | 77 | 1.02% | 1.23% | 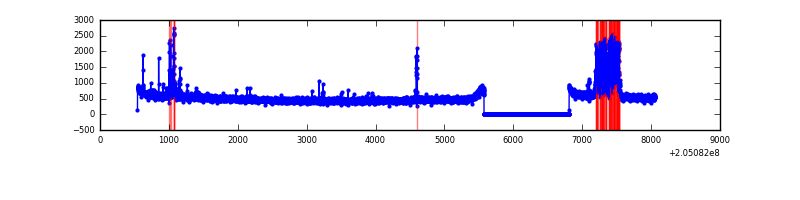 |
| C | 7515 | 6280 | 198 | 198 | 2.63% | 3.15% | 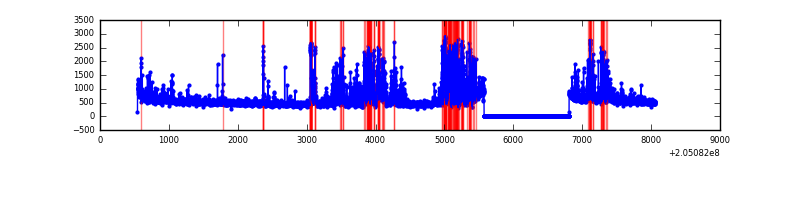 |
| D | 7515 | 6280 | 48 | 48 | 0.64% | 0.76% | 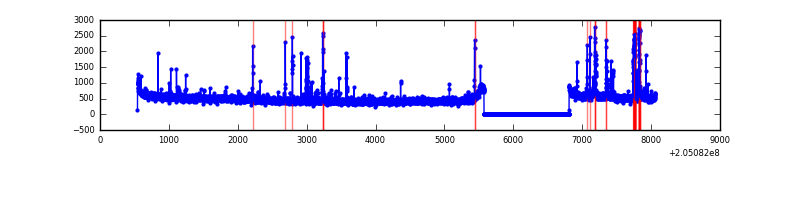 |
Top three noisy pixels from each quadrant. If the there are fewer than three noisy pixels in the level2.evt file, extra rows are filled as -1
| Pixel properties | Quadrant properties | ||||||
|---|---|---|---|---|---|---|---|
| Quadrant | DetID | PixID | Counts | Sigma | Mean | Median | Sigma |
| A | 0 | 199 | 263289 | 1608.23 | 807 | 794 | 163.2 |
| A | 14 | 111 | 38330 | 229.97 | 807 | 794 | 163.2 |
| A | 0 | 226 | 31626 | 188.9 | 807 | 794 | 163.2 |
| B | 10 | 16 | 335312 | 2190.98 | 813 | 797 | 152.7 |
| B | 14 | 167 | 50739 | 327.11 | 813 | 797 | 152.7 |
| B | 15 | 204 | 31049 | 198.14 | 813 | 797 | 152.7 |
| C | 9 | 144 | 1250142 | 6948.08 | 777 | 786 | 179.8 |
| C | 9 | 160 | 10948 | 56.51 | 777 | 786 | 179.8 |
| C | 9 | 176 | 8084 | 40.59 | 777 | 786 | 179.8 |
| D | 10 | 172 | 80797 | 424.01 | 789 | 772 | 188.7 |
| D | 13 | 53 | 74629 | 391.33 | 789 | 772 | 188.7 |
| D | 12 | 233 | 37355 | 193.83 | 789 | 772 | 188.7 |
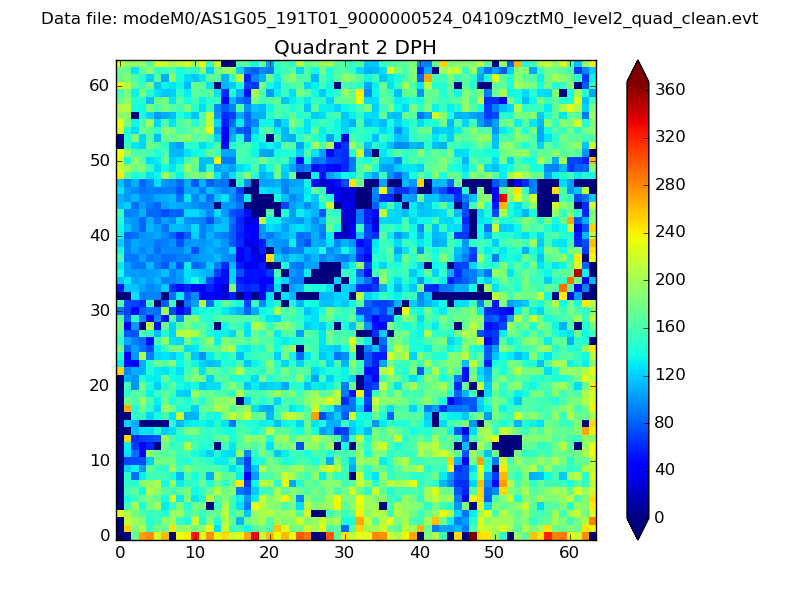
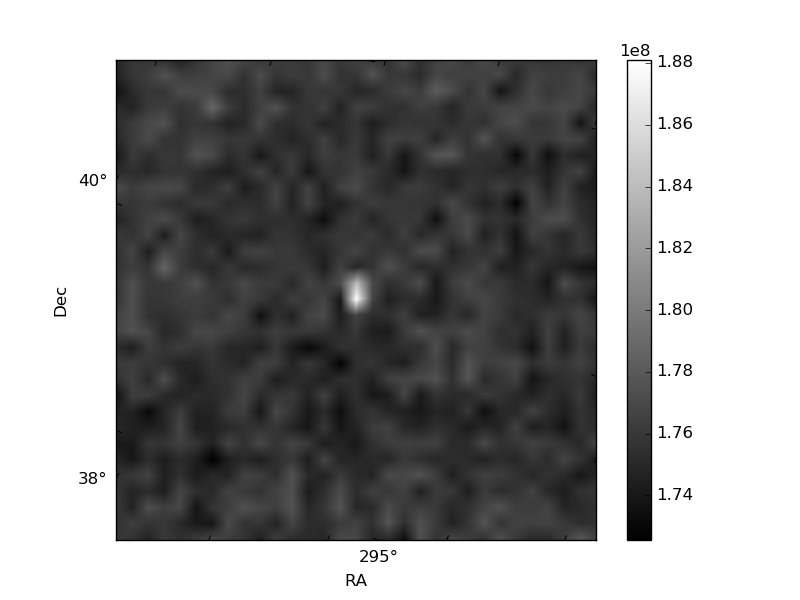
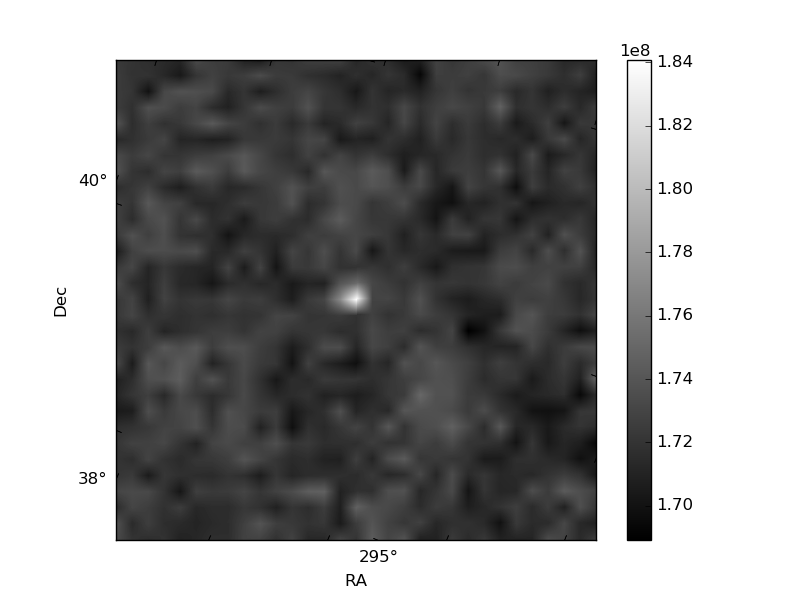
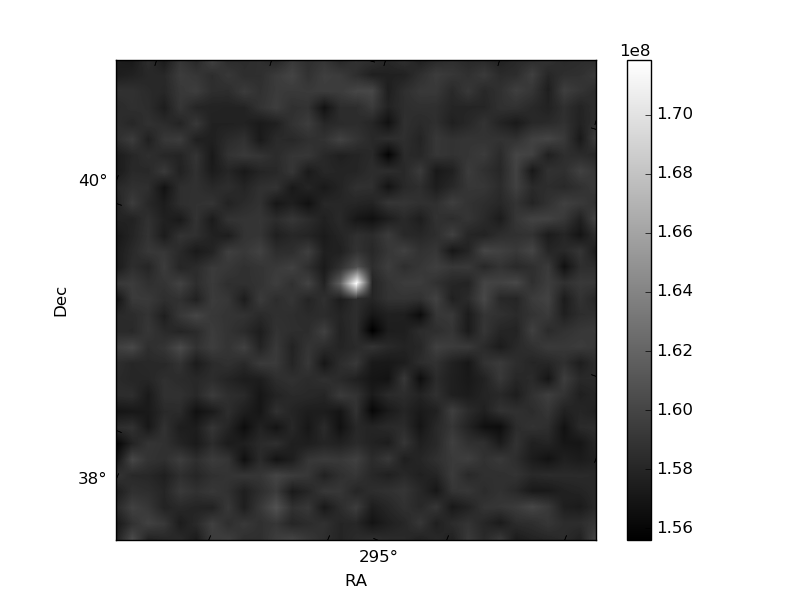
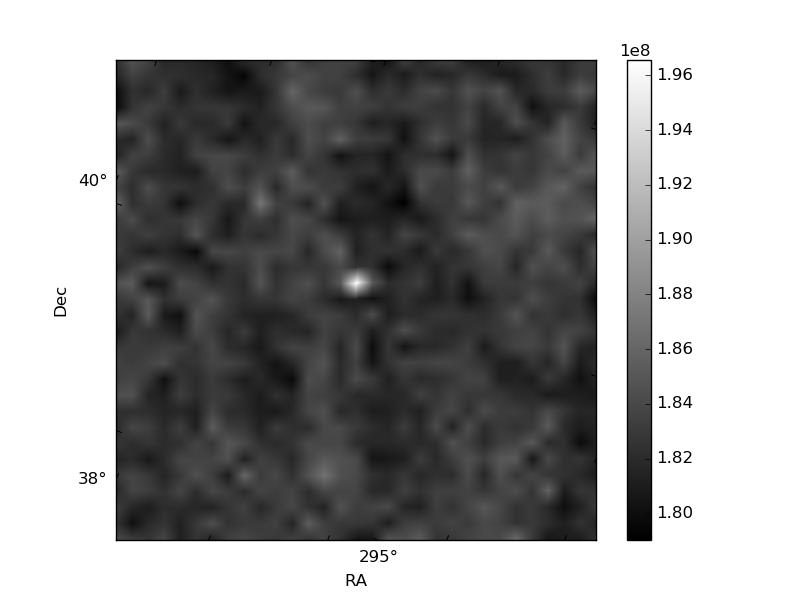
Histogram calculated using DETX and DETY for each event in the final _common_clean file
| Quadrant A | 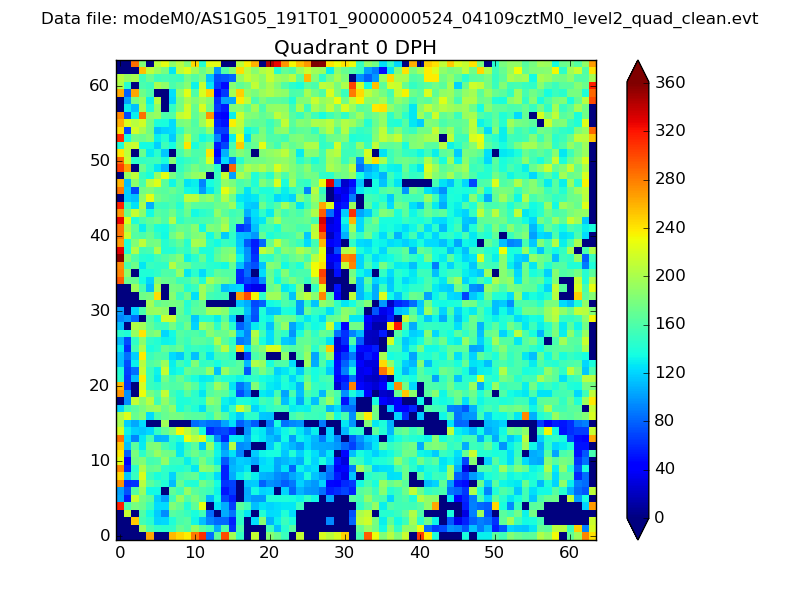 |
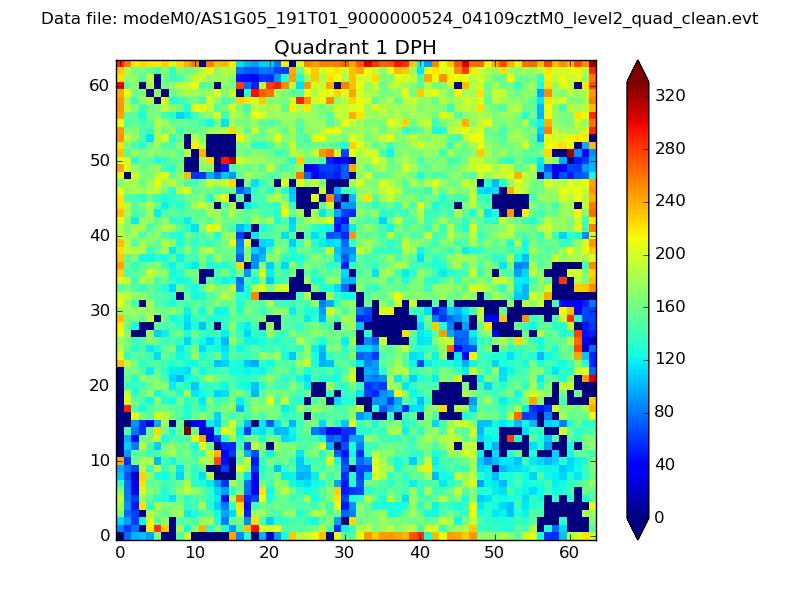 |
Quadrant B |
|---|---|---|---|
| Quadrant D | 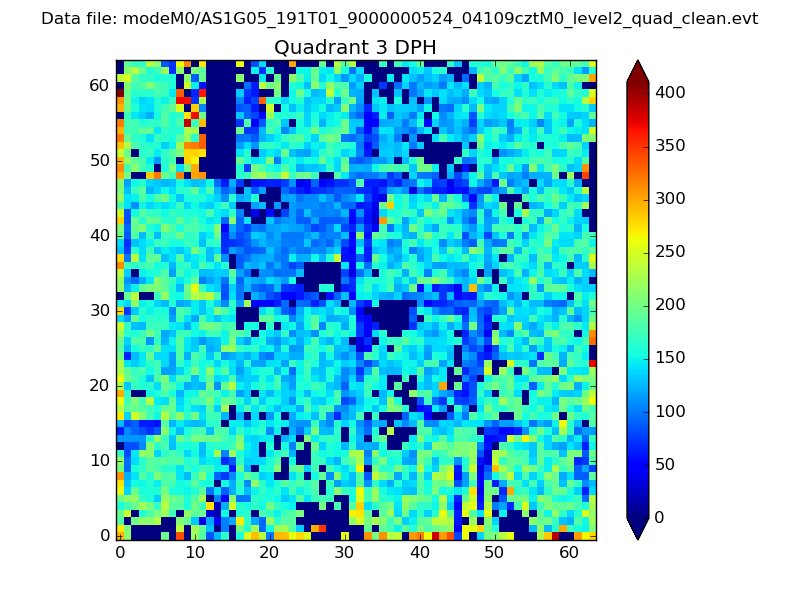 |
 |
Quadrant C |
| Plot type | Count rate plots | Images |
|---|---|---|
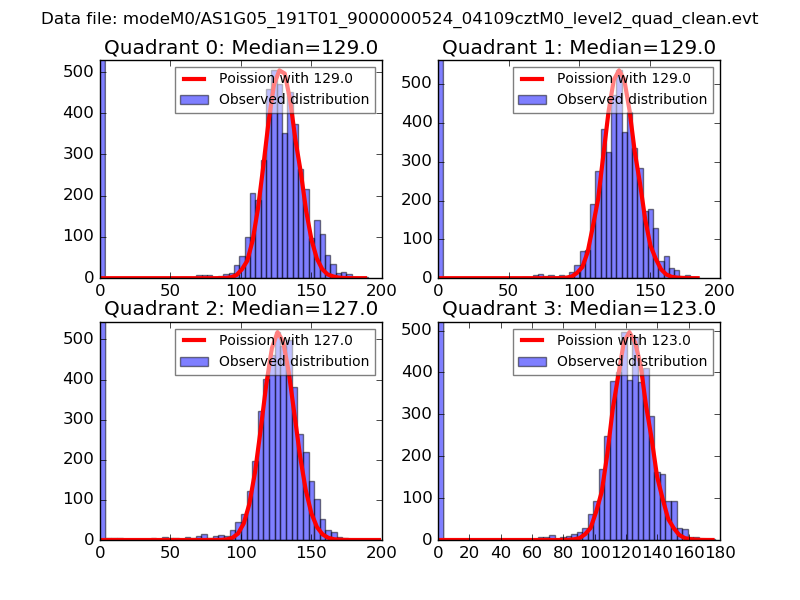
| Comparison with Poisson distribution Blue bars denote a histogram of data divided into 1 sec bins. Red curve is a Poisson curve with rate = median count rate of data. |
 |
 |
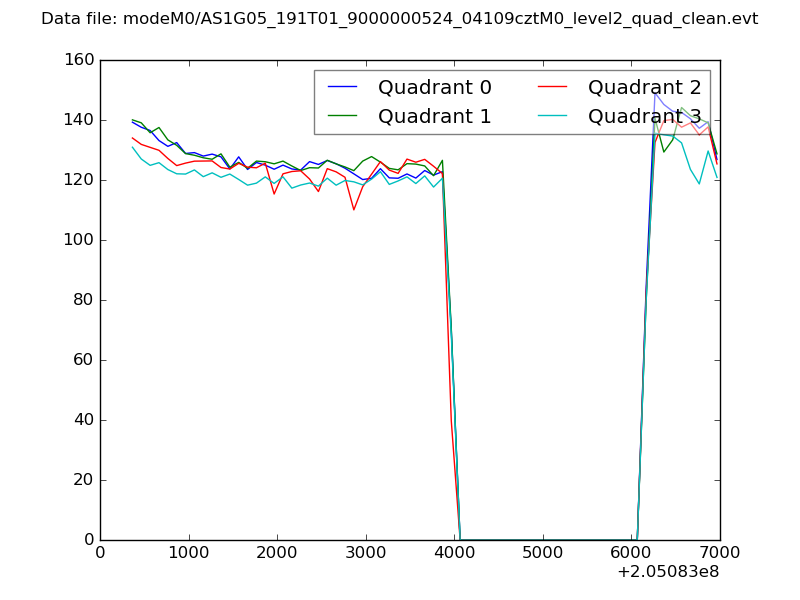
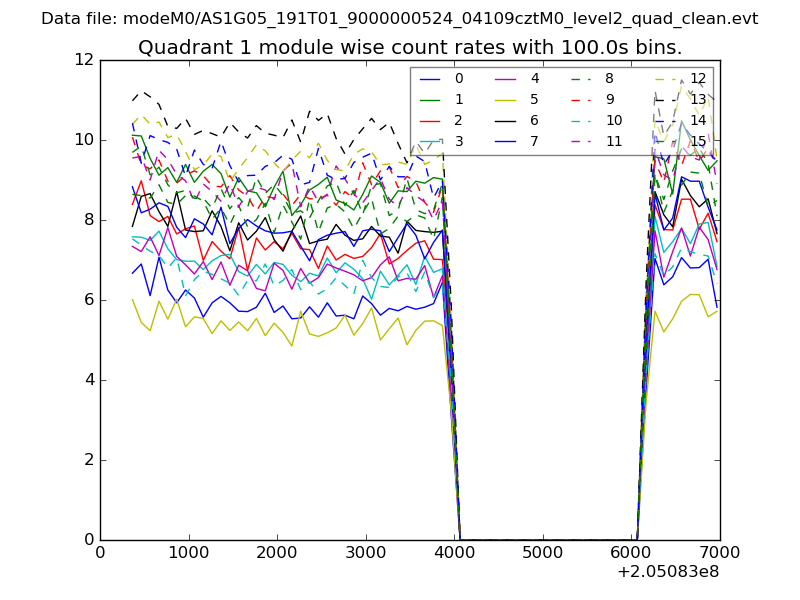
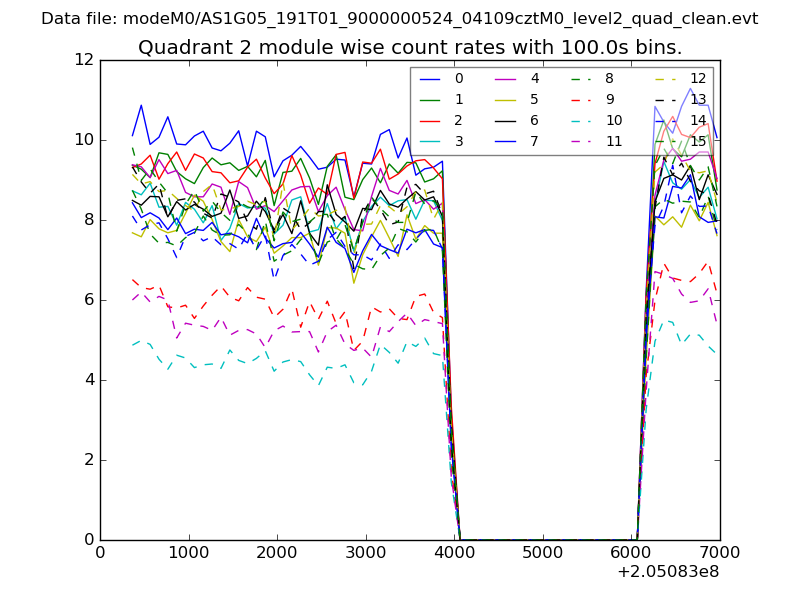
| Quadrant-wise count rates Data is divided into 100 sec bins |
 |
|
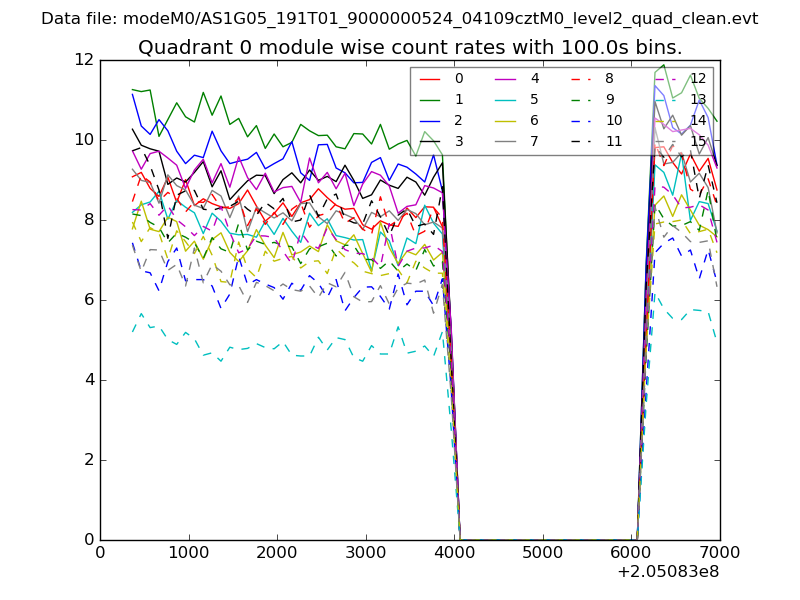
| Module-wise count rates for Quadrant A Data is divided into 100 sec bins |
 |
 |
| Module-wise count rates for Quadrant B Data is divided into 100 sec bins |
 |
 |
| Module-wise count rates for Quadrant C Data is divided into 100 sec bins |
 |
 |
| Module-wise count rates for Quadrant D Data is divided into 100 sec bins |
 |
 |
| Parameter | Plot |
|---|---|
| CZT HV Monitor | 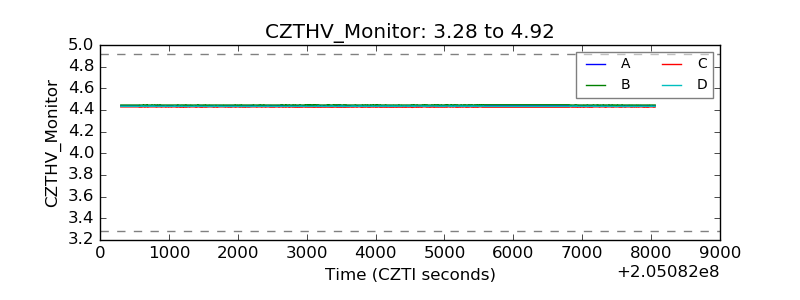 |
| D_VDD | 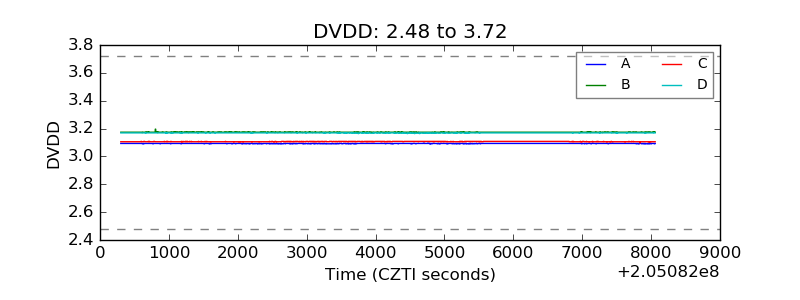 |
| Temperature 1 |  |
| Veto HV Monitor | 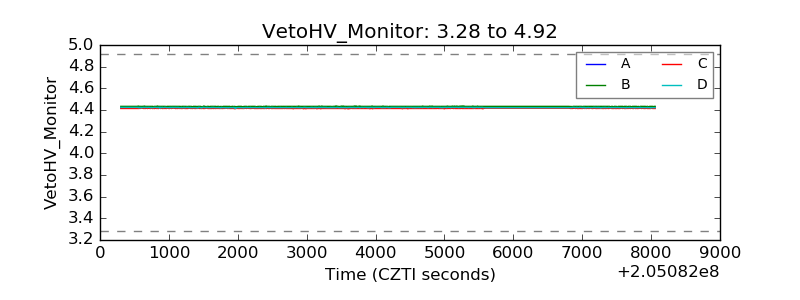 |
| Veto LLD | 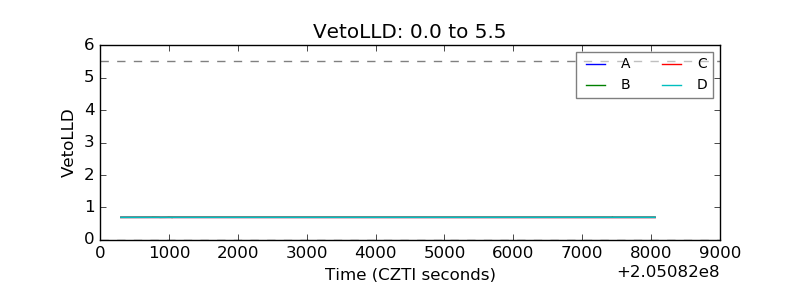 |
| Alpha Counter | 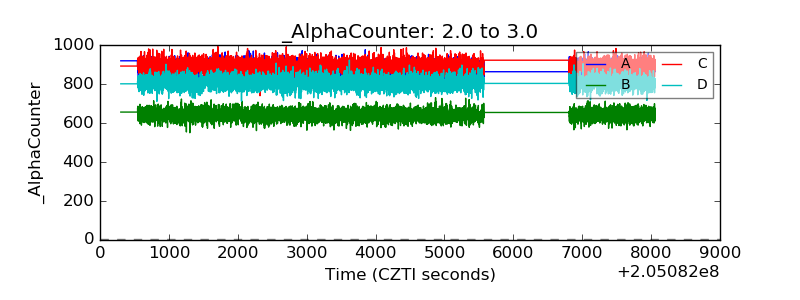 |
| _CPM_Rate | 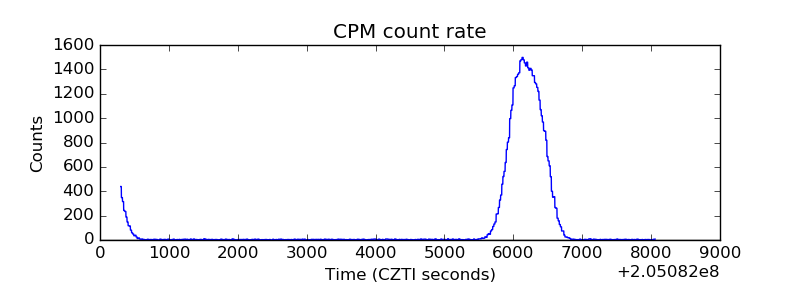 |
| CZT Counter | 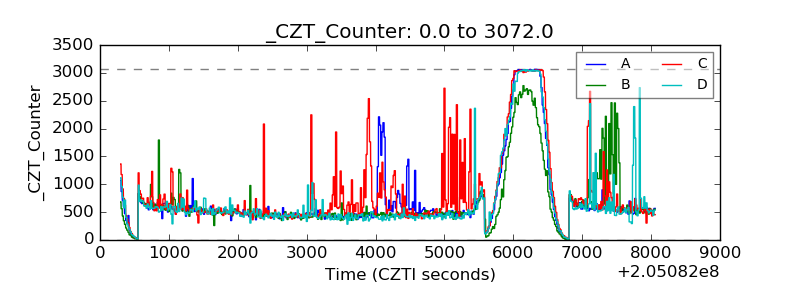 |
| +2.5 Volts monitor |  |
| +5 Volts monitor |  |
| _ROLL_ROT | 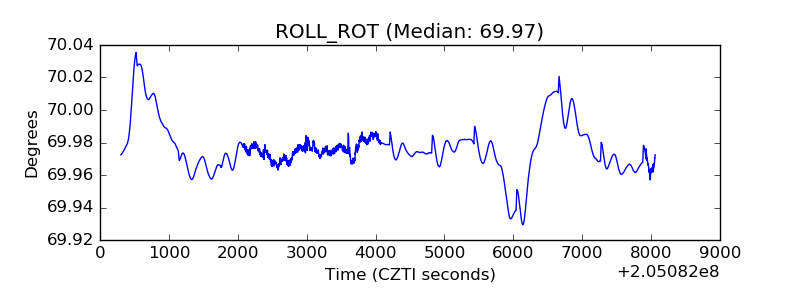 |
| _Roll_DEC | 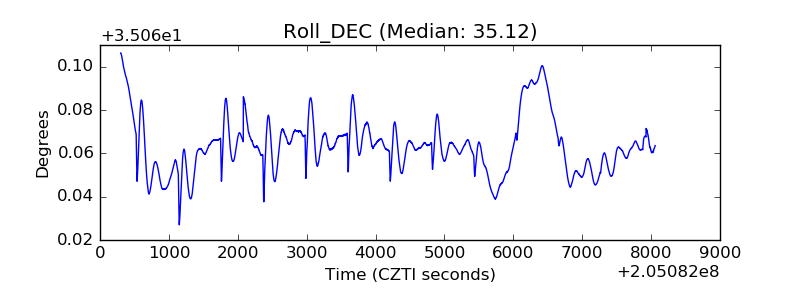 |
| _Roll_RA | 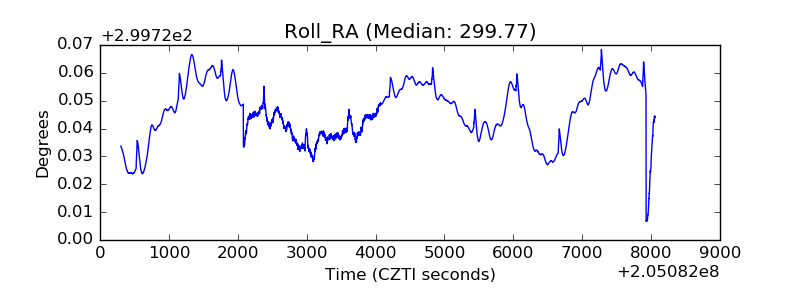 |
| Veto Counter | 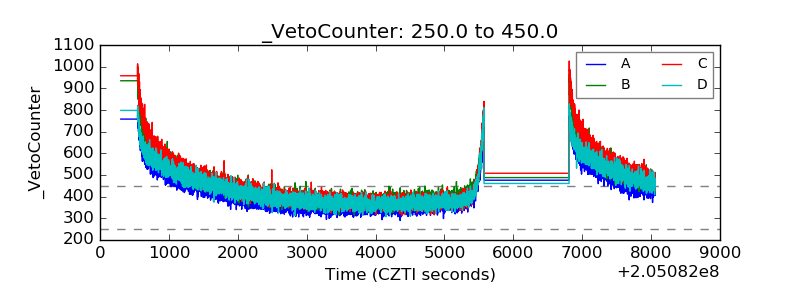 |