| Param | Original file | Final file |
|---|---|---|
| Filename | modeM0/AS1G05_191T01_9000000524_04110cztM0_level2.evt | modeM0/AS1G05_191T01_9000000524_04110cztM0_level2_quad_clean.evt |
| Size (bytes) | 315,417,600 | 67,432,320 |
| Size | 300.8 MB | 64.3 MB |
| Events in quadrant A | 2,521,602 | 446,274 |
| Events in quadrant B | 2,215,516 | 448,825 |
| Events in quadrant C | 2,438,607 | 444,691 |
| Events in quadrant D | 2,113,110 | 429,075 |
| Mode M0 | |||
|---|---|---|---|
| Quadrant | BADHDUFLAG | Total packets | Discarded packets |
| A | 0 | 10031 | 1 |
| B | 0 | 9164 | 1 |
| C | 0 | 9817 | 1 |
| D | 0 | 8919 | 1 |
| Mode M9 | |||
|---|---|---|---|
| Quadrant | BADHDUFLAG | Total packets | Discarded packets |
| A | 0 | 9 | 0 |
| B | 0 | 9 | 0 |
| C | 0 | 9 | 0 |
| D | 0 | 10 | 0 |
| Mode SS | |||
|---|---|---|---|
| Quadrant | BADHDUFLAG | Total packets | Discarded packets |
| A | 0 | 76 | 0 |
| B | 0 | 76 | 0 |
| C | 0 | 76 | 0 |
| D | 0 | 76 | 0 |
| Quadrant | Total seconds | Saturated seconds | Saturation percentage |
|---|---|---|---|
| A | 3872 | 65 | 1.678719% |
| B | 3872 | 98 | 2.530992% |
| C | 3872 | 83 | 2.143595% |
| D | 3872 | 61 | 1.575413% |
Noise dominated data is calculated using 1-second bins in cleaned event files. If a bin has >2000 counts, and if more than 50% of those come from <1% of pixels, then it is considered to be noise-dominated and hence unusable.
| Quadrant | # 1 sec bins | Bins with >0 counts | Bins with >2000 counts | High rate bins dominated by noise | Noise dominated (total time) | Noise dominated (detector-on time) | Marked lightcurve |
|---|---|---|---|---|---|---|---|
| A | 3872 | 3872 | 85 | 85 | 2.20% | 2.20% | 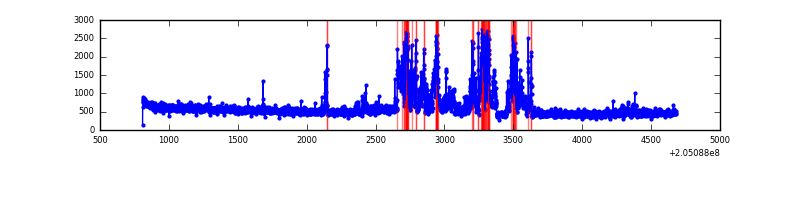 |
| B | 3872 | 3872 | 69 | 69 | 1.78% | 1.78% | 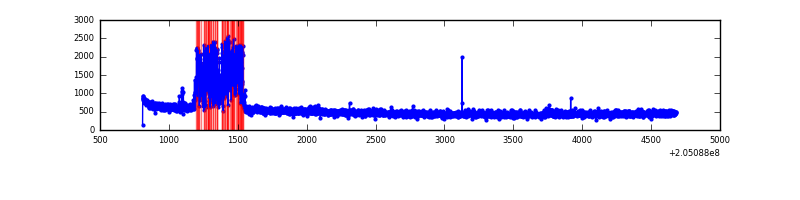 |
| C | 3872 | 3872 | 50 | 50 | 1.29% | 1.29% | 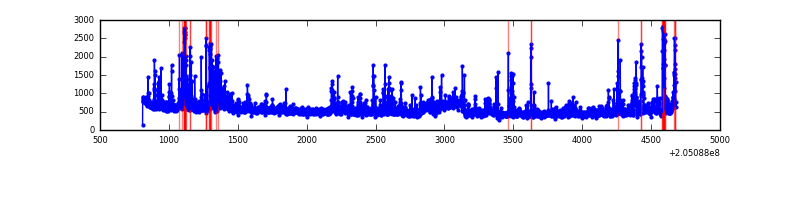 |
| D | 3872 | 3872 | 47 | 47 | 1.21% | 1.21% | 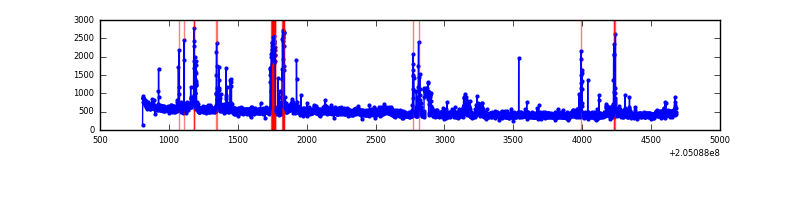 |
Top three noisy pixels from each quadrant. If the there are fewer than three noisy pixels in the level2.evt file, extra rows are filled as -1
| Pixel properties | Quadrant properties | ||||||
|---|---|---|---|---|---|---|---|
| Quadrant | DetID | PixID | Counts | Sigma | Mean | Median | Sigma |
| A | 0 | 199 | 607191 | 6289.7 | 476 | 468 | 96.5 |
| A | 0 | 226 | 58109 | 597.55 | 476 | 468 | 96.5 |
| A | 0 | 50 | 17000 | 171.38 | 476 | 468 | 96.5 |
| B | 10 | 16 | 320855 | 3528.22 | 482 | 472 | 90.8 |
| B | 15 | 204 | 18297 | 196.3 | 482 | 472 | 90.8 |
| B | 12 | 111 | 7644 | 78.98 | 482 | 472 | 90.8 |
| C | 9 | 144 | 589584 | 5407.24 | 470 | 477 | 108.9 |
| C | 4 | 254 | 8484 | 73.49 | 470 | 477 | 108.9 |
| C | 13 | 61 | 3795 | 30.45 | 470 | 477 | 108.9 |
| D | 13 | 53 | 126540 | 1112.12 | 468 | 456 | 113.4 |
| D | 10 | 172 | 93112 | 817.27 | 468 | 456 | 113.4 |
| D | 12 | 233 | 38832 | 338.49 | 468 | 456 | 113.4 |
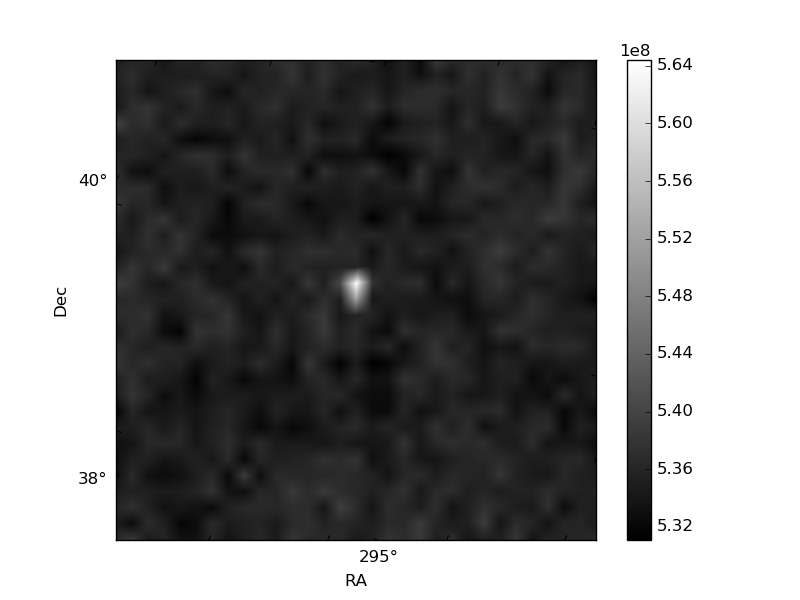
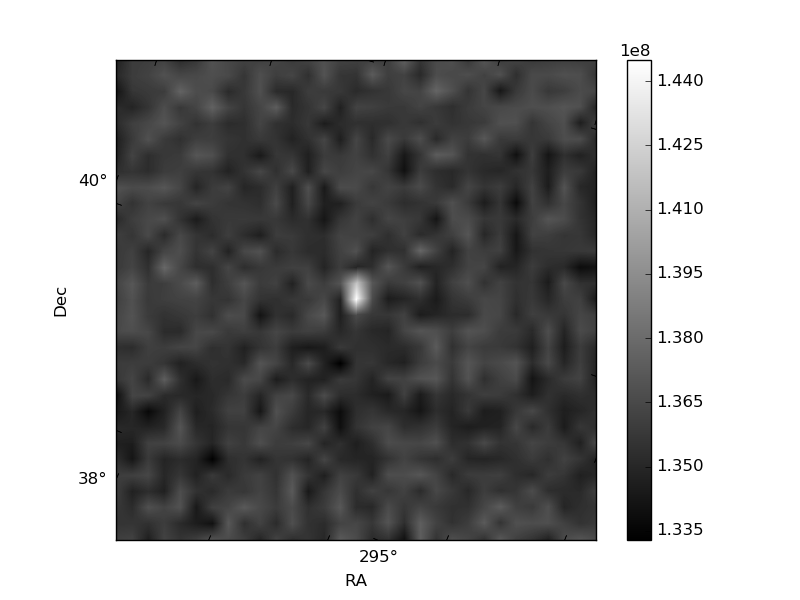
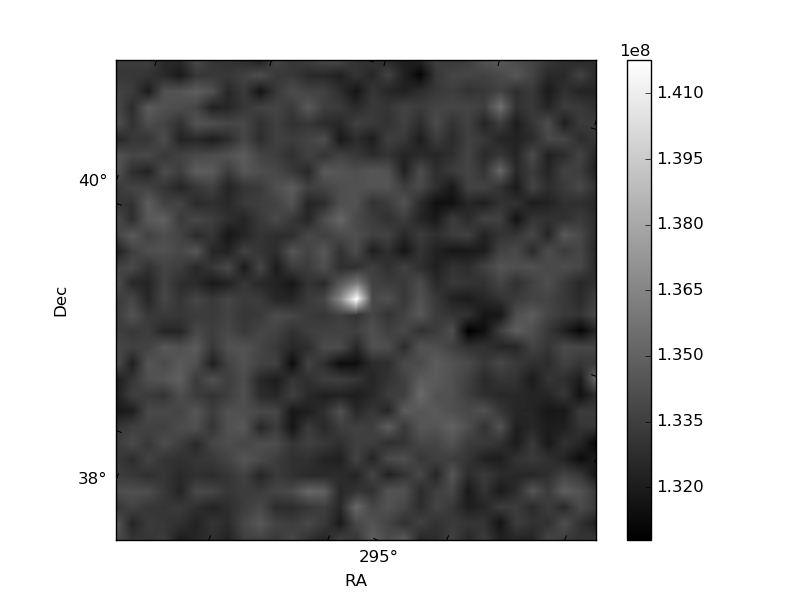
Histogram calculated using DETX and DETY for each event in the final _common_clean file
| Quadrant A | 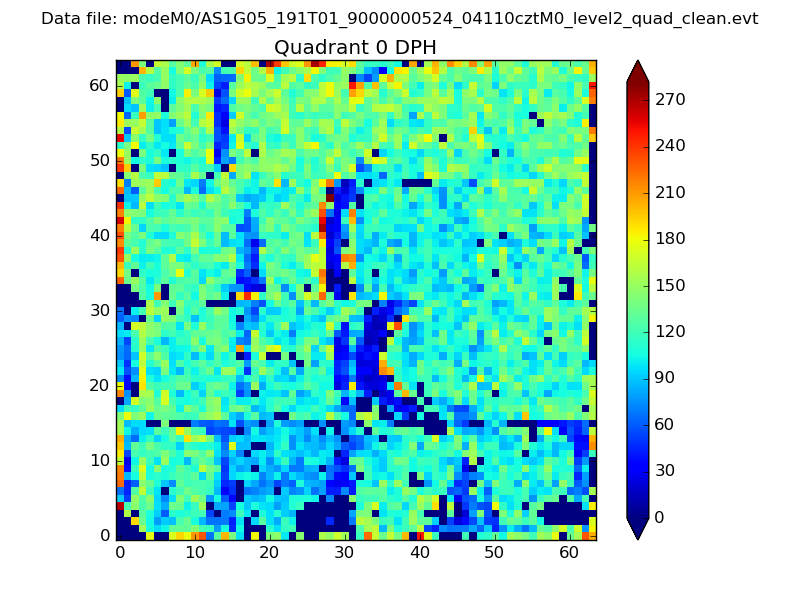 |
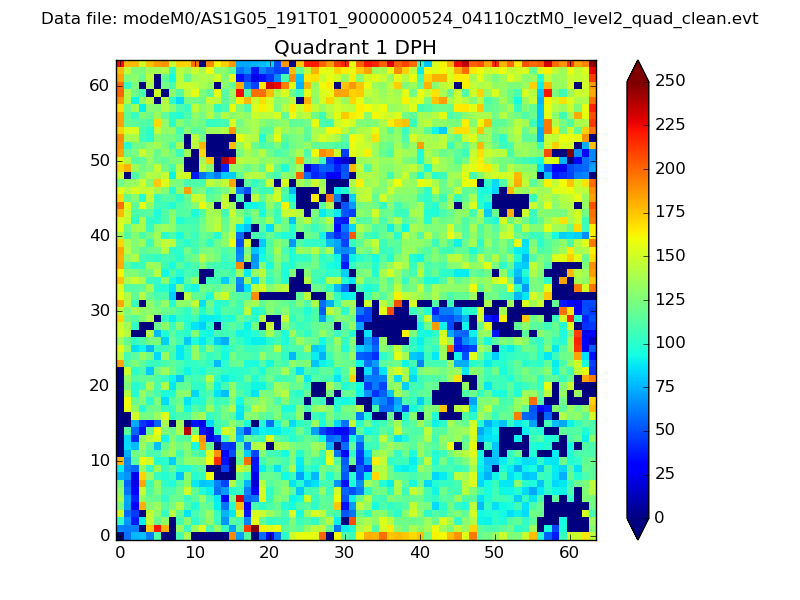 |
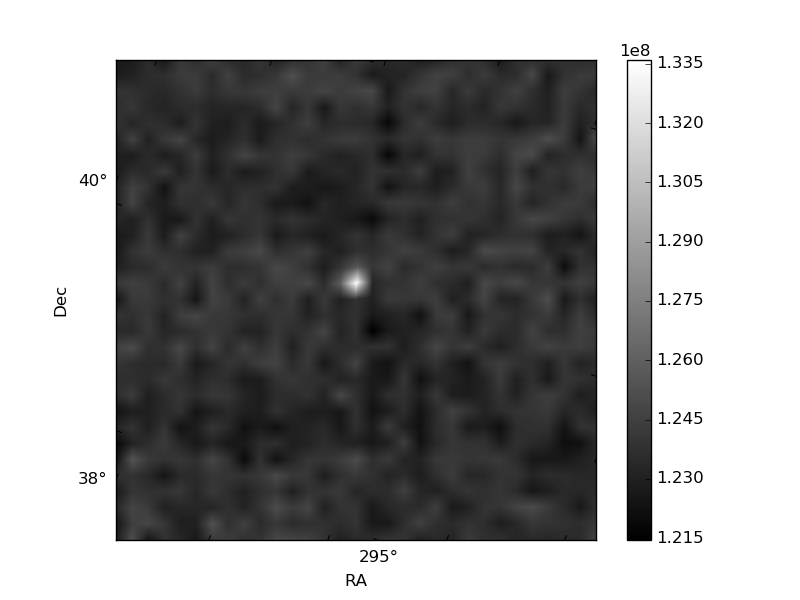
Quadrant B |
|---|---|---|---|
| Quadrant D | 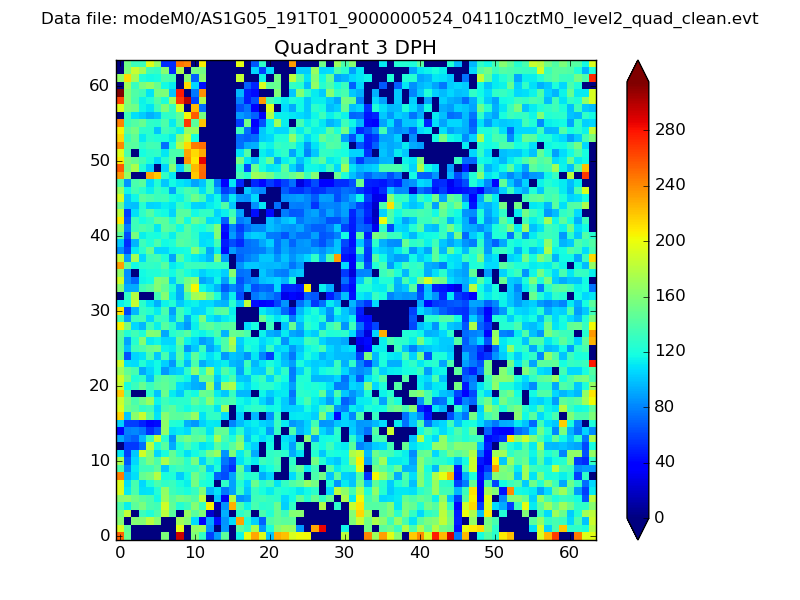 |
 |
Quadrant C |
| Plot type | Count rate plots | Images |
|---|---|---|
| Comparison with Poisson distribution Blue bars denote a histogram of data divided into 1 sec bins. Red curve is a Poisson curve with rate = median count rate of data. |
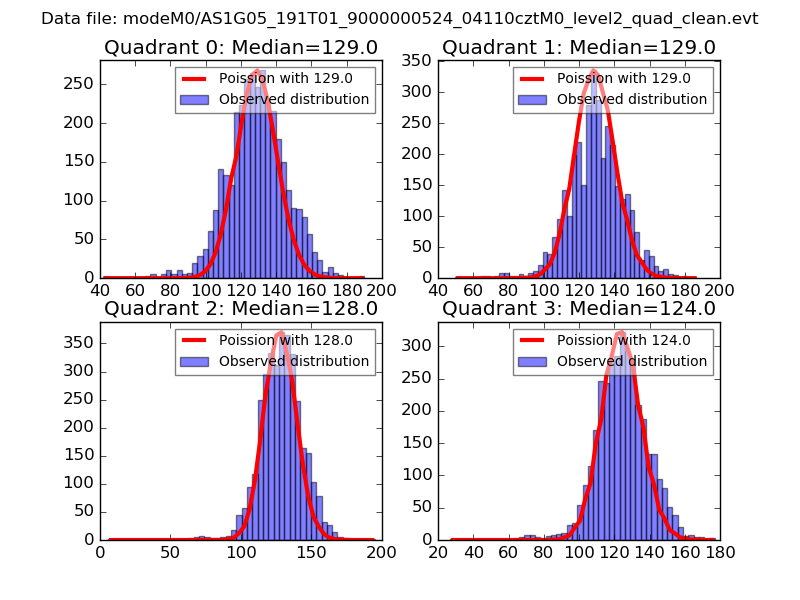 |
 |
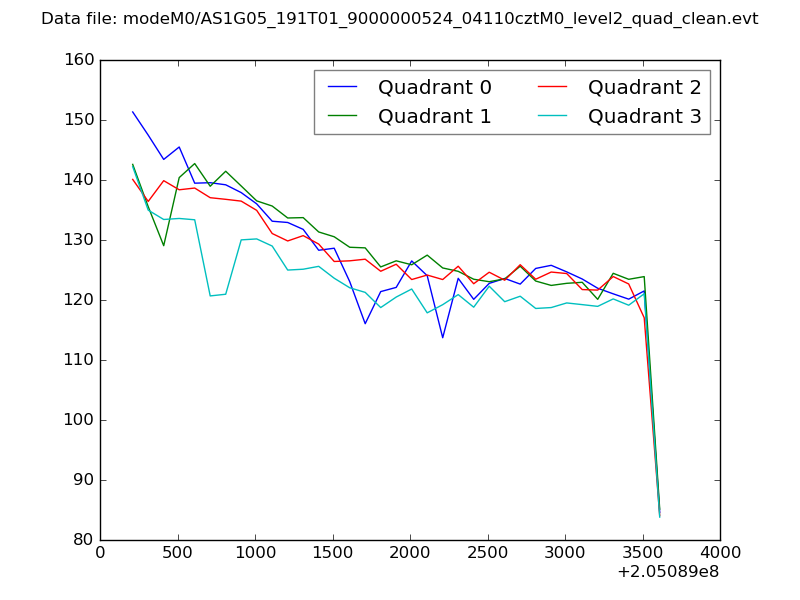
| Quadrant-wise count rates Data is divided into 100 sec bins |
 |
|
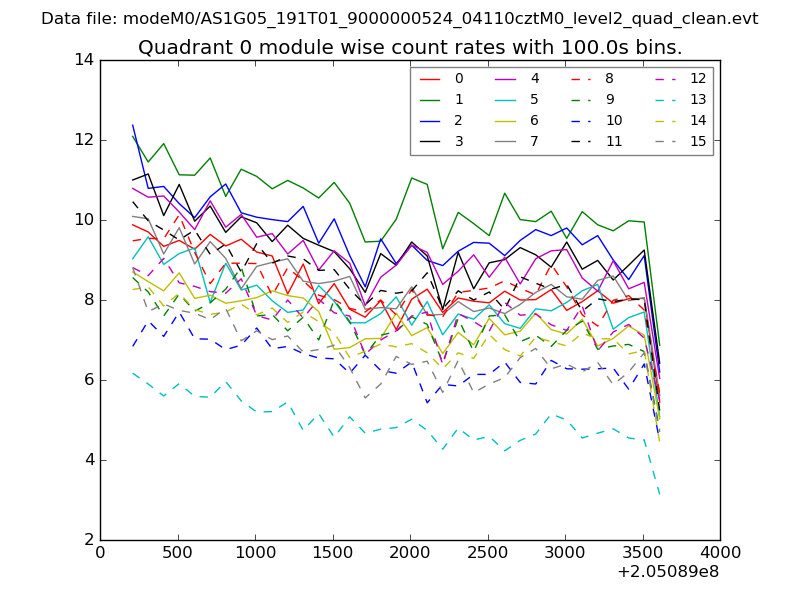
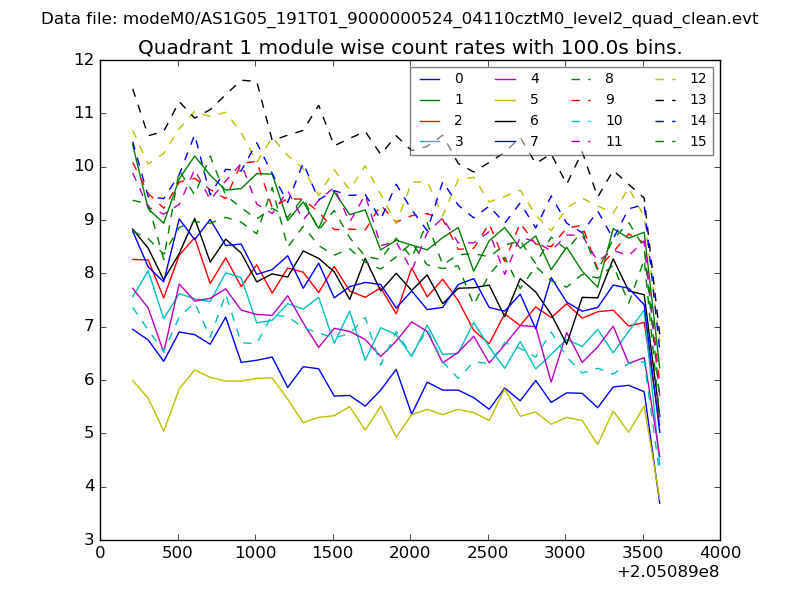
| Module-wise count rates for Quadrant A Data is divided into 100 sec bins |
 |
 |
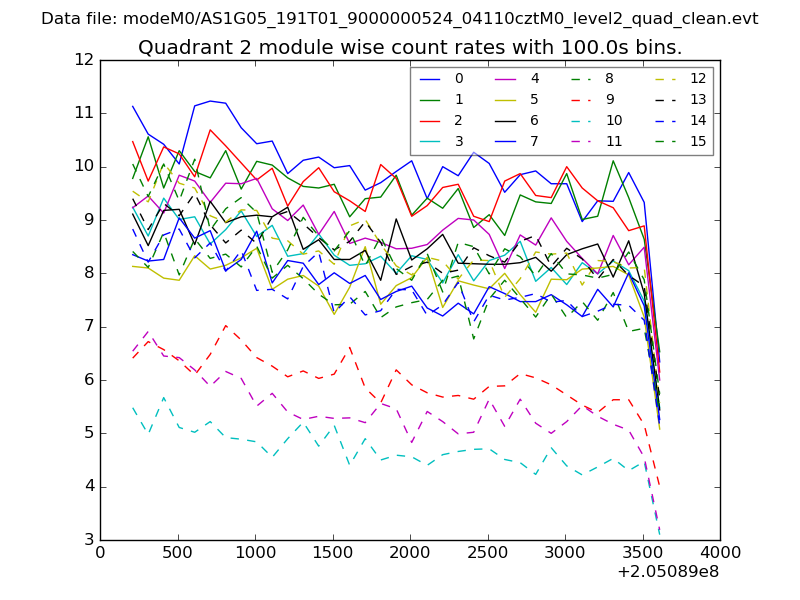
| Module-wise count rates for Quadrant B Data is divided into 100 sec bins |
 |
 |
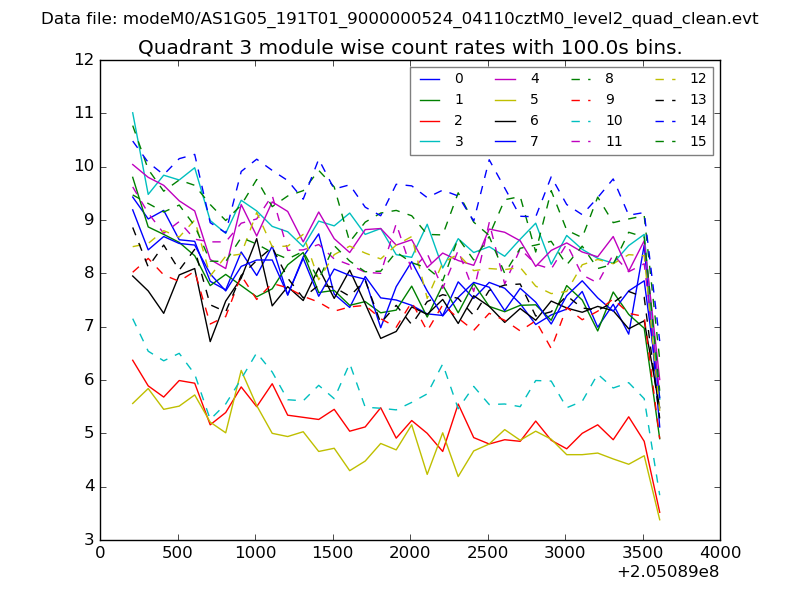
| Module-wise count rates for Quadrant C Data is divided into 100 sec bins |
 |
 |
| Module-wise count rates for Quadrant D Data is divided into 100 sec bins |
 |
 |
| Parameter | Plot |
|---|---|
| CZT HV Monitor | 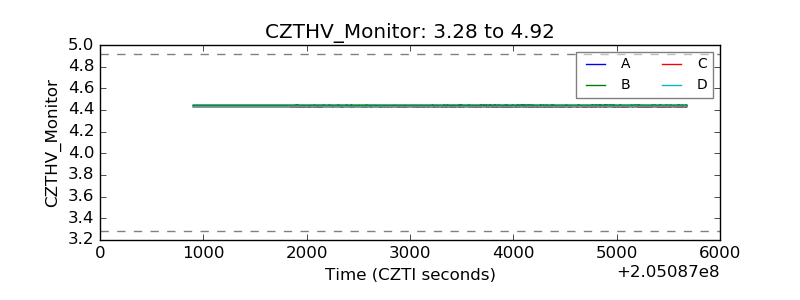 |
| D_VDD | 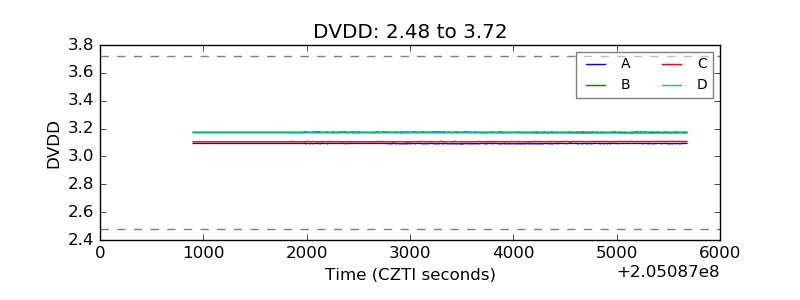 |
| Temperature 1 | 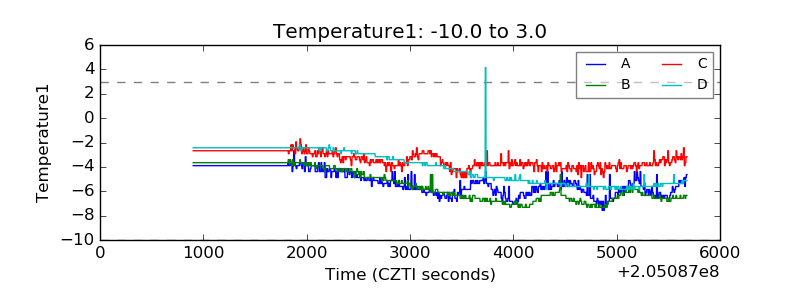 |
| Veto HV Monitor | 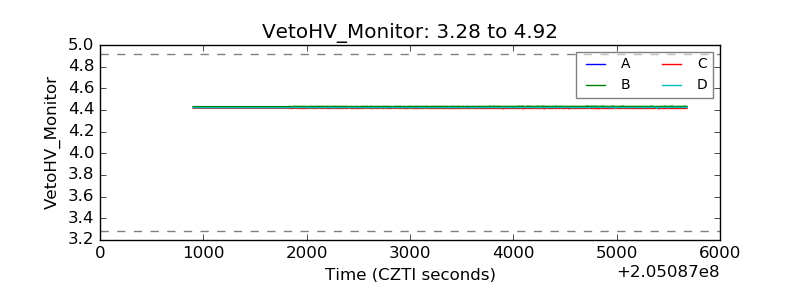 |
| Veto LLD | 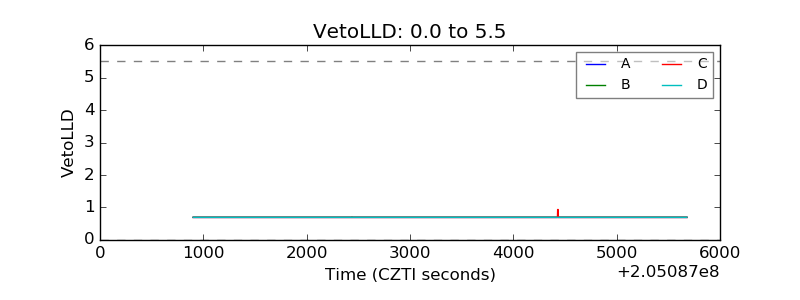 |
| Alpha Counter | 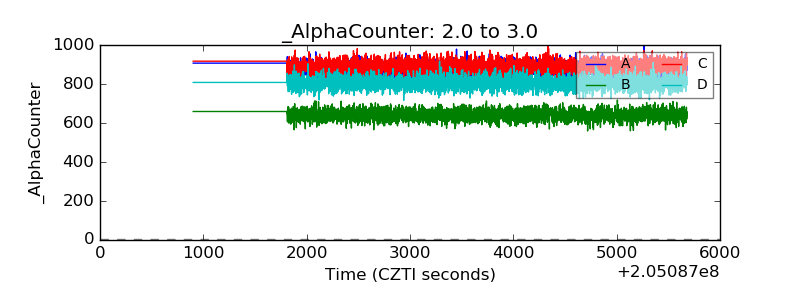 |
| _CPM_Rate | 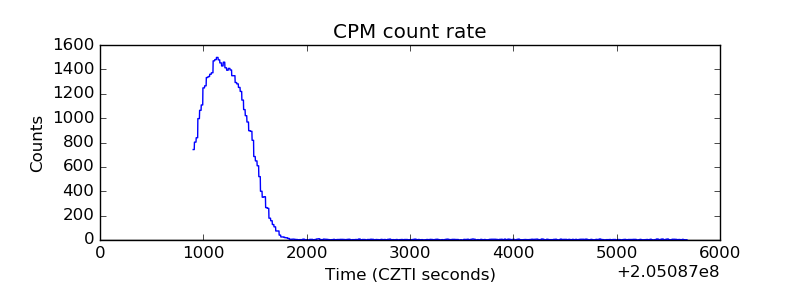 |
| CZT Counter | 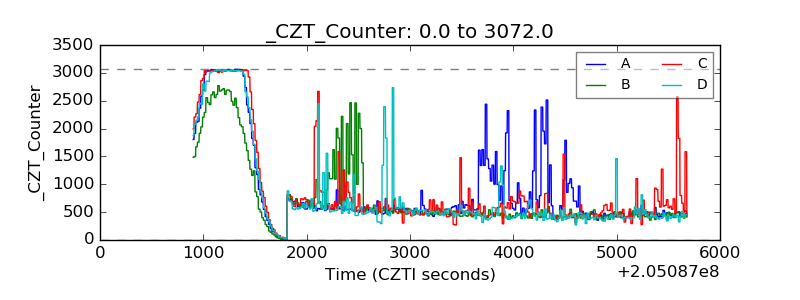 |
| +2.5 Volts monitor | 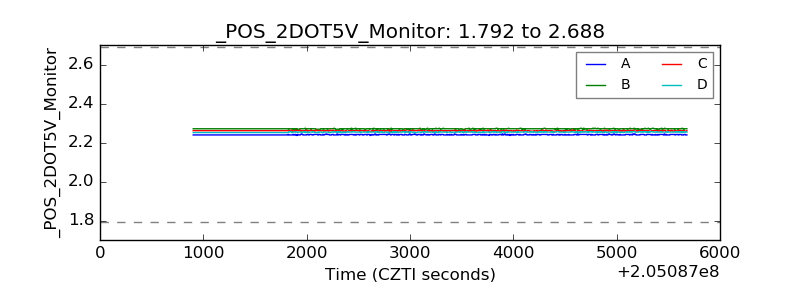 |
| +5 Volts monitor |  |
| _ROLL_ROT | 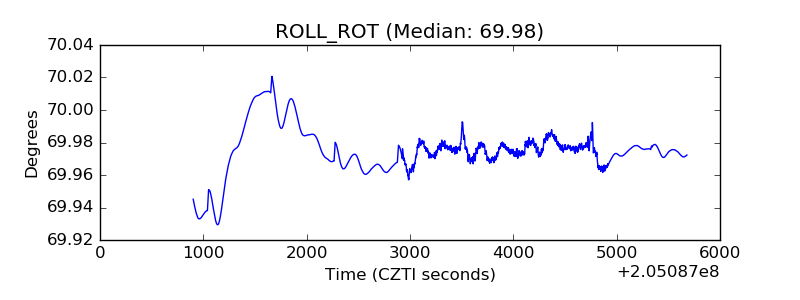 |
| _Roll_DEC | 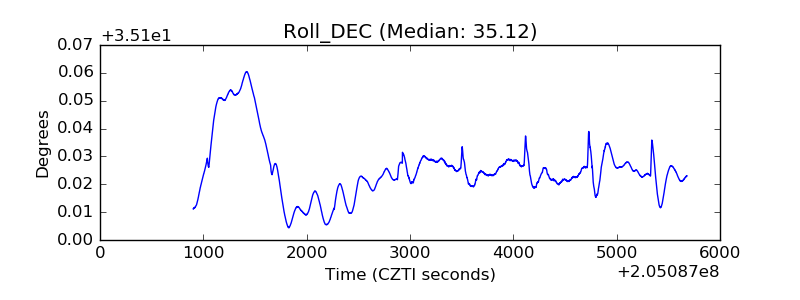 |
| _Roll_RA | 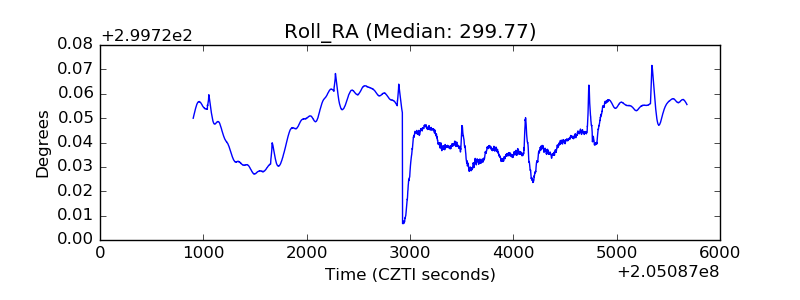 |
| Veto Counter | 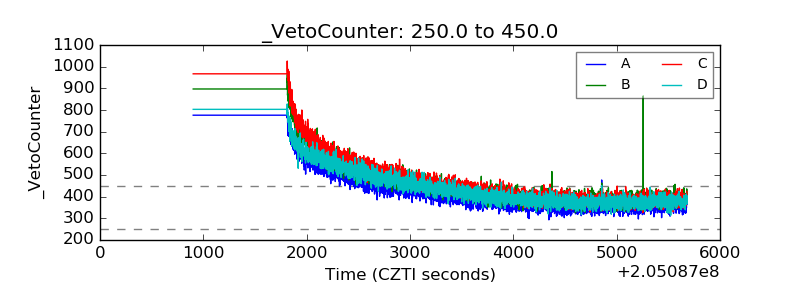 |