| Param | Original file | Final file |
|---|---|---|
| Filename | modeM0/AS1G05_192T01_9000000526cztM0_level2.fits | modeM0/AS1G05_192T01_9000000526cztM0_level2_quad_clean.evt |
| Size (bytes) | 167,964,480 | 168,163,200 |
| Size | 160.2 MB | 160.4 MB |
| Events in quadrant A | 988,090 | 953,093 |
| Events in quadrant B | 991,720 | 1,013,671 |
| Events in quadrant C | 976,864 | 966,463 |
| Events in quadrant D | 875,136 | 904,683 |
| Mode SS | |||
|---|---|---|---|
| Quadrant | BADHDUFLAG | Total packets | Discarded packets |
| A | 0 | 374 | 0 |
| B | 0 | 374 | 0 |
| C | 0 | 374 | 0 |
| D | 0 | 374 | 0 |
| Mode M9 | |||
|---|---|---|---|
| Quadrant | BADHDUFLAG | Total packets | Discarded packets |
| A | 0 | 45 | 0 |
| B | 0 | 45 | 0 |
| C | 0 | 45 | 0 |
| D | 0 | 45 | 0 |
| Mode M0 | |||
|---|---|---|---|
| Quadrant | BADHDUFLAG | Total packets | Discarded packets |
| A | 0 | 44704 | 0 |
| B | 0 | 38667 | 0 |
| C | 0 | 45571 | 0 |
| D | 0 | 39027 | 0 |
| Quadrant | Total seconds | Saturated seconds | Saturation percentage |
|---|---|---|---|
| A | 18192 | 959 | 5.271548% |
| B | 18192 | 202 | 1.110378% |
| C | 18192 | 1155 | 6.348945% |
| D | 18192 | 218 | 1.198329% |
Noise dominated data is calculated using 1-second bins in cleaned event files. If a bin has >2000 counts, and if more than 50% of those come from <1% of pixels, then it is considered to be noise-dominated and hence unusable.
| Quadrant | # 1 sec bins | Bins with >0 counts | Bins with >2000 counts | High rate bins dominated by noise | Noise dominated (total time) | Noise dominated (detector-on time) | Marked lightcurve |
|---|---|---|---|---|---|---|---|
| A | 22736 | 18094 | 0 | 0 | 0.00% | 0.00% |  |
| B | 22736 | 18187 | 0 | 0 | 0.00% | 0.00% |  |
| C | 22736 | 18142 | 0 | 0 | 0.00% | 0.00% |  |
| D | 22736 | 18187 | 0 | 0 | 0.00% | 0.00% |  |
Top three noisy pixels from each quadrant. If the there are fewer than three noisy pixels in the level2.evt file, extra rows are filled as -1
| Pixel properties | Quadrant properties | ||||||
|---|---|---|---|---|---|---|---|
| Quadrant | DetID | PixID | Counts | Sigma | Mean | Median | Sigma |
| A | 14 | 188 | 948 | 10.48 | 256 | 239 | 67.6 |
| A | 0 | 29 | 921 | 10.08 | 256 | 239 | 67.6 |
| A | 7 | 110 | 840 | 8.89 | 256 | 239 | 67.6 |
| B | 2 | 9 | 777 | 9.33 | 262 | 248 | 56.7 |
| B | 12 | 226 | 699 | 7.96 | 262 | 248 | 56.7 |
| B | 5 | 128 | 687 | 7.75 | 262 | 248 | 56.7 |
| C | 1 | 80 | 710 | 6.67 | 258 | 240 | 70.5 |
| C | 1 | 81 | 702 | 6.56 | 258 | 240 | 70.5 |
| C | 9 | 188 | 661 | 5.97 | 258 | 240 | 70.5 |
| D | 11 | 82 | 743 | 7.69 | 248 | 225 | 67.4 |
| D | 1 | 19 | 677 | 6.71 | 248 | 225 | 67.4 |
| D | 3 | 31 | 643 | 6.2 | 248 | 225 | 67.4 |
Histogram calculated using DETX and DETY for each event in the final _common_clean file
| Quadrant A | 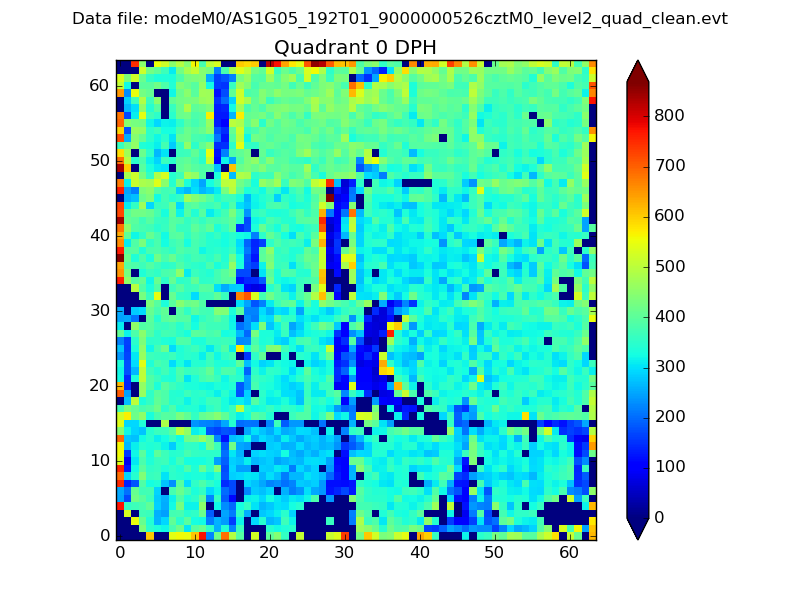 |
 |
Quadrant B |
|---|---|---|---|
| Quadrant D |  |
 |
Quadrant C |
| Plot type | Count rate plots | Images |
|---|---|---|
| Comparison with Poisson distribution Blue bars denote a histogram of data divided into 1 sec bins. Red curve is a Poisson curve with rate = median count rate of data. |
 |
 |
| Quadrant-wise count rates Data is divided into 100 sec bins |
 |
|
| Module-wise count rates for Quadrant A Data is divided into 100 sec bins |
 |
 |
| Module-wise count rates for Quadrant B Data is divided into 100 sec bins |
 |
 |
| Module-wise count rates for Quadrant C Data is divided into 100 sec bins |
 |
 |
| Module-wise count rates for Quadrant D Data is divided into 100 sec bins |
 |
 |
| Parameter | Plot |
|---|---|
| CZT HV Monitor |  |
| D_VDD | 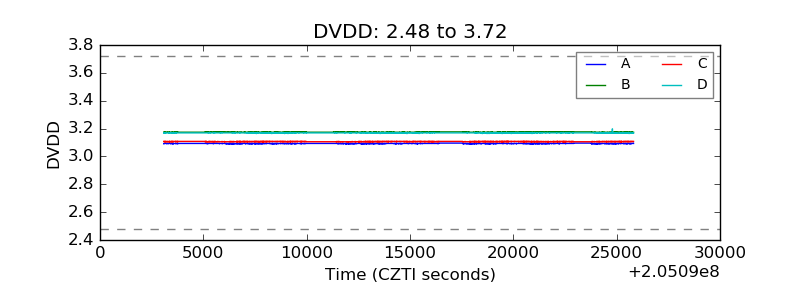 |
| Temperature 1 |  |
| Veto HV Monitor |  |
| Veto LLD |  |
| Alpha Counter |  |
| _CPM_Rate |  |
| CZT Counter |  |
| +2.5 Volts monitor |  |
| +5 Volts monitor |  |
| _ROLL_ROT |  |
| _Roll_DEC |  |
| _Roll_RA |  |
| Veto Counter |  |