| Param | Original file | Final file |
|---|---|---|
| Filename | modeM0/AS1G05_192T01_9000000526_04110cztM0_level2.evt | modeM0/AS1G05_192T01_9000000526_04110cztM0_level2_quad_clean.evt |
| Size (bytes) | 149,221,440 | 23,025,600 |
| Size | 142.3 MB | 22.0 MB |
| Events in quadrant A | 1,029,613 | 140,704 |
| Events in quadrant B | 1,052,696 | 144,148 |
| Events in quadrant C | 1,283,586 | 138,862 |
| Events in quadrant D | 1,021,138 | 133,841 |
| Mode SS | |||
|---|---|---|---|
| Quadrant | BADHDUFLAG | Total packets | Discarded packets |
| A | 0 | 40 | 0 |
| B | 0 | 40 | 0 |
| C | 0 | 40 | 0 |
| D | 0 | 40 | 0 |
| Mode M9 | |||
|---|---|---|---|
| Quadrant | BADHDUFLAG | Total packets | Discarded packets |
| A | 0 | 13 | 0 |
| B | 0 | 13 | 0 |
| C | 0 | 13 | 0 |
| D | 0 | 13 | 0 |
| Mode M0 | |||
|---|---|---|---|
| Quadrant | BADHDUFLAG | Total packets | Discarded packets |
| A | 0 | 4192 | 2 |
| B | 0 | 4282 | 1 |
| C | 0 | 5023 | 1 |
| D | 0 | 4191 | 1 |
| Quadrant | Total seconds | Saturated seconds | Saturation percentage |
|---|---|---|---|
| A | 1908 | 71 | 3.721174% |
| B | 1908 | 80 | 4.192872% |
| C | 1908 | 139 | 7.285115% |
| D | 1908 | 73 | 3.825996% |
Noise dominated data is calculated using 1-second bins in cleaned event files. If a bin has >2000 counts, and if more than 50% of those come from <1% of pixels, then it is considered to be noise-dominated and hence unusable.
| Quadrant | # 1 sec bins | Bins with >0 counts | Bins with >2000 counts | High rate bins dominated by noise | Noise dominated (total time) | Noise dominated (detector-on time) | Marked lightcurve |
|---|---|---|---|---|---|---|---|
| A | 3193 | 1908 | 0 | 0 | 0.00% | 0.00% | 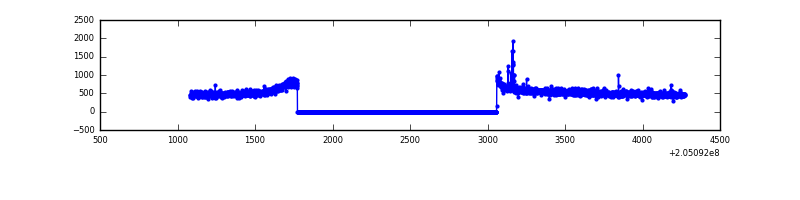 |
| B | 3193 | 1908 | 0 | 0 | 0.00% | 0.00% | 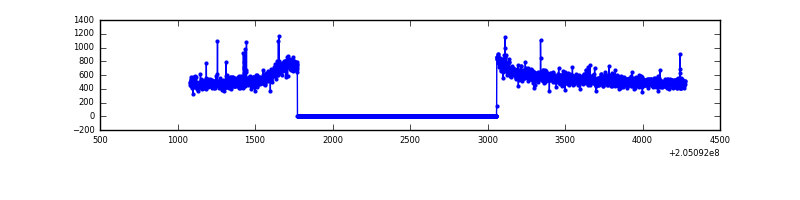 |
| C | 3193 | 1908 | 51 | 51 | 1.60% | 2.67% | 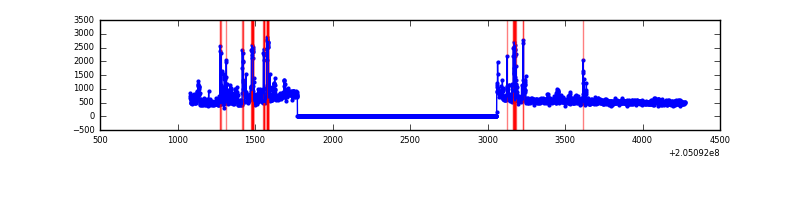 |
| D | 3193 | 1908 | 7 | 7 | 0.22% | 0.37% | 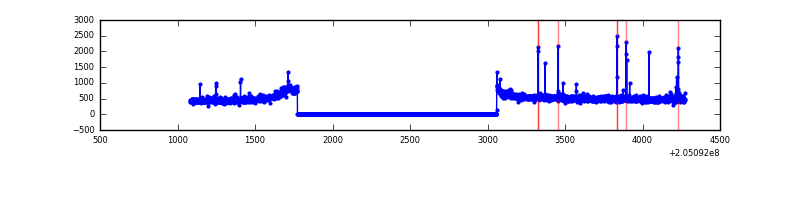 |
Top three noisy pixels from each quadrant. If the there are fewer than three noisy pixels in the level2.evt file, extra rows are filled as -1
| Pixel properties | Quadrant properties | ||||||
|---|---|---|---|---|---|---|---|
| Quadrant | DetID | PixID | Counts | Sigma | Mean | Median | Sigma |
| A | 0 | 118 | 10890 | 193.21 | 261 | 255 | 55.0 |
| A | 8 | 15 | 4972 | 85.7 | 261 | 255 | 55.0 |
| A | 0 | 226 | 3970 | 67.49 | 261 | 255 | 55.0 |
| B | 14 | 167 | 9120 | 168.18 | 265 | 258 | 52.7 |
| B | 5 | 255 | 8457 | 155.6 | 265 | 258 | 52.7 |
| B | 0 | 183 | 6210 | 112.95 | 265 | 258 | 52.7 |
| C | 9 | 144 | 268198 | 4475.33 | 253 | 255 | 59.9 |
| C | 5 | 190 | 13990 | 229.41 | 253 | 255 | 59.9 |
| C | 4 | 254 | 10716 | 174.73 | 253 | 255 | 59.9 |
| D | 13 | 239 | 12890 | 199.0 | 257 | 249 | 63.5 |
| D | 2 | 14 | 7810 | 119.03 | 257 | 249 | 63.5 |
| D | 10 | 34 | 7522 | 114.49 | 257 | 249 | 63.5 |
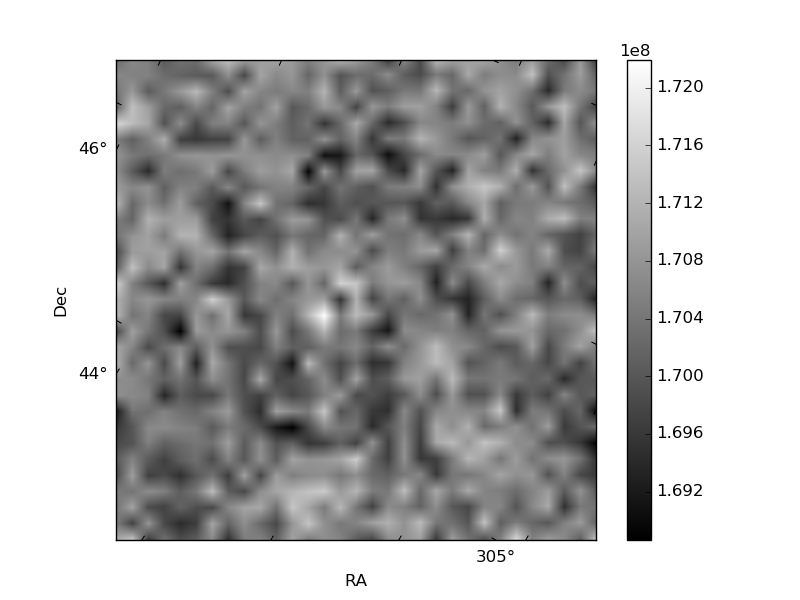
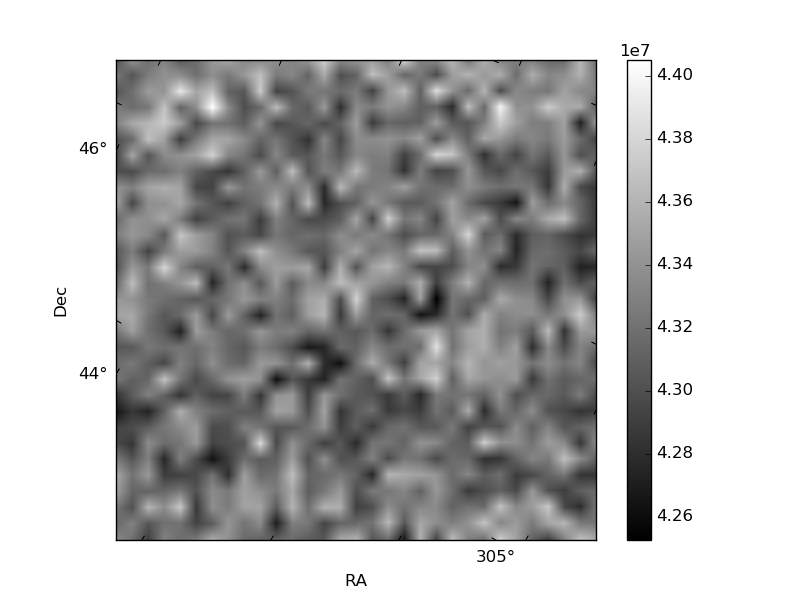
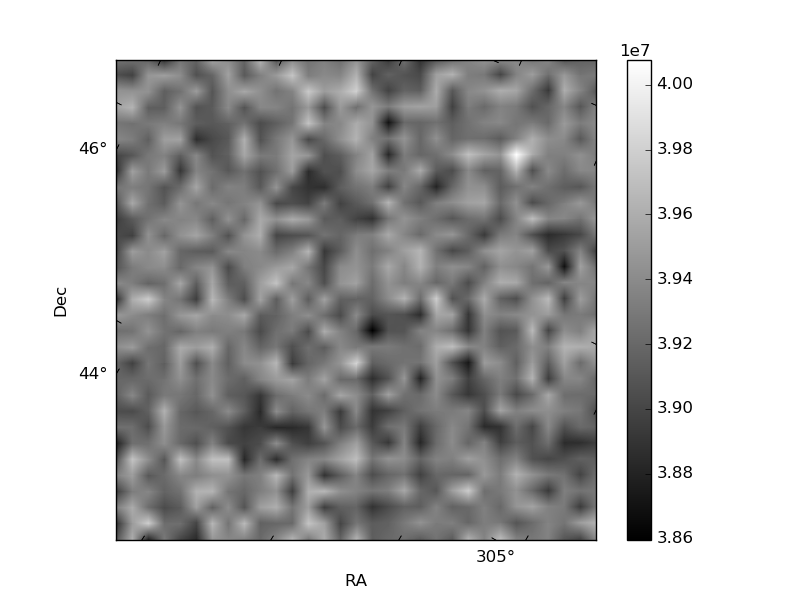
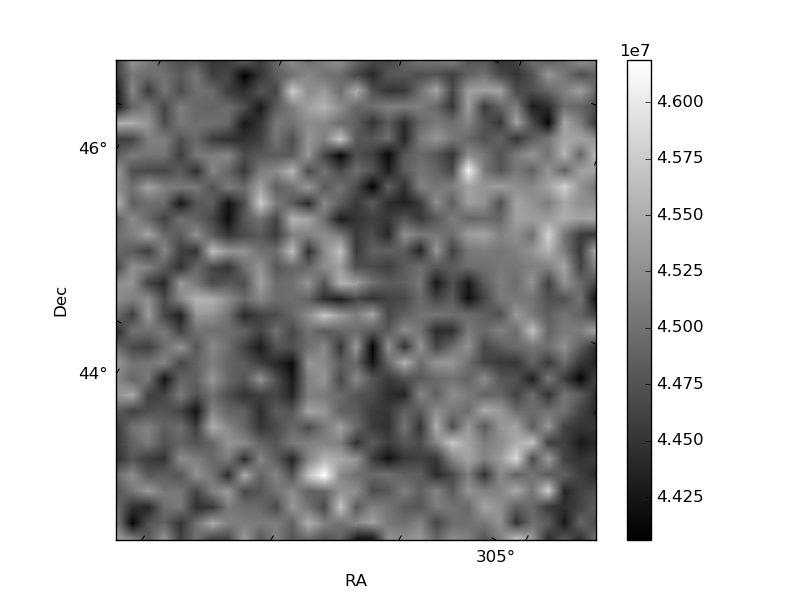
Histogram calculated using DETX and DETY for each event in the final _common_clean file
| Quadrant A | 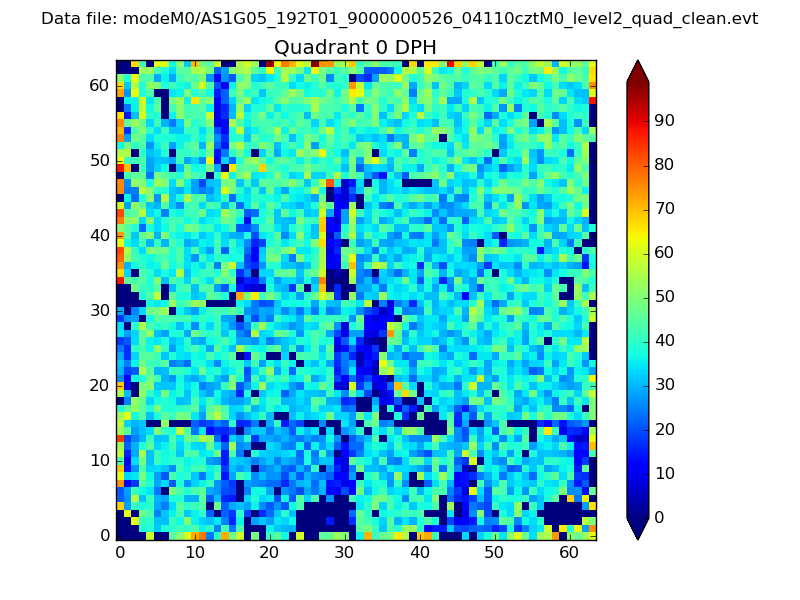 |
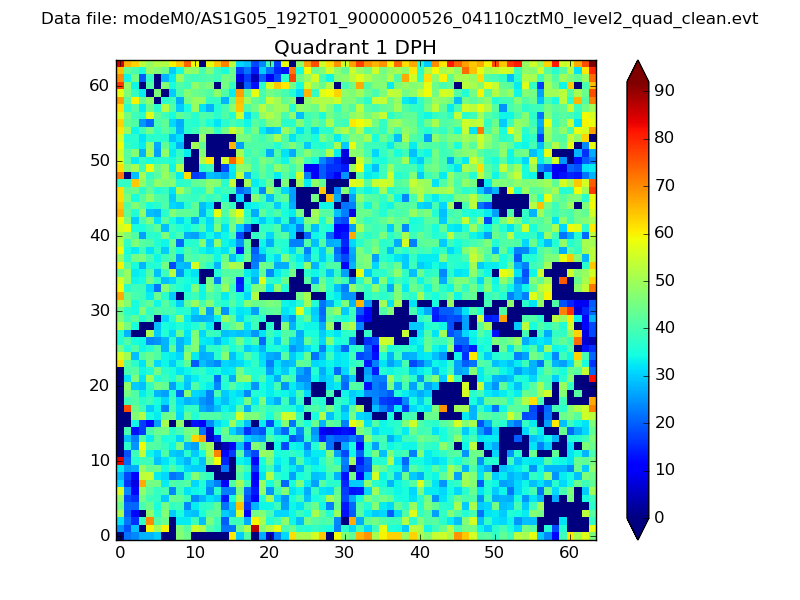 |
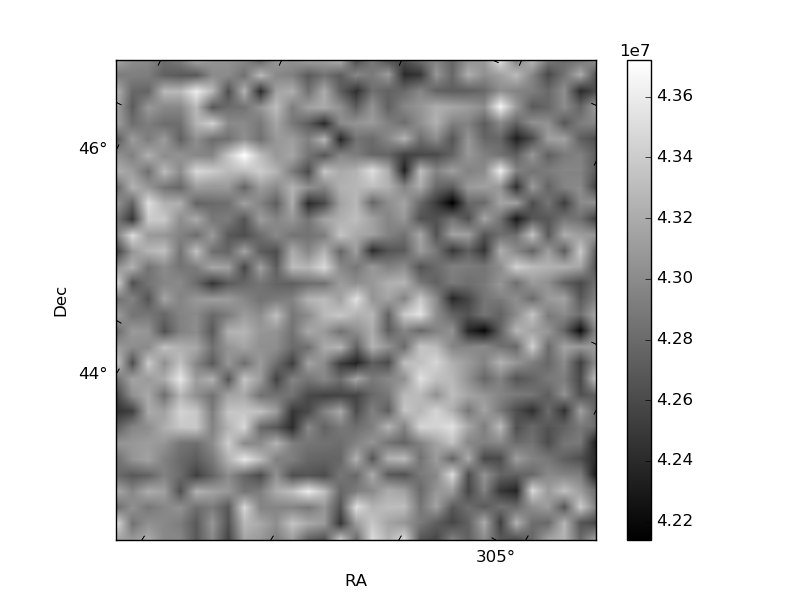
Quadrant B |
|---|---|---|---|
| Quadrant D | 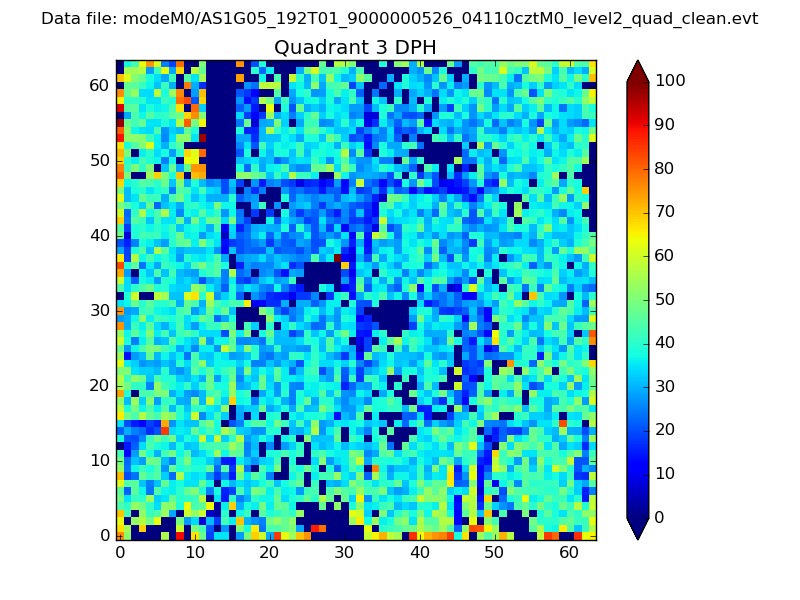 |
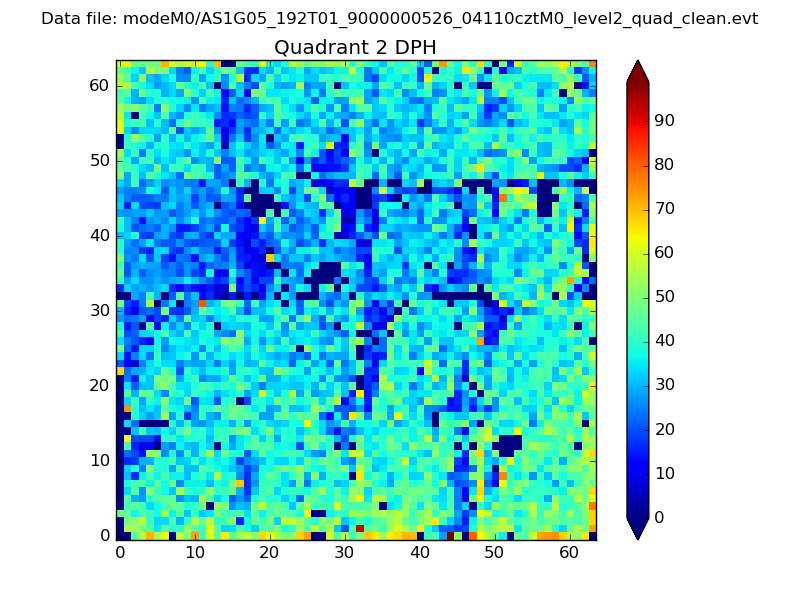 |
Quadrant C |
| Plot type | Count rate plots | Images |
|---|---|---|
| Comparison with Poisson distribution Blue bars denote a histogram of data divided into 1 sec bins. Red curve is a Poisson curve with rate = median count rate of data. |
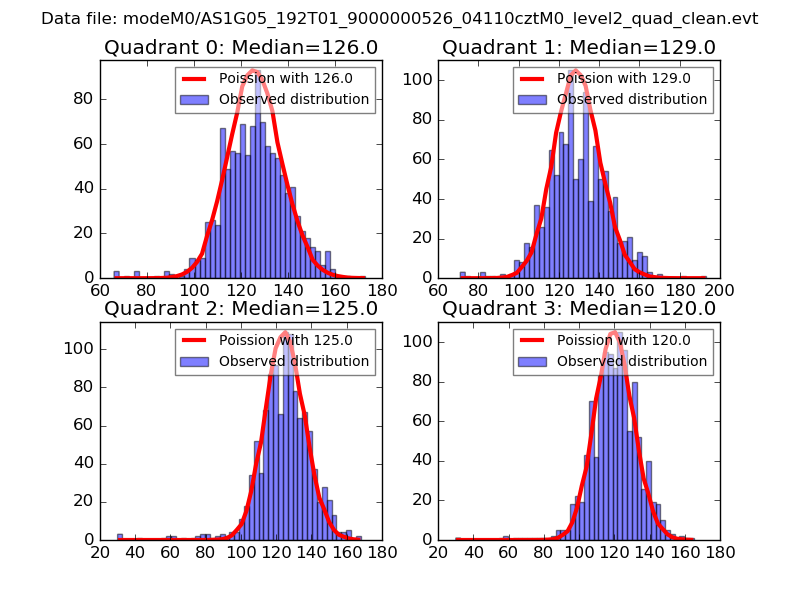 |
 |
| Quadrant-wise count rates Data is divided into 100 sec bins |
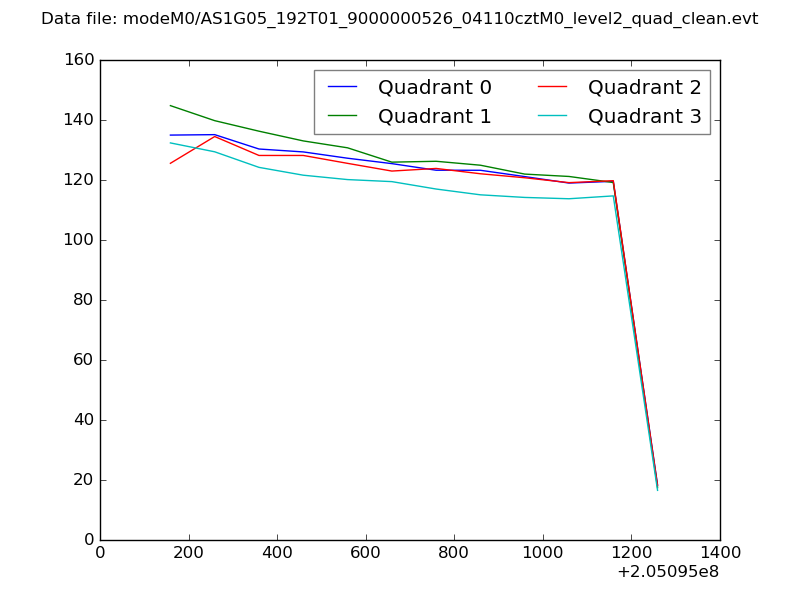 |
|
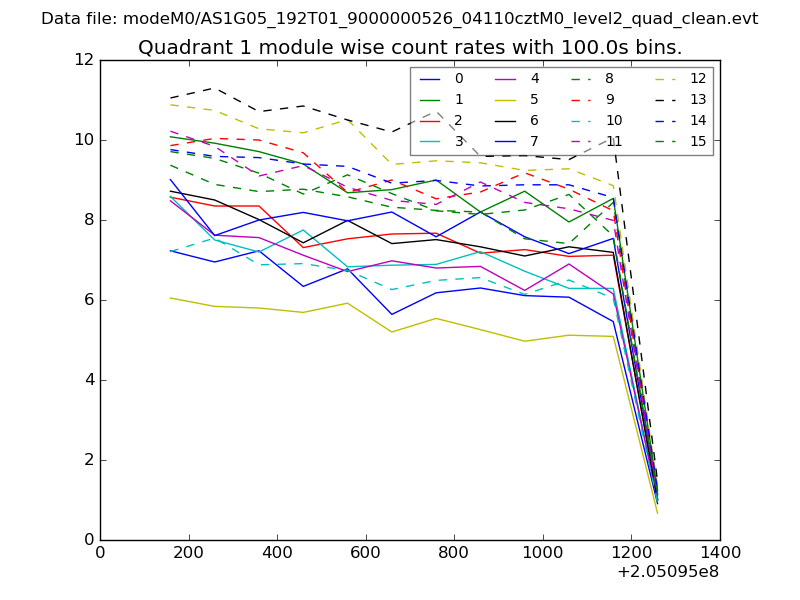
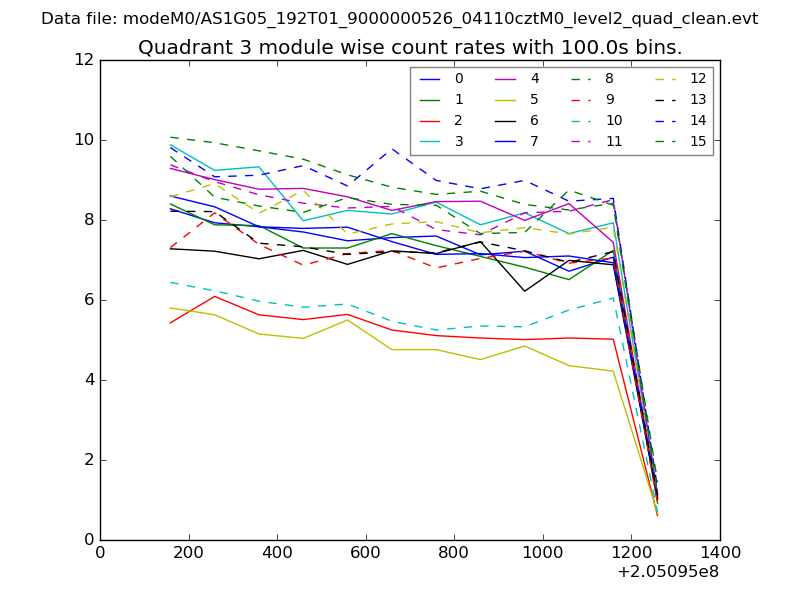
| Module-wise count rates for Quadrant A Data is divided into 100 sec bins |
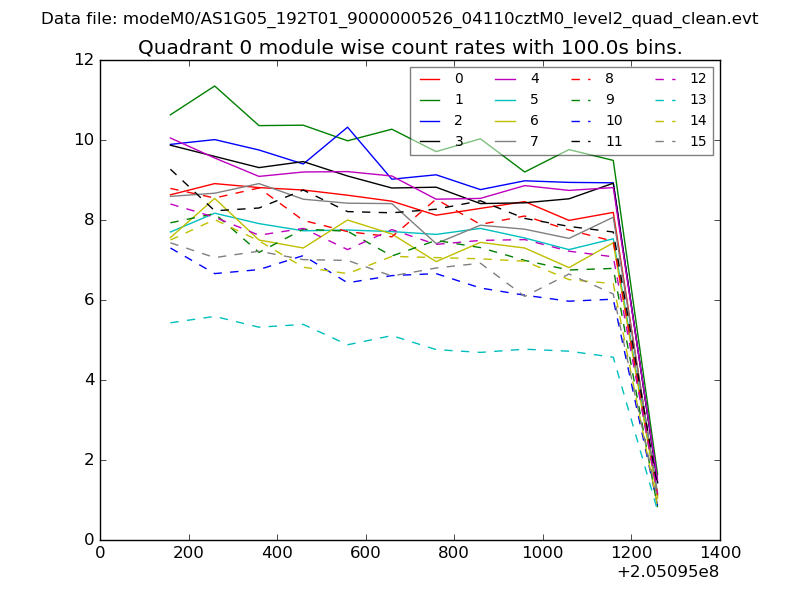 |
 |
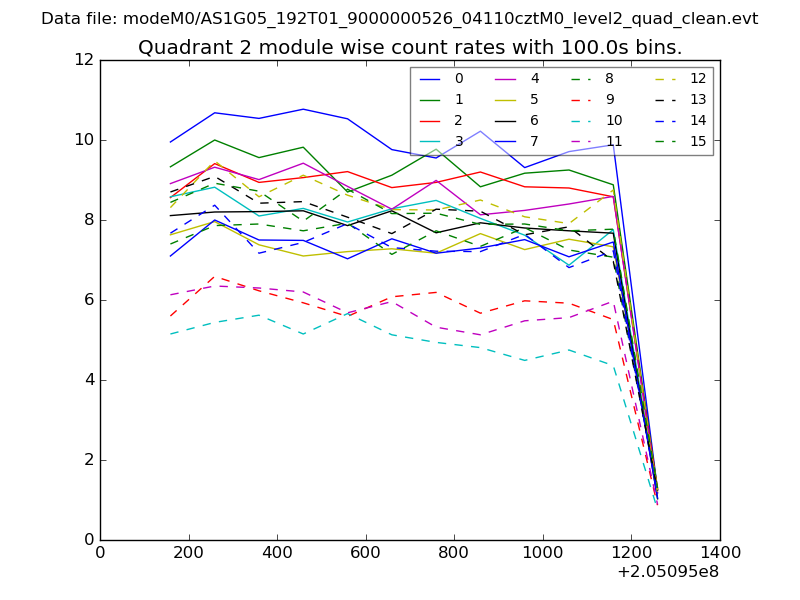
| Module-wise count rates for Quadrant B Data is divided into 100 sec bins |
 |
 |
| Module-wise count rates for Quadrant C Data is divided into 100 sec bins |
 |
 |
| Module-wise count rates for Quadrant D Data is divided into 100 sec bins |
 |
 |
| Parameter | Plot |
|---|---|
| CZT HV Monitor | 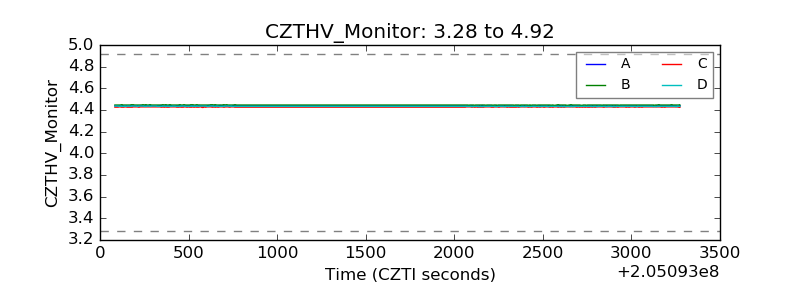 |
| D_VDD | 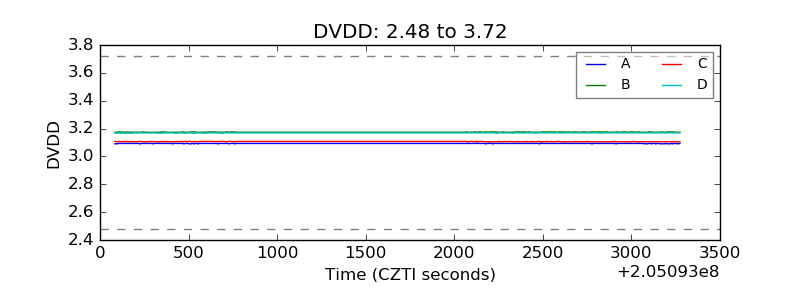 |
| Temperature 1 | 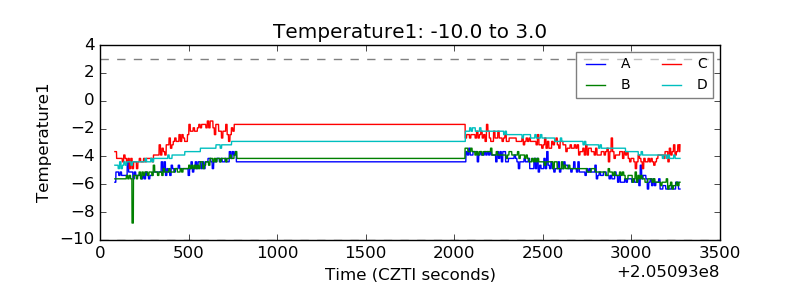 |
| Veto HV Monitor | 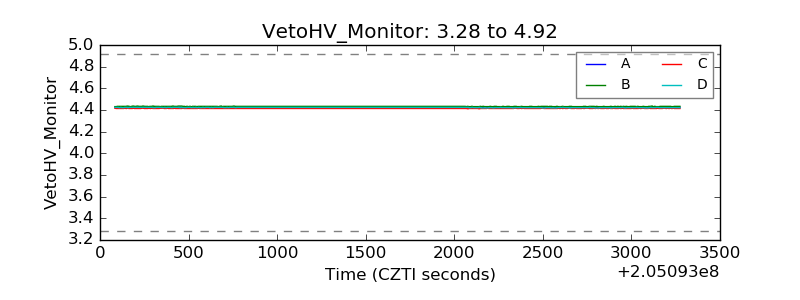 |
| Veto LLD | 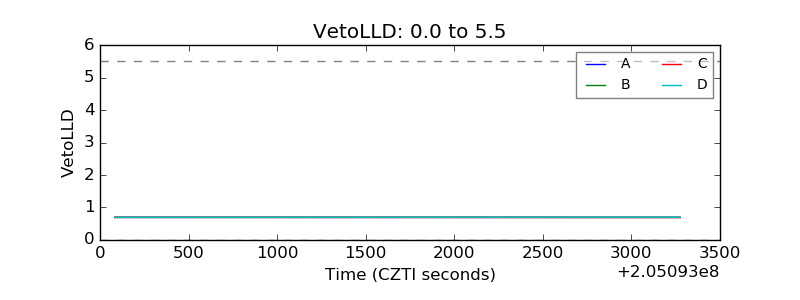 |
| Alpha Counter | 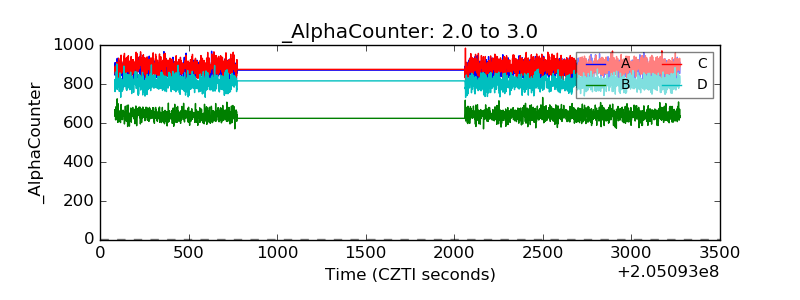 |
| _CPM_Rate | 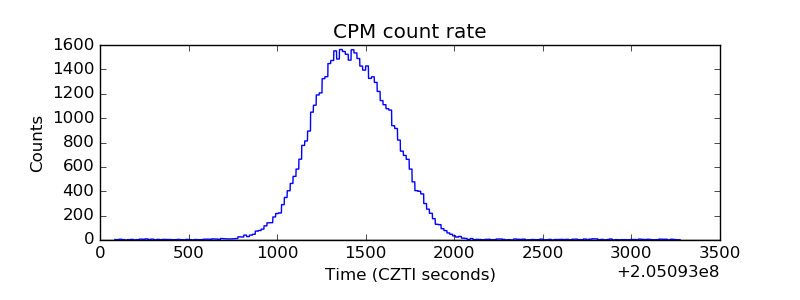 |
| CZT Counter | 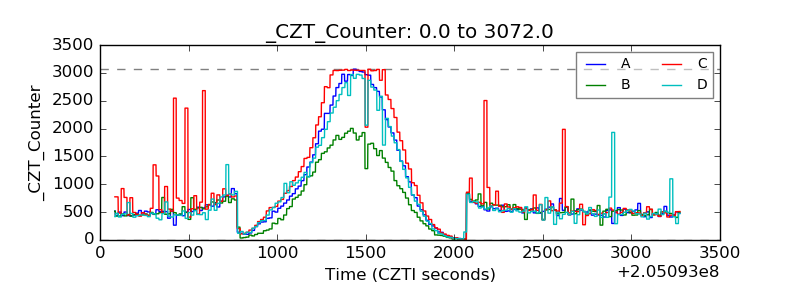 |
| +2.5 Volts monitor | 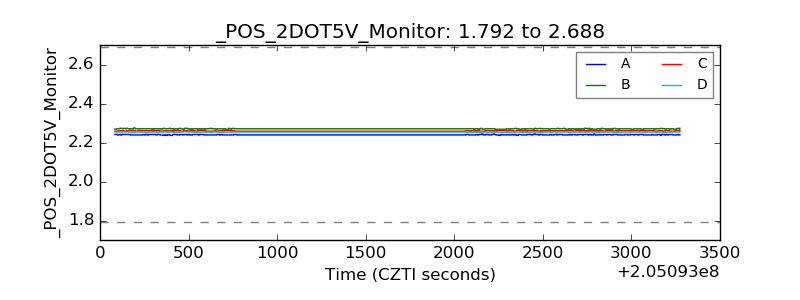 |
| +5 Volts monitor |  |
| _ROLL_ROT | 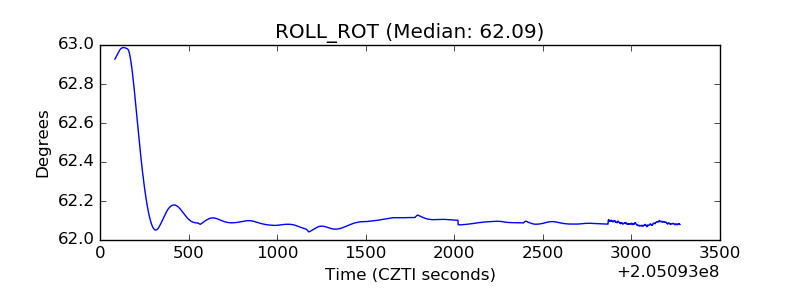 |
| _Roll_DEC | 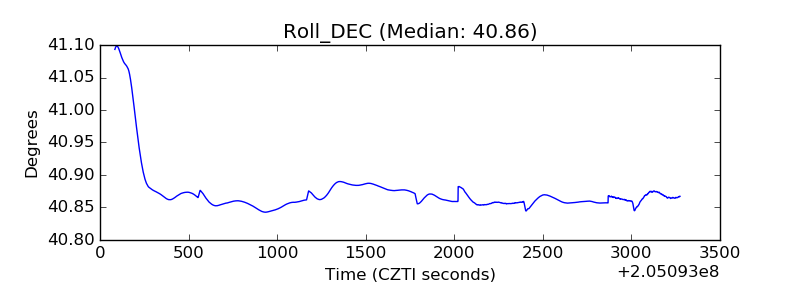 |
| _Roll_RA | 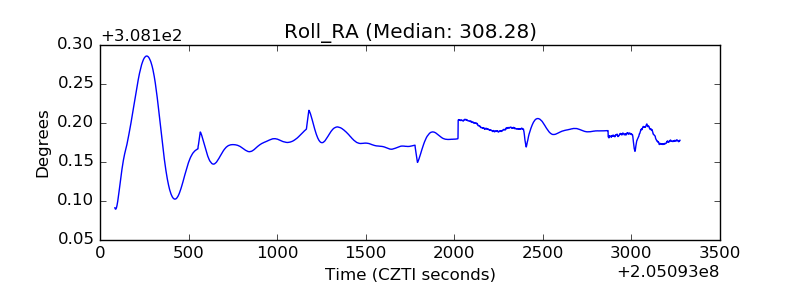 |
| Veto Counter | 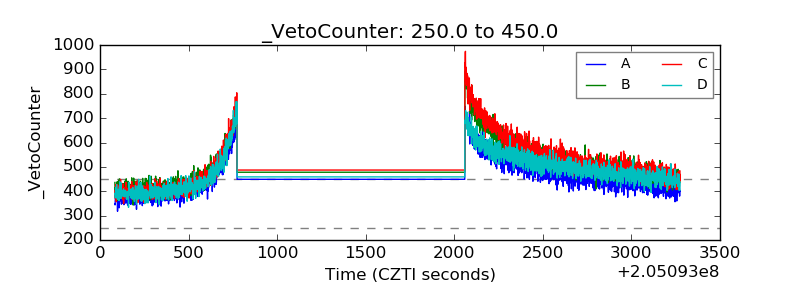 |