| Param | Original file | Final file |
|---|---|---|
| Filename | modeM0/AS1G05_192T01_9000000526_04111cztM0_level2.evt | modeM0/AS1G05_192T01_9000000526_04111cztM0_level2_quad_clean.evt |
| Size (bytes) | 492,278,400 | 91,287,360 |
| Size | 469.5 MB | 87.1 MB |
| Events in quadrant A | 3,712,141 | 579,099 |
| Events in quadrant B | 3,226,389 | 593,680 |
| Events in quadrant C | 4,420,063 | 573,189 |
| Events in quadrant D | 3,107,740 | 564,410 |
| Mode SS | |||
|---|---|---|---|
| Quadrant | BADHDUFLAG | Total packets | Discarded packets |
| A | 0 | 134 | 0 |
| B | 0 | 134 | 0 |
| C | 0 | 134 | 0 |
| D | 0 | 134 | 0 |
| Mode M9 | |||
|---|---|---|---|
| Quadrant | BADHDUFLAG | Total packets | Discarded packets |
| A | 0 | 26 | 0 |
| B | 0 | 26 | 0 |
| C | 0 | 26 | 0 |
| D | 0 | 26 | 0 |
| Mode M0 | |||
|---|---|---|---|
| Quadrant | BADHDUFLAG | Total packets | Discarded packets |
| A | 0 | 15443 | 3 |
| B | 0 | 13924 | 2 |
| C | 0 | 17580 | 2 |
| D | 0 | 13846 | 2 |
| Quadrant | Total seconds | Saturated seconds | Saturation percentage |
|---|---|---|---|
| A | 6510 | 150 | 2.304147% |
| B | 6510 | 119 | 1.827957% |
| C | 6510 | 553 | 8.494624% |
| D | 6510 | 95 | 1.459293% |
Noise dominated data is calculated using 1-second bins in cleaned event files. If a bin has >2000 counts, and if more than 50% of those come from <1% of pixels, then it is considered to be noise-dominated and hence unusable.
| Quadrant | # 1 sec bins | Bins with >0 counts | Bins with >2000 counts | High rate bins dominated by noise | Noise dominated (total time) | Noise dominated (detector-on time) | Marked lightcurve |
|---|---|---|---|---|---|---|---|
| A | 9095 | 6510 | 39 | 39 | 0.43% | 0.60% | 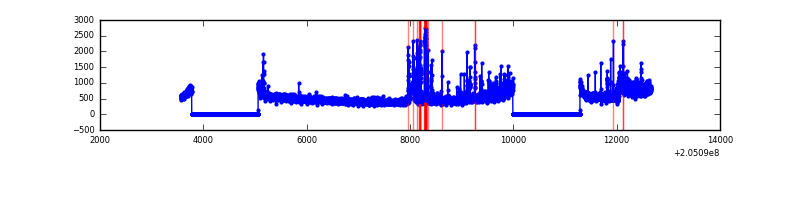 |
| B | 9095 | 6510 | 0 | 0 | 0.00% | 0.00% |  |
| C | 9095 | 6511 | 280 | 280 | 3.08% | 4.30% | 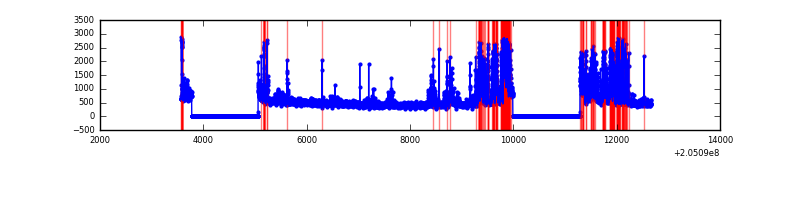 |
| D | 9095 | 6511 | 10 | 10 | 0.11% | 0.15% | 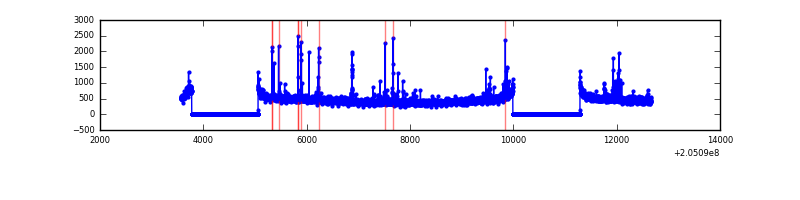 |
Top three noisy pixels from each quadrant. If the there are fewer than three noisy pixels in the level2.evt file, extra rows are filled as -1
| Pixel properties | Quadrant properties | ||||||
|---|---|---|---|---|---|---|---|
| Quadrant | DetID | PixID | Counts | Sigma | Mean | Median | Sigma |
| A | 0 | 199 | 404877 | 2511.33 | 790 | 773 | 160.9 |
| A | 14 | 111 | 201644 | 1248.33 | 790 | 773 | 160.9 |
| A | 0 | 226 | 43451 | 265.23 | 790 | 773 | 160.9 |
| B | 15 | 204 | 43765 | 279.42 | 809 | 790 | 153.8 |
| B | 14 | 167 | 32352 | 205.21 | 809 | 790 | 153.8 |
| B | 0 | 183 | 15668 | 96.74 | 809 | 790 | 153.8 |
| C | 9 | 144 | 1385202 | 7896.02 | 758 | 763 | 175.3 |
| C | 5 | 190 | 28547 | 158.46 | 758 | 763 | 175.3 |
| C | 4 | 254 | 28227 | 156.64 | 758 | 763 | 175.3 |
| D | 13 | 239 | 76270 | 403.5 | 778 | 755 | 187.1 |
| D | 2 | 14 | 24352 | 126.09 | 778 | 755 | 187.1 |
| D | 13 | 46 | 21389 | 110.25 | 778 | 755 | 187.1 |
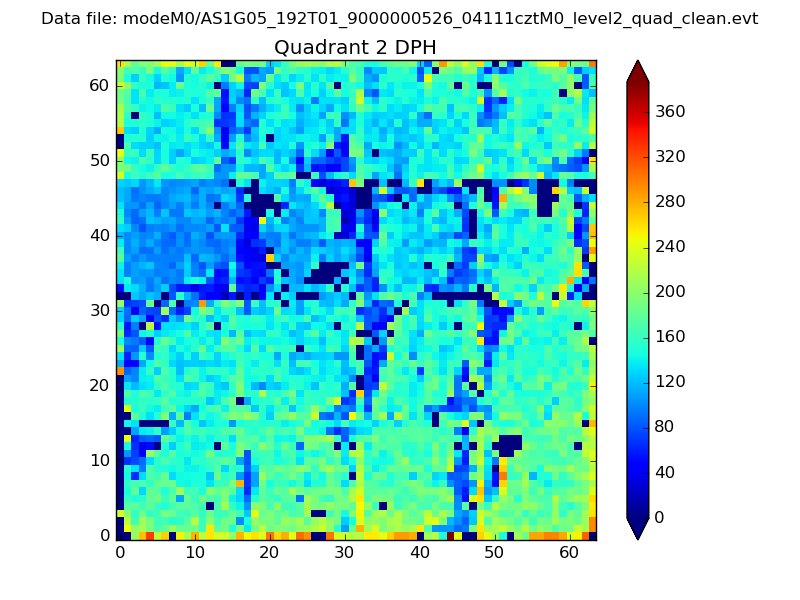
Histogram calculated using DETX and DETY for each event in the final _common_clean file
| Quadrant A | 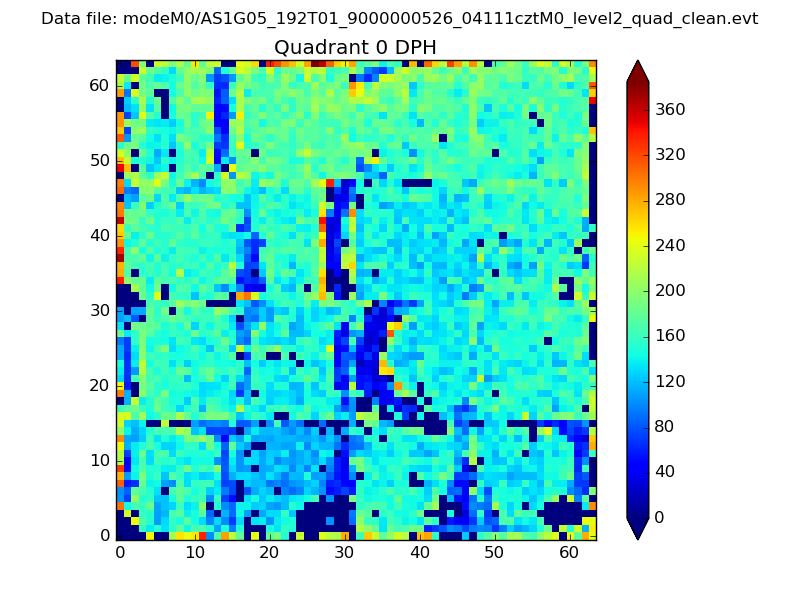 |
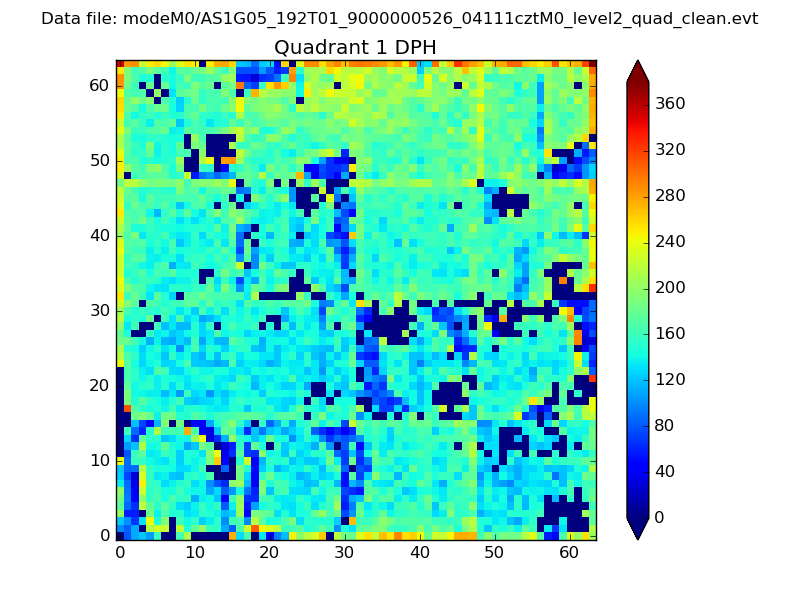 |
Quadrant B |
|---|---|---|---|
| Quadrant D | 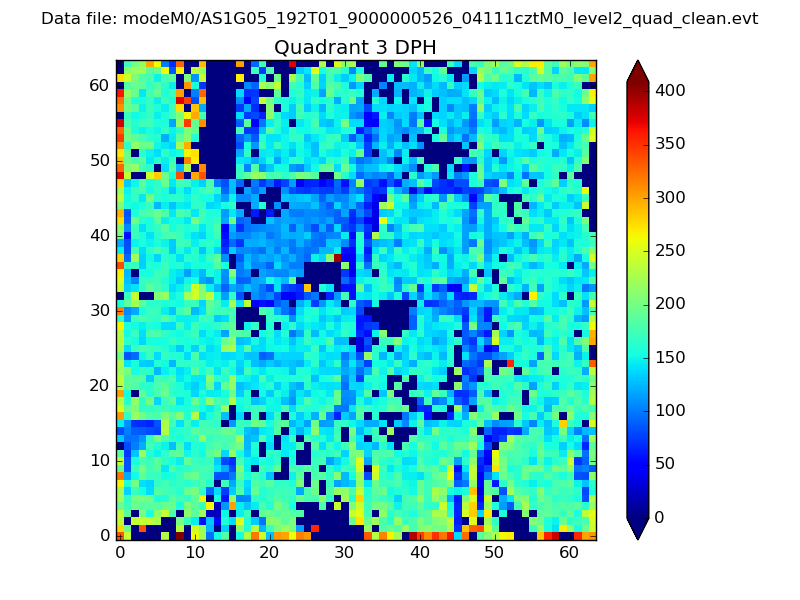 |
 |
Quadrant C |
| Plot type | Count rate plots | Images |
|---|---|---|
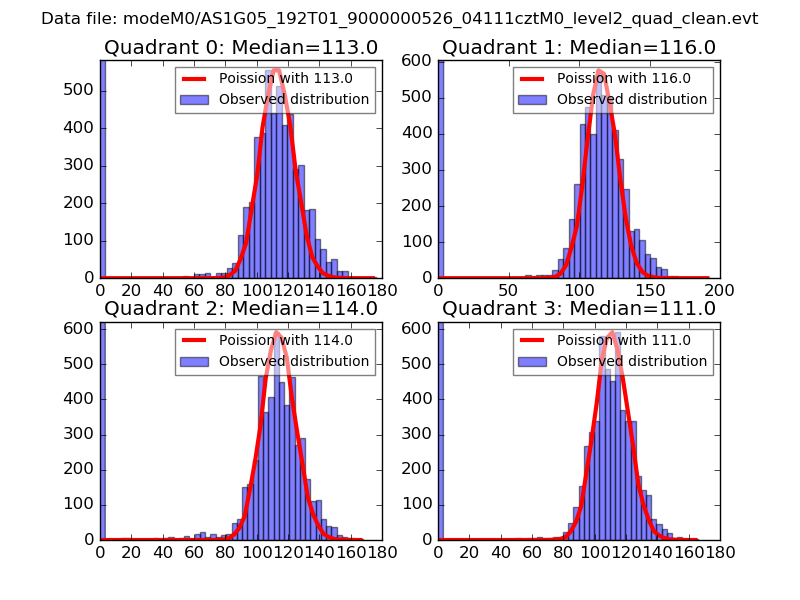
| Comparison with Poisson distribution Blue bars denote a histogram of data divided into 1 sec bins. Red curve is a Poisson curve with rate = median count rate of data. |
 |
 |
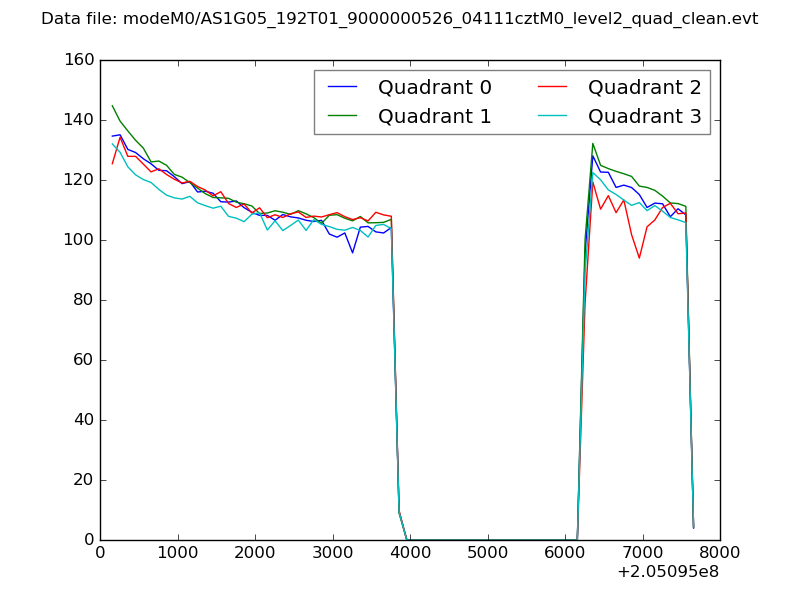
| Quadrant-wise count rates Data is divided into 100 sec bins |
 |
|
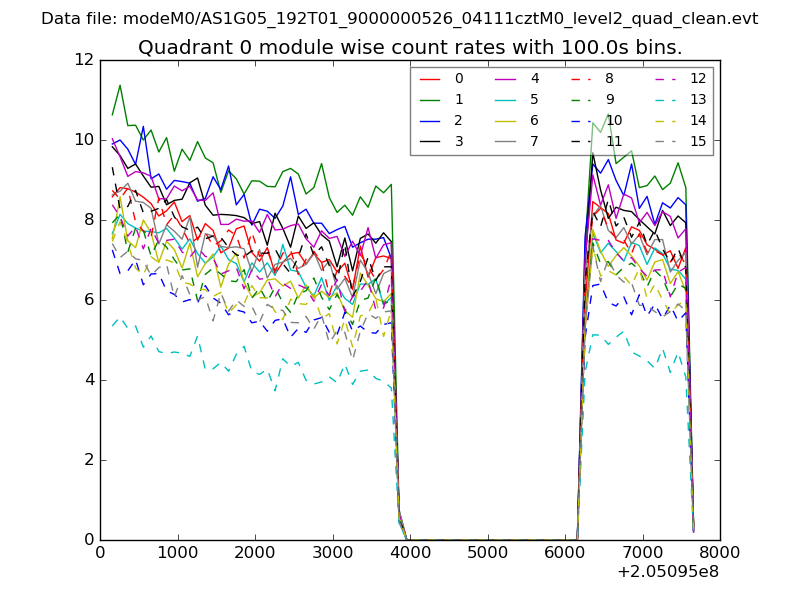
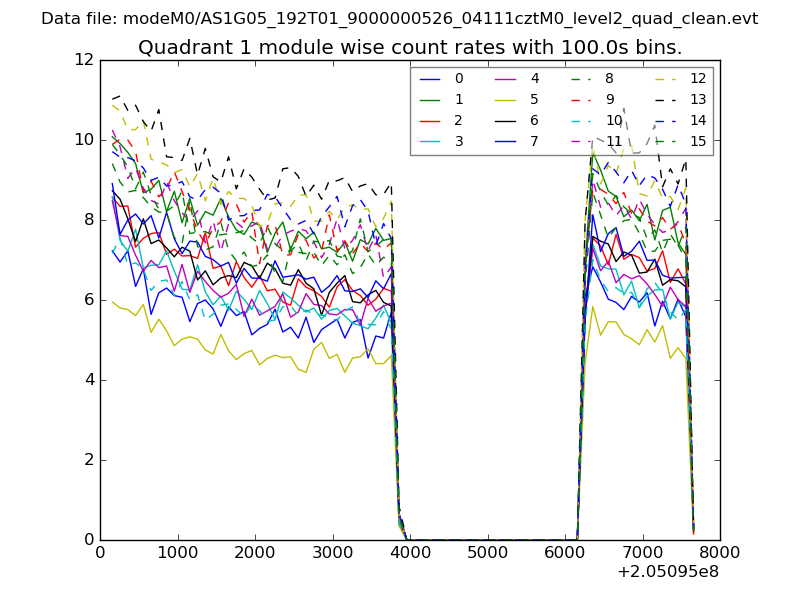
| Module-wise count rates for Quadrant A Data is divided into 100 sec bins |
 |
 |
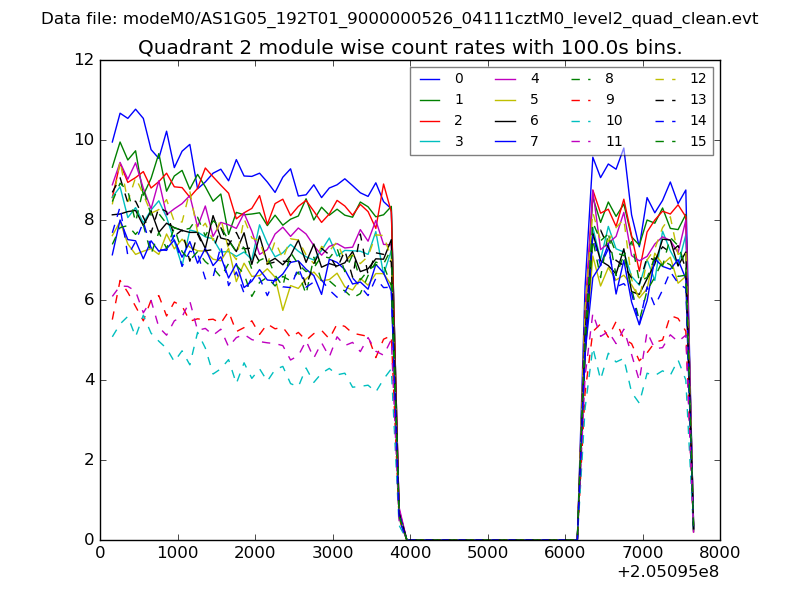
| Module-wise count rates for Quadrant B Data is divided into 100 sec bins |
 |
 |
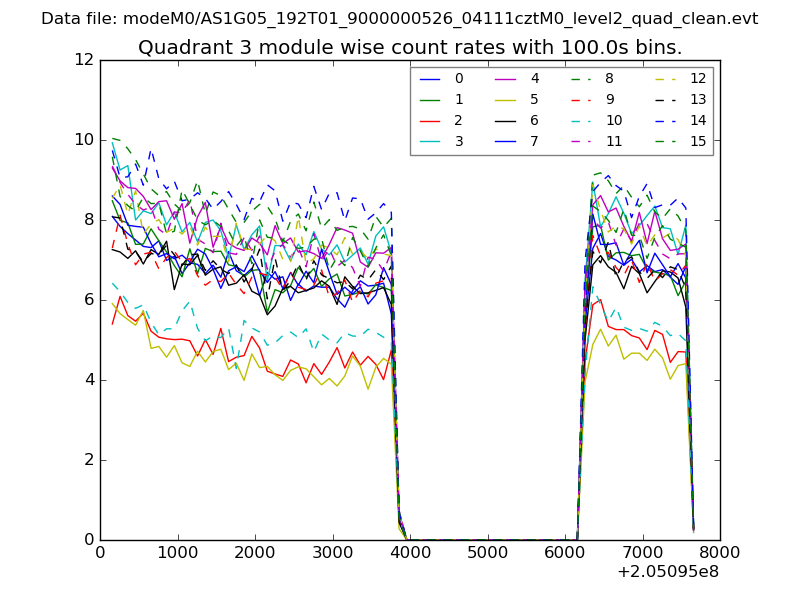
| Module-wise count rates for Quadrant C Data is divided into 100 sec bins |
 |
 |
| Module-wise count rates for Quadrant D Data is divided into 100 sec bins |
 |
 |
| Parameter | Plot |
|---|---|
| CZT HV Monitor | 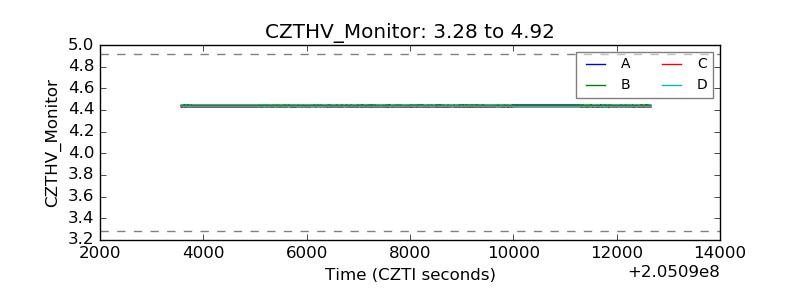 |
| D_VDD | 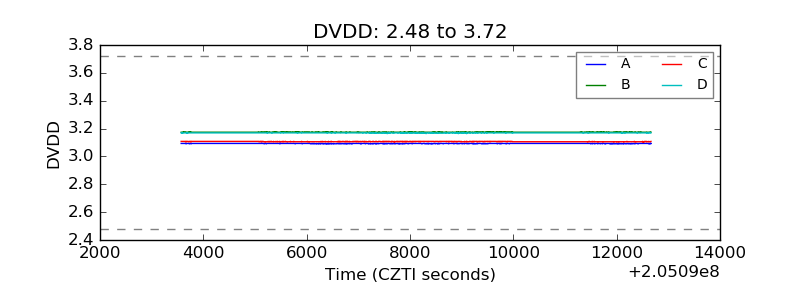 |
| Temperature 1 | 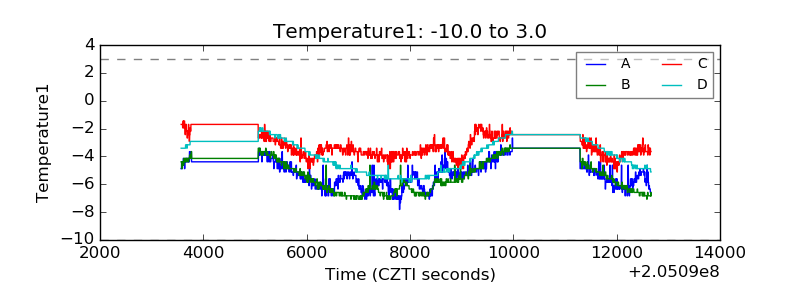 |
| Veto HV Monitor | 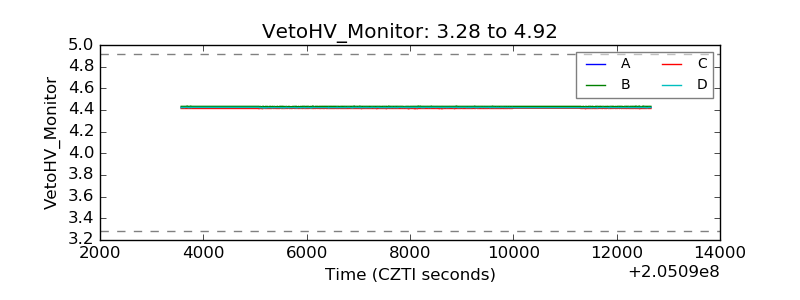 |
| Veto LLD | 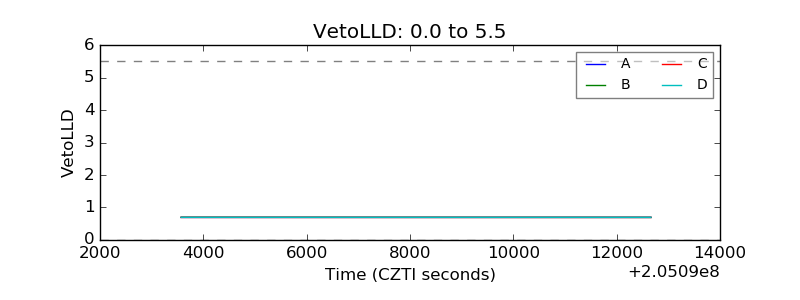 |
| Alpha Counter | 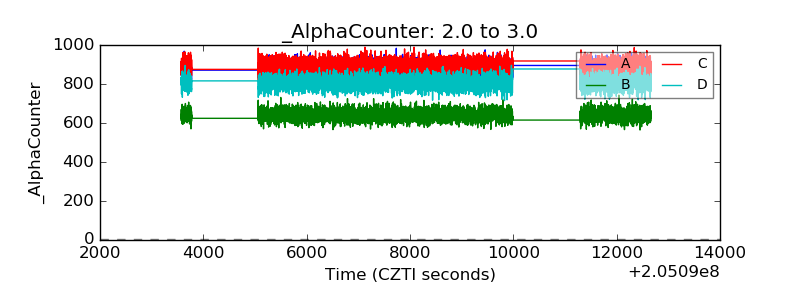 |
| _CPM_Rate | 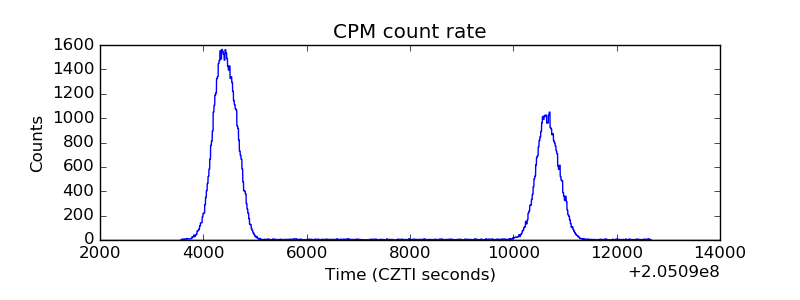 |
| CZT Counter | 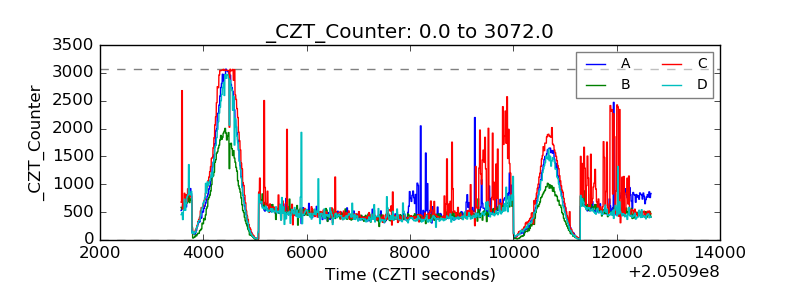 |
| +2.5 Volts monitor |  |
| +5 Volts monitor |  |
| _ROLL_ROT | 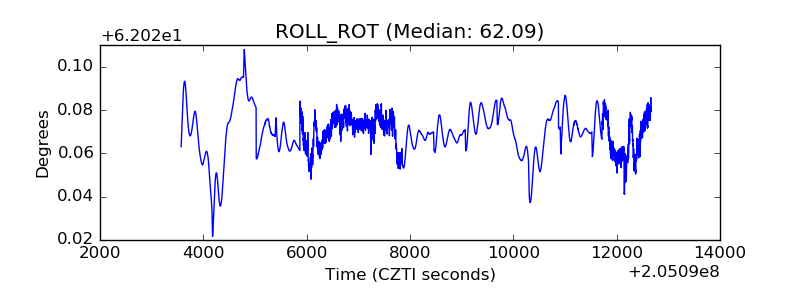 |
| _Roll_DEC | 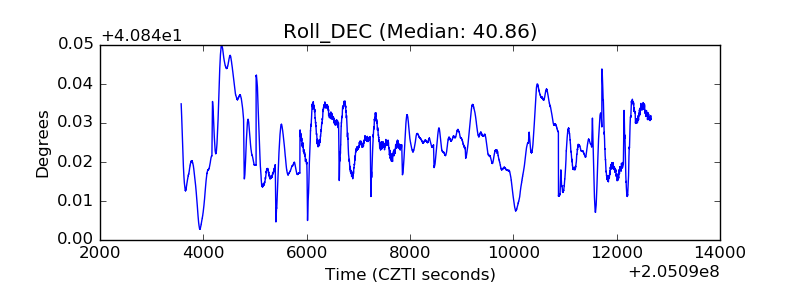 |
| _Roll_RA | 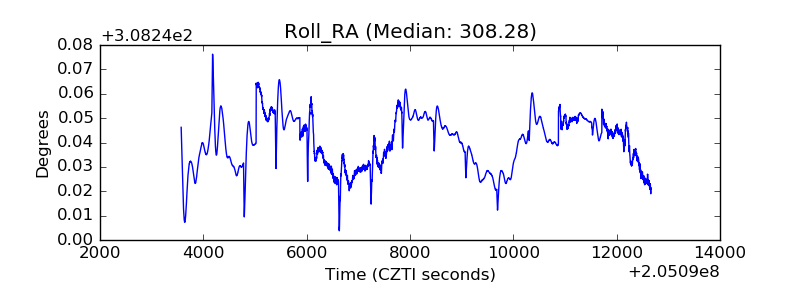 |
| Veto Counter | 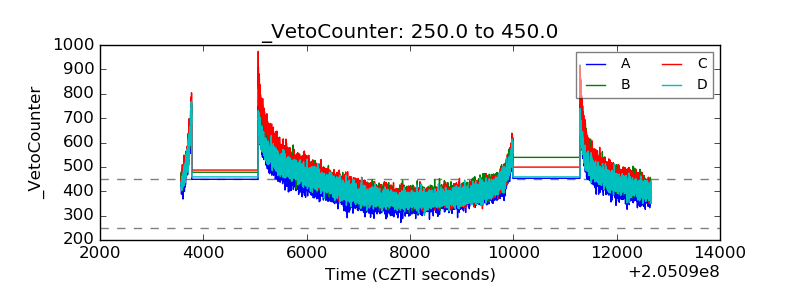 |