| Param | Original file | Final file |
|---|---|---|
| Filename | modeM0/AS1G05_192T01_9000000526_04114cztM0_level2.evt | modeM0/AS1G05_192T01_9000000526_04114cztM0_level2_quad_clean.evt |
| Size (bytes) | 396,737,280 | 72,734,400 |
| Size | 378.4 MB | 69.4 MB |
| Events in quadrant A | 2,882,503 | 442,042 |
| Events in quadrant B | 3,061,104 | 442,719 |
| Events in quadrant C | 2,809,915 | 440,255 |
| Events in quadrant D | 2,824,111 | 428,966 |
| Mode SS | |||
|---|---|---|---|
| Quadrant | BADHDUFLAG | Total packets | Discarded packets |
| A | 0 | 132 | 0 |
| B | 0 | 132 | 0 |
| C | 0 | 132 | 0 |
| D | 0 | 132 | 0 |
| Mode M9 | |||
|---|---|---|---|
| Quadrant | BADHDUFLAG | Total packets | Discarded packets |
| A | 0 | 8 | 0 |
| B | 0 | 8 | 0 |
| C | 0 | 8 | 0 |
| D | 0 | 8 | 0 |
| Mode M0 | |||
|---|---|---|---|
| Quadrant | BADHDUFLAG | Total packets | Discarded packets |
| A | 0 | 13338 | 1 |
| B | 0 | 13748 | 1 |
| C | 0 | 13238 | 1 |
| D | 0 | 13530 | 1 |
| Quadrant | Total seconds | Saturated seconds | Saturation percentage |
|---|---|---|---|
| A | 6421 | 27 | 0.420495% |
| B | 6421 | 39 | 0.607382% |
| C | 6421 | 40 | 0.622956% |
| D | 6421 | 35 | 0.545086% |
Noise dominated data is calculated using 1-second bins in cleaned event files. If a bin has >2000 counts, and if more than 50% of those come from <1% of pixels, then it is considered to be noise-dominated and hence unusable.
| Quadrant | # 1 sec bins | Bins with >0 counts | Bins with >2000 counts | High rate bins dominated by noise | Noise dominated (total time) | Noise dominated (detector-on time) | Marked lightcurve |
|---|---|---|---|---|---|---|---|
| A | 7255 | 6421 | 2 | 2 | 0.03% | 0.03% | 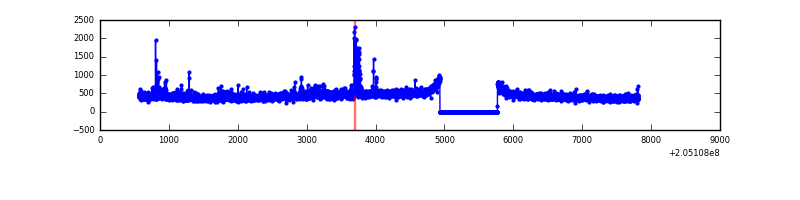 |
| B | 7255 | 6420 | 4 | 4 | 0.06% | 0.06% | 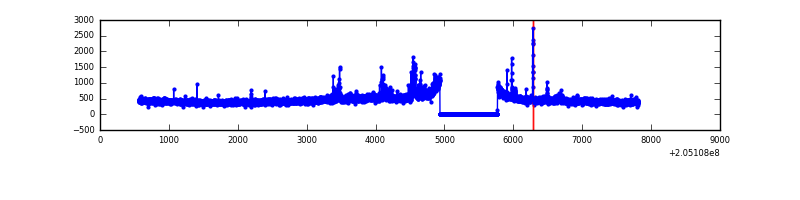 |
| C | 7256 | 6421 | 12 | 12 | 0.17% | 0.19% | 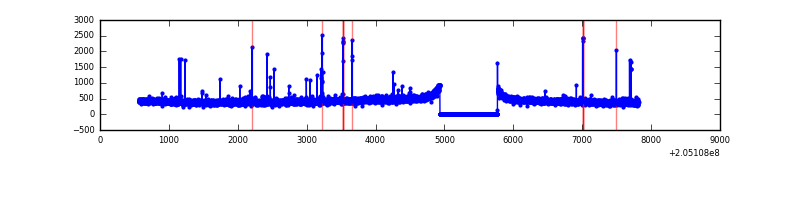 |
| D | 7255 | 6421 | 27 | 27 | 0.37% | 0.42% | 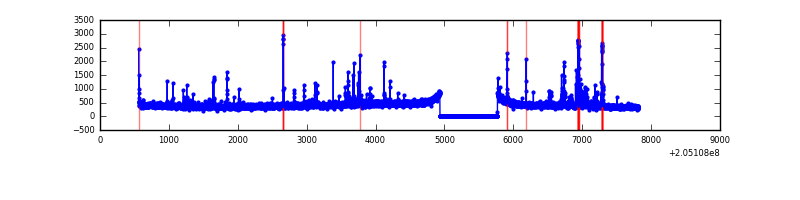 |
Top three noisy pixels from each quadrant. If the there are fewer than three noisy pixels in the level2.evt file, extra rows are filled as -1
| Pixel properties | Quadrant properties | ||||||
|---|---|---|---|---|---|---|---|
| Quadrant | DetID | PixID | Counts | Sigma | Mean | Median | Sigma |
| A | 0 | 50 | 69675 | 475.57 | 710 | 694 | 145.0 |
| A | 0 | 199 | 63699 | 434.37 | 710 | 694 | 145.0 |
| A | 0 | 226 | 12612 | 82.16 | 710 | 694 | 145.0 |
| B | 14 | 167 | 143449 | 1020.65 | 723 | 706 | 139.9 |
| B | 15 | 204 | 80085 | 567.58 | 723 | 706 | 139.9 |
| B | 0 | 183 | 14862 | 101.22 | 723 | 706 | 139.9 |
| C | 9 | 144 | 57632 | 349.17 | 694 | 697 | 163.1 |
| C | 4 | 254 | 18259 | 107.7 | 694 | 697 | 163.1 |
| C | 10 | 65 | 17822 | 105.02 | 694 | 697 | 163.1 |
| D | 10 | 172 | 137675 | 823.17 | 686 | 665 | 166.4 |
| D | 13 | 239 | 34873 | 205.52 | 686 | 665 | 166.4 |
| D | 2 | 14 | 31379 | 184.53 | 686 | 665 | 166.4 |
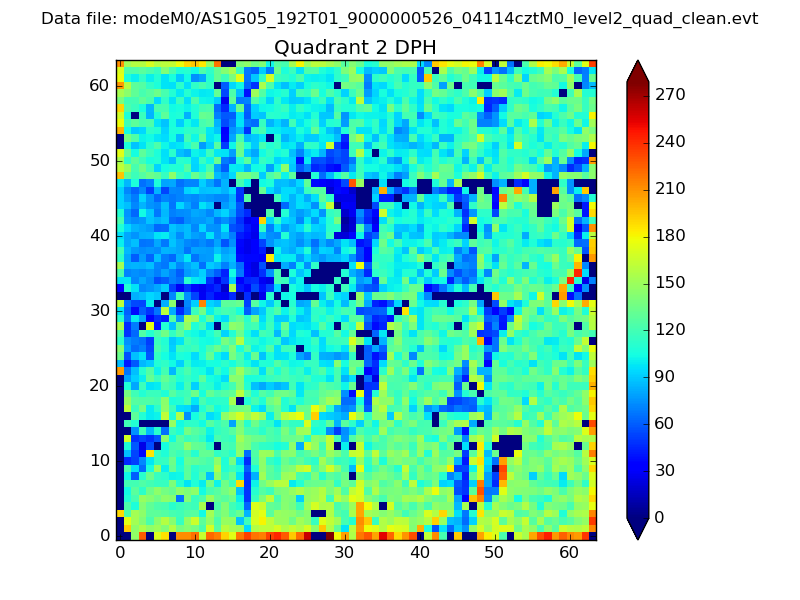
Histogram calculated using DETX and DETY for each event in the final _common_clean file
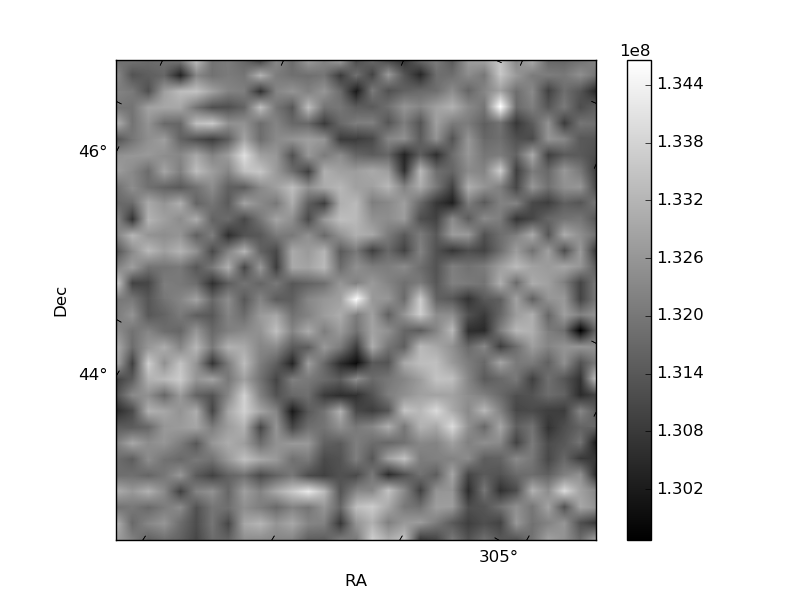
| Quadrant A | 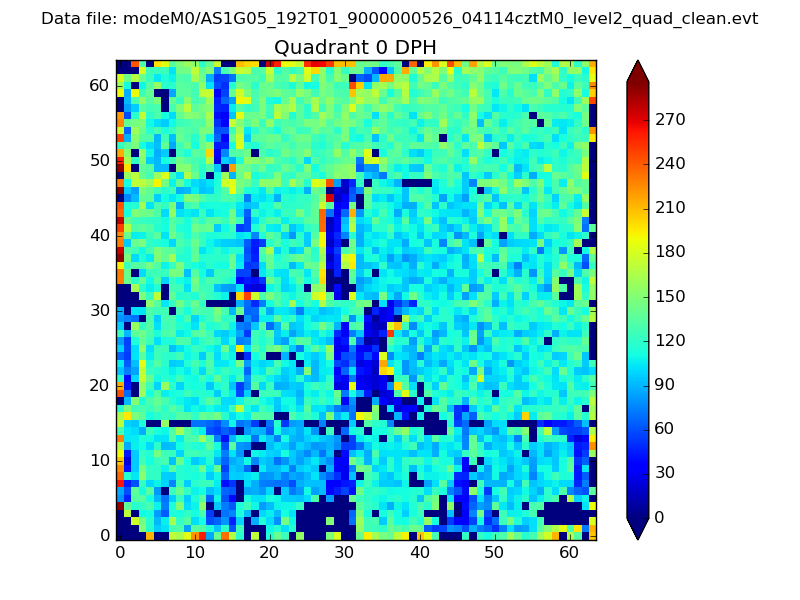 |
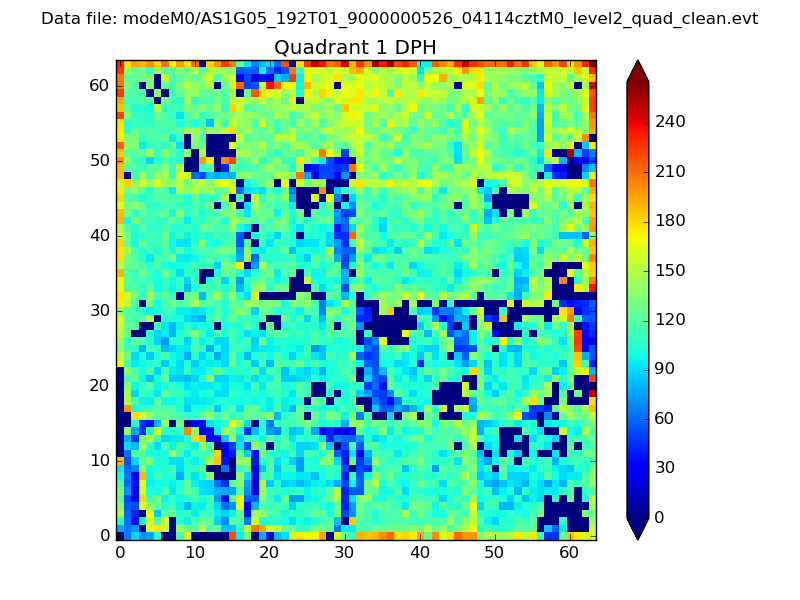 |
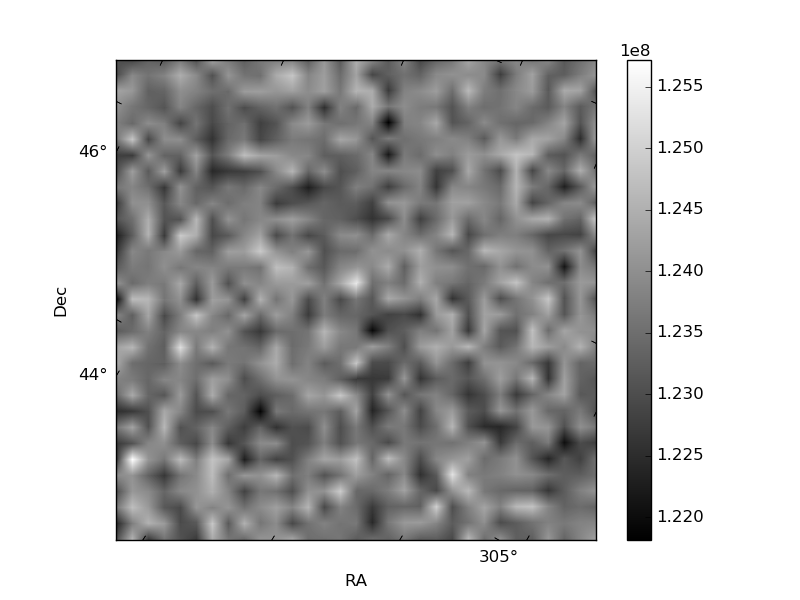
Quadrant B |
|---|---|---|---|
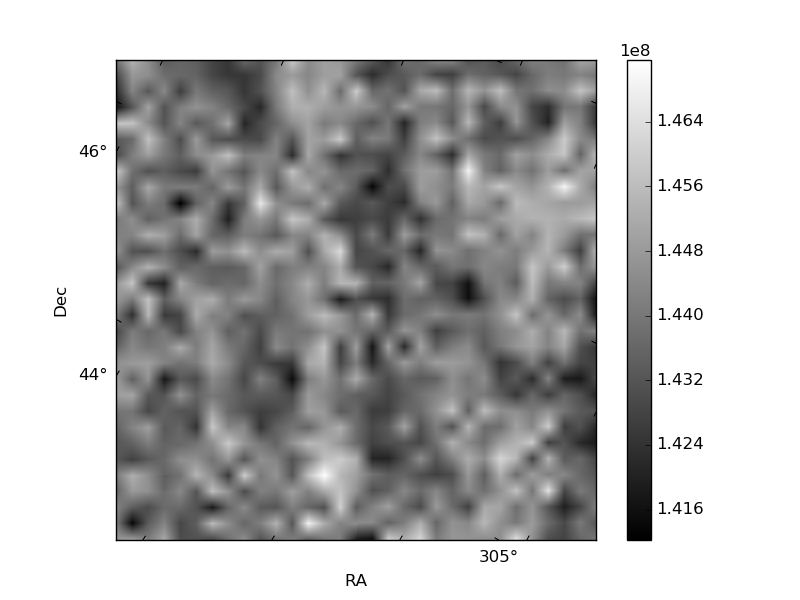
| Quadrant D | 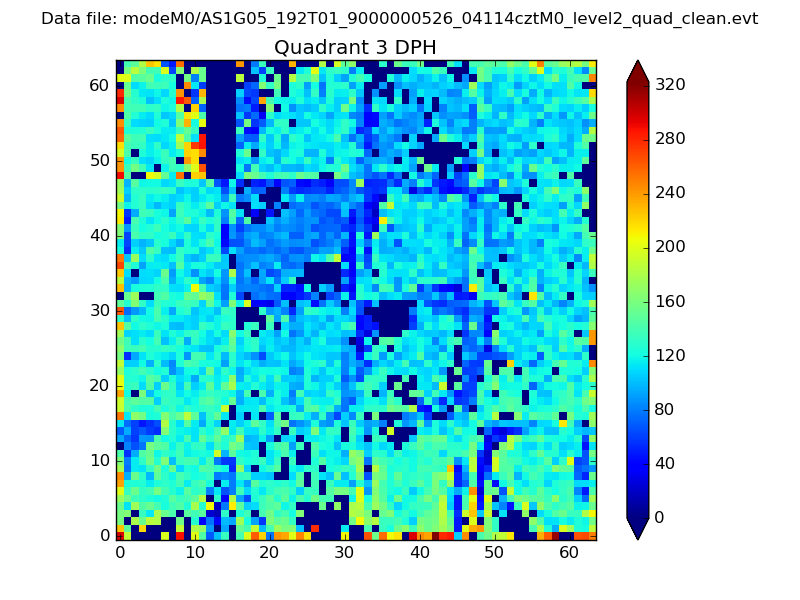 |
 |
Quadrant C |
| Plot type | Count rate plots | Images |
|---|---|---|
| Comparison with Poisson distribution Blue bars denote a histogram of data divided into 1 sec bins. Red curve is a Poisson curve with rate = median count rate of data. |
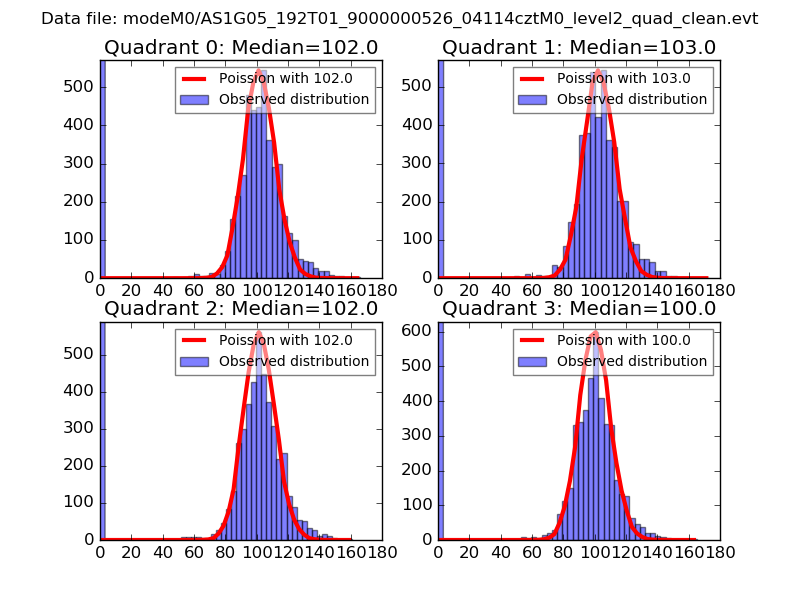 |
 |
| Quadrant-wise count rates Data is divided into 100 sec bins |
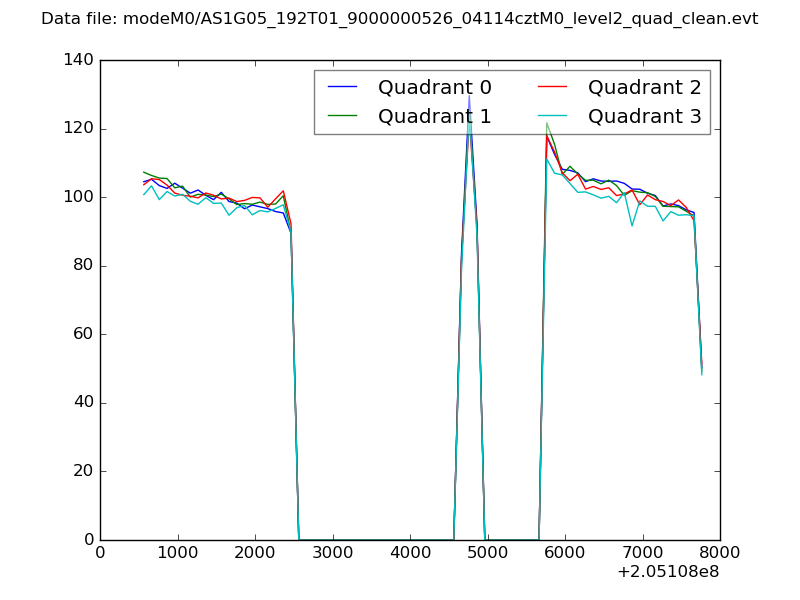 |
|
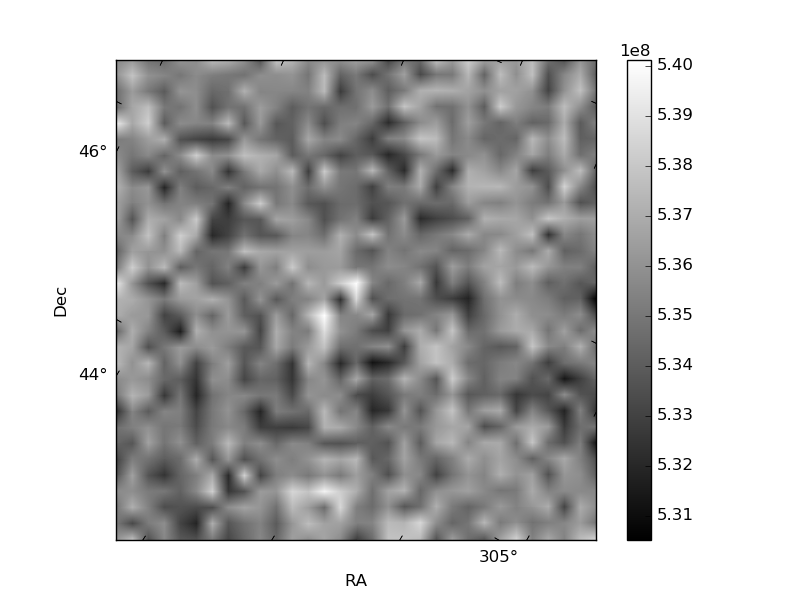
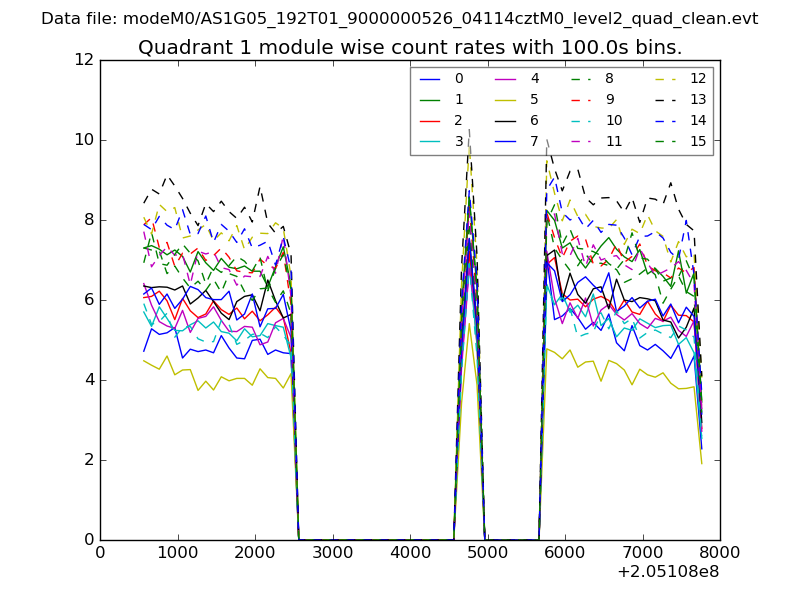
| Module-wise count rates for Quadrant A Data is divided into 100 sec bins |
 |
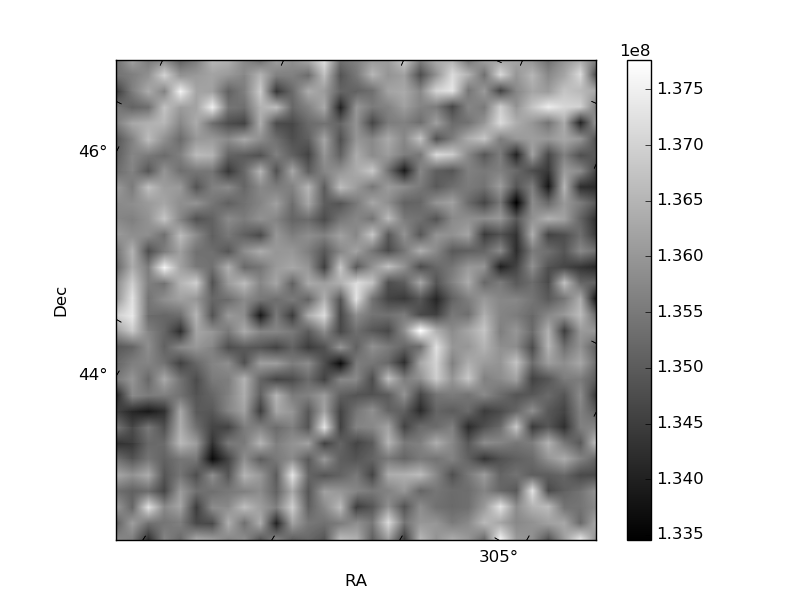 |
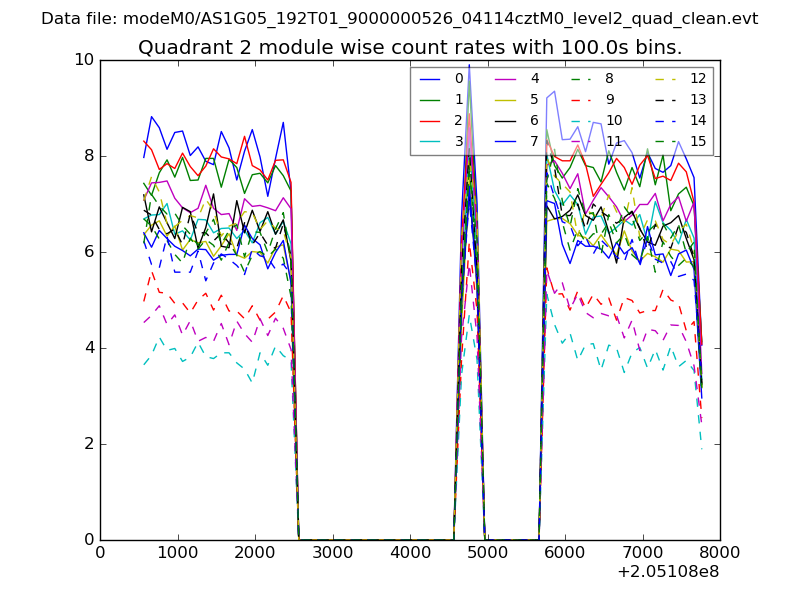
| Module-wise count rates for Quadrant B Data is divided into 100 sec bins |
 |
 |
| Module-wise count rates for Quadrant C Data is divided into 100 sec bins |
 |
 |
| Module-wise count rates for Quadrant D Data is divided into 100 sec bins |
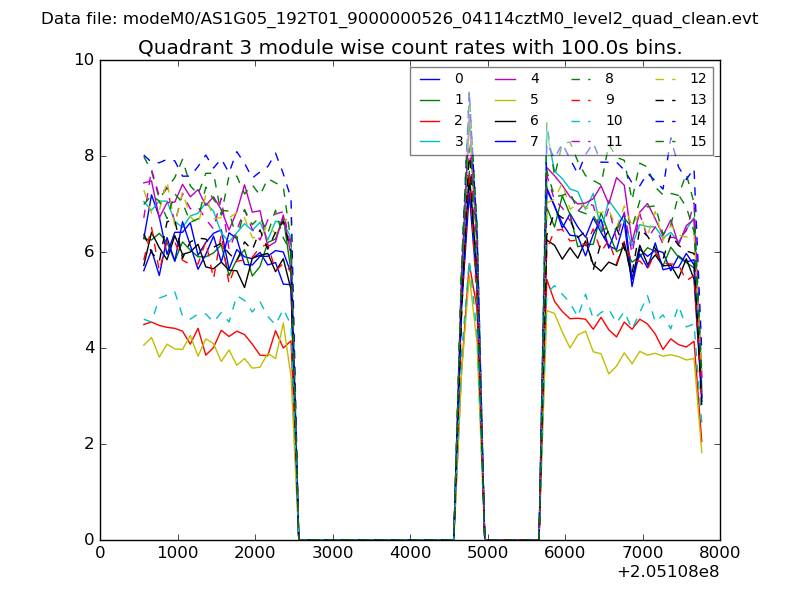 |
 |
| Parameter | Plot |
|---|---|
| CZT HV Monitor | 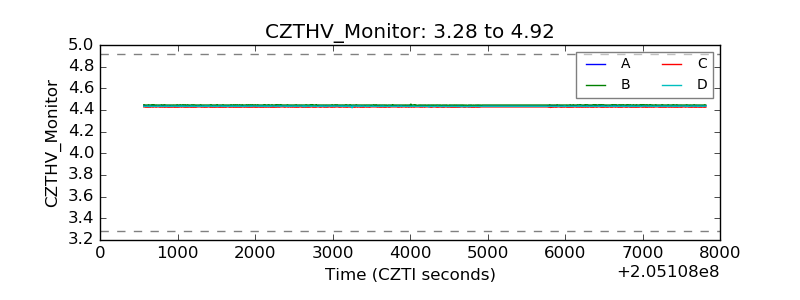 |
| D_VDD | 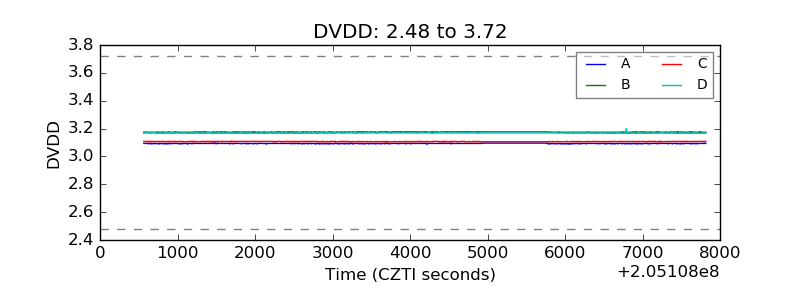 |
| Temperature 1 | 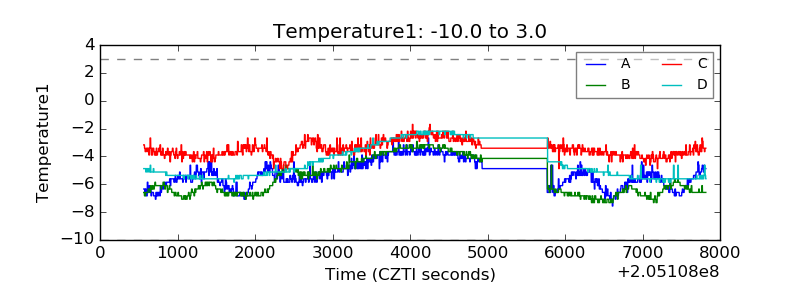 |
| Veto HV Monitor | 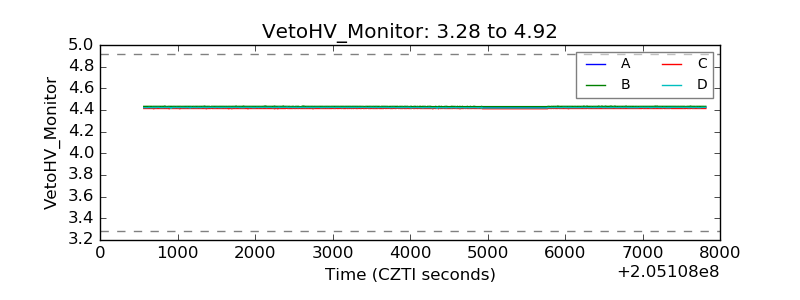 |
| Veto LLD | 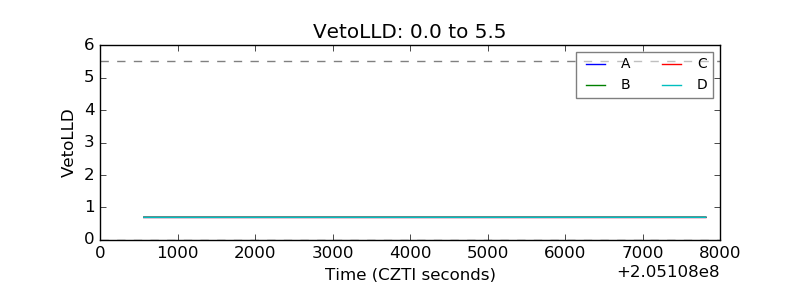 |
| Alpha Counter | 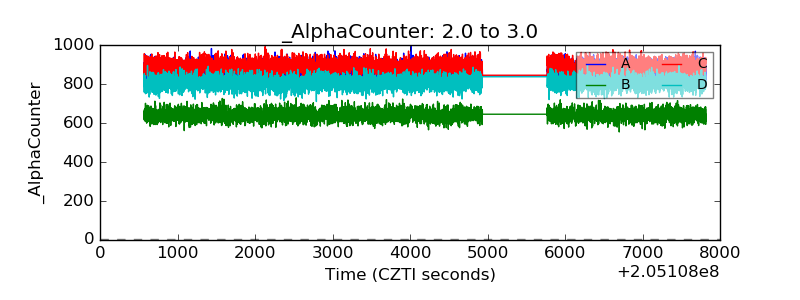 |
| _CPM_Rate | 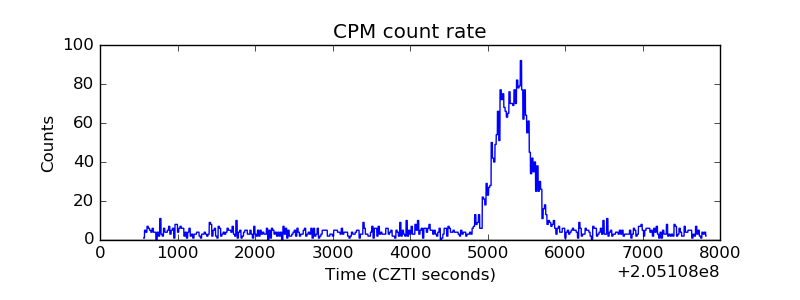 |
| CZT Counter | 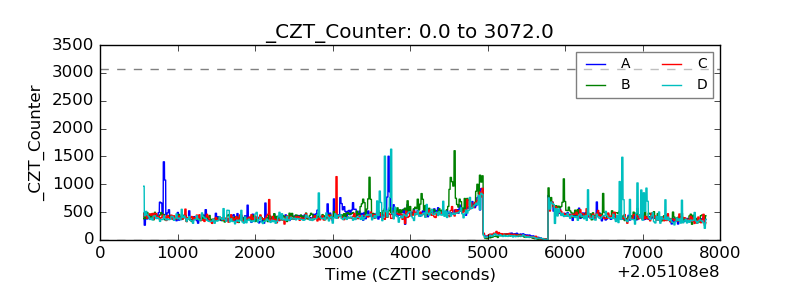 |
| +2.5 Volts monitor | 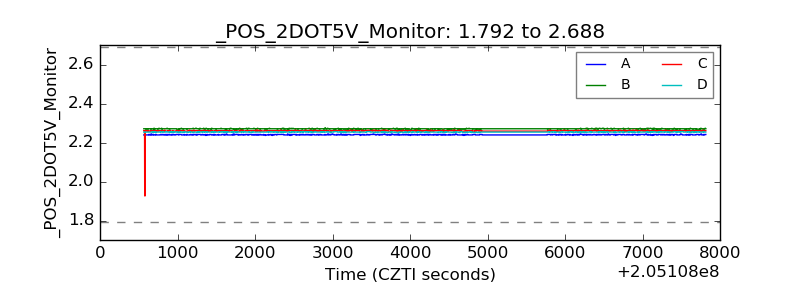 |
| +5 Volts monitor | 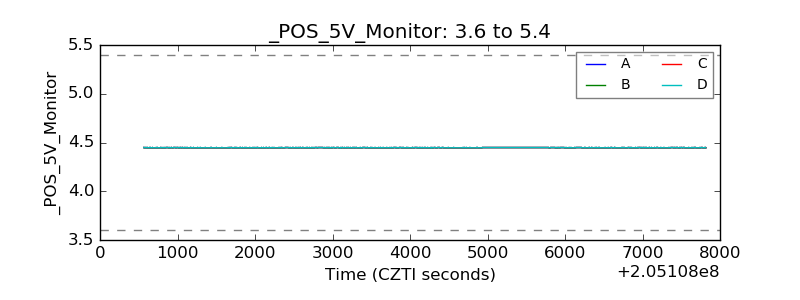 |
| _ROLL_ROT | 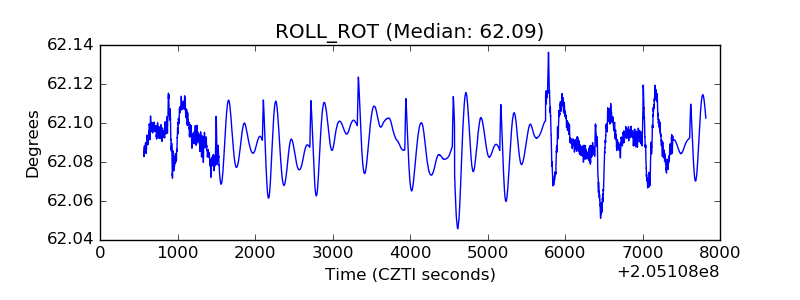 |
| _Roll_DEC | 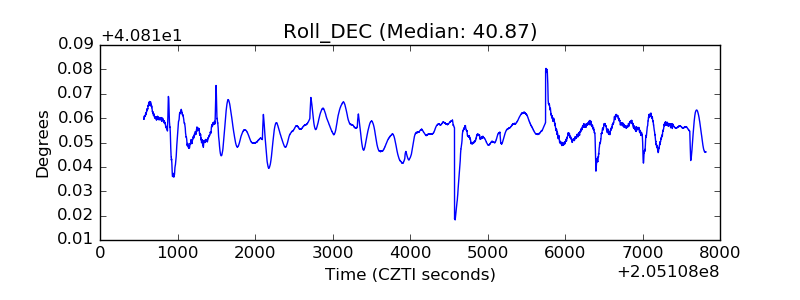 |
| _Roll_RA | 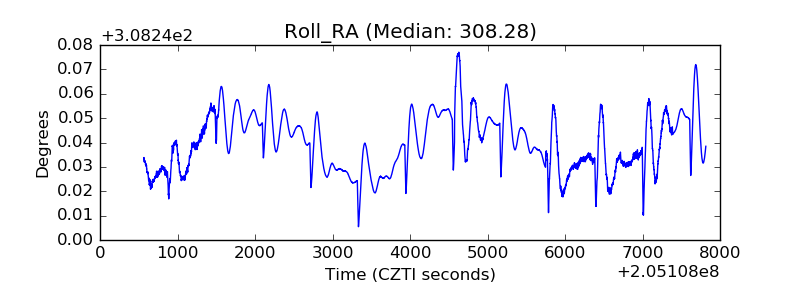 |
| Veto Counter | 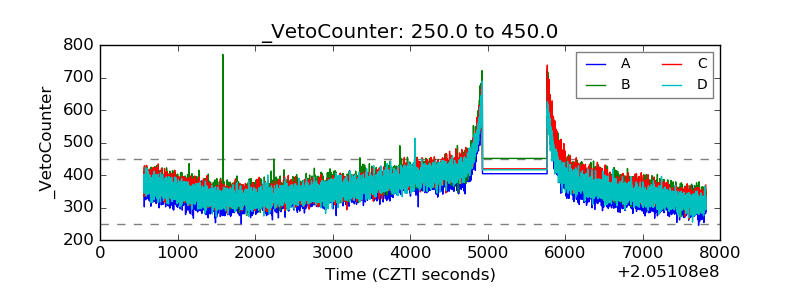 |