| Param | Original file | Final file |
|---|---|---|
| Filename | modeM0/AS1SLEW_01234_9000000525_04110cztM0_level2.evt | modeM0/AS1SLEW_01234_9000000525_04110cztM0_level2_quad_clean.evt |
| Size (bytes) | 28,825,920 | 6,442,560 |
| Size | 27.5 MB | 6.1 MB |
| Events in quadrant A | 200,676 | 38,770 |
| Events in quadrant B | 184,855 | 39,949 |
| Events in quadrant C | 281,188 | 40,484 |
| Events in quadrant D | 175,464 | 39,273 |
| Mode SS | |||
|---|---|---|---|
| Quadrant | BADHDUFLAG | Total packets | Discarded packets |
| A | 0 | 8 | 0 |
| B | 0 | 8 | 0 |
| C | 0 | 8 | 0 |
| D | 0 | 8 | 0 |
| Mode M0 | |||
|---|---|---|---|
| Quadrant | BADHDUFLAG | Total packets | Discarded packets |
| A | 0 | 842 | 0 |
| B | 0 | 803 | 0 |
| C | 0 | 1095 | 0 |
| D | 0 | 807 | 0 |
| Quadrant | Total seconds | Saturated seconds | Saturation percentage |
|---|---|---|---|
| A | 400 | 1 | 0.250000% |
| B | 400 | 0 | 0.000000% |
| C | 400 | 7 | 1.750000% |
| D | 400 | 0 | 0.000000% |
Noise dominated data is calculated using 1-second bins in cleaned event files. If a bin has >2000 counts, and if more than 50% of those come from <1% of pixels, then it is considered to be noise-dominated and hence unusable.
| Quadrant | # 1 sec bins | Bins with >0 counts | Bins with >2000 counts | High rate bins dominated by noise | Noise dominated (total time) | Noise dominated (detector-on time) | Marked lightcurve |
|---|---|---|---|---|---|---|---|
| A | 400 | 400 | 0 | 0 | 0.00% | 0.00% | 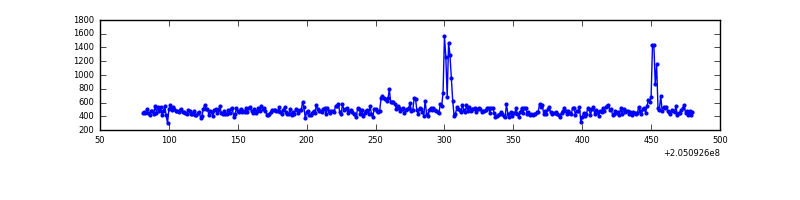 |
| B | 400 | 400 | 0 | 0 | 0.00% | 0.00% | 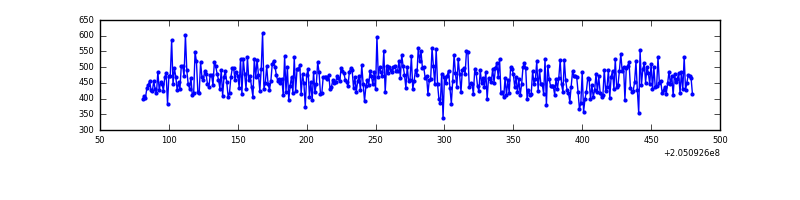 |
| C | 400 | 400 | 2 | 2 | 0.50% | 0.50% | 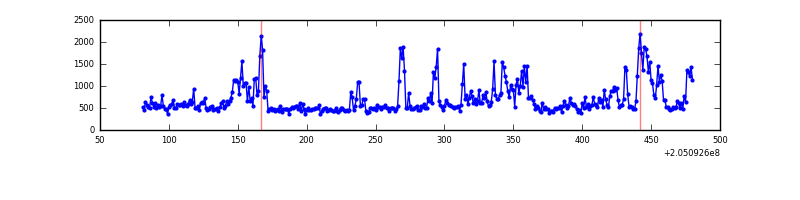 |
| D | 400 | 400 | 0 | 0 | 0.00% | 0.00% | 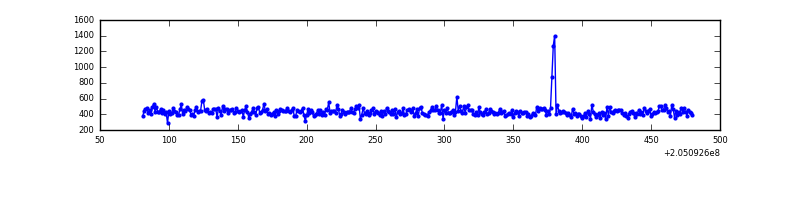 |
Top three noisy pixels from each quadrant. If the there are fewer than three noisy pixels in the level2.evt file, extra rows are filled as -1
| Pixel properties | Quadrant properties | ||||||
|---|---|---|---|---|---|---|---|
| Quadrant | DetID | PixID | Counts | Sigma | Mean | Median | Sigma |
| A | 0 | 50 | 13077 | 1109.96 | 47 | 46 | 11.7 |
| A | 0 | 199 | 2689 | 225.13 | 47 | 46 | 11.7 |
| A | 8 | 15 | 2238 | 186.71 | 47 | 46 | 11.7 |
| B | 12 | 111 | 846 | 69.87 | 47 | 46 | 11.5 |
| B | 11 | 111 | 679 | 55.28 | 47 | 46 | 11.5 |
| B | 8 | 61 | 470 | 37.03 | 47 | 46 | 11.5 |
| C | 9 | 144 | 99312 | 7912.52 | 45 | 46 | 12.5 |
| C | 4 | 254 | 1985 | 154.56 | 45 | 46 | 12.5 |
| C | 13 | 61 | 368 | 25.67 | 45 | 46 | 12.5 |
| D | 13 | 239 | 2590 | 196.29 | 45 | 43 | 13.0 |
| D | 13 | 46 | 1653 | 124.08 | 45 | 43 | 13.0 |
| D | 15 | 127 | 487 | 34.22 | 45 | 43 | 13.0 |
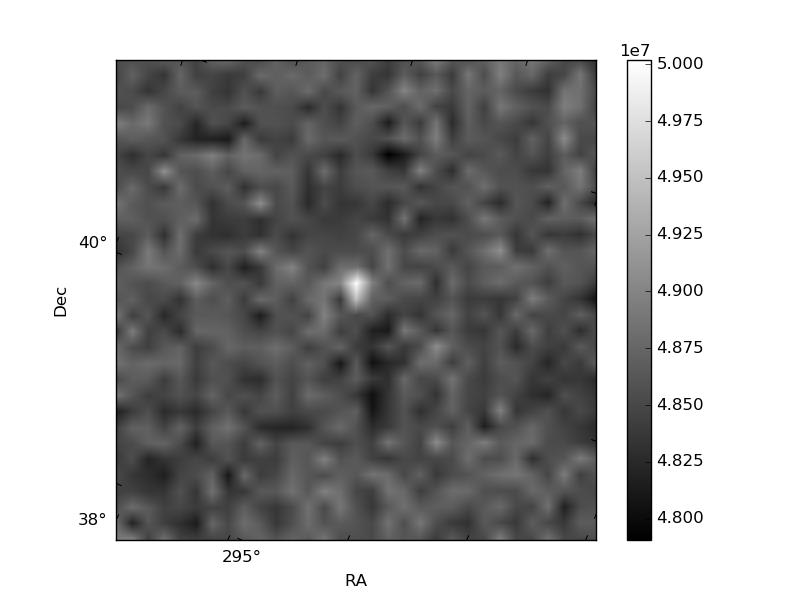
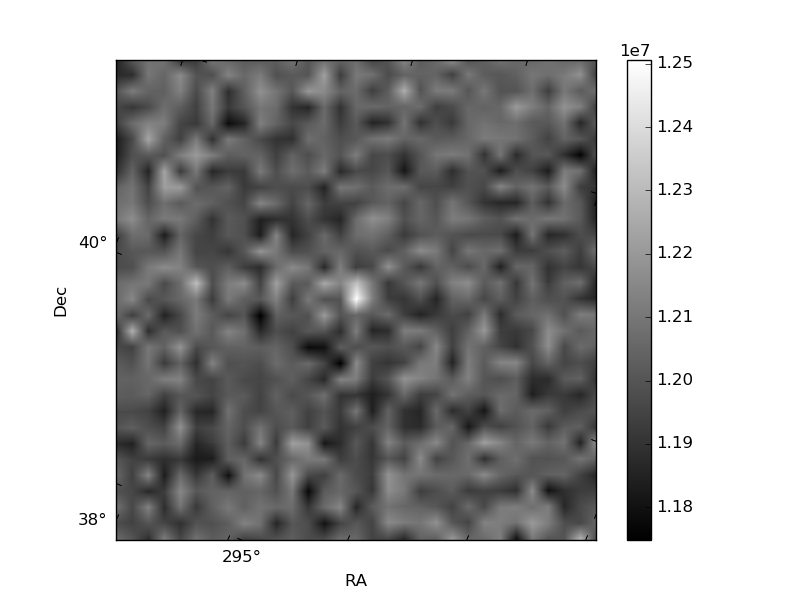
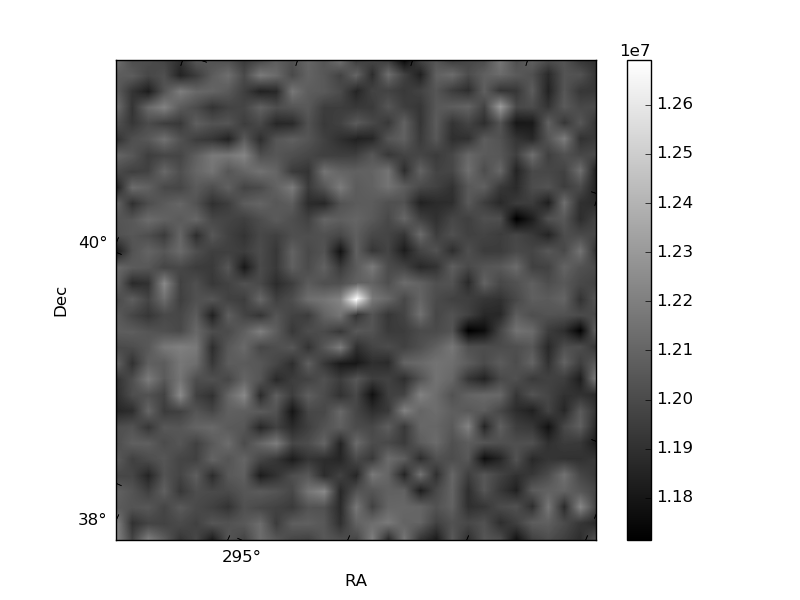
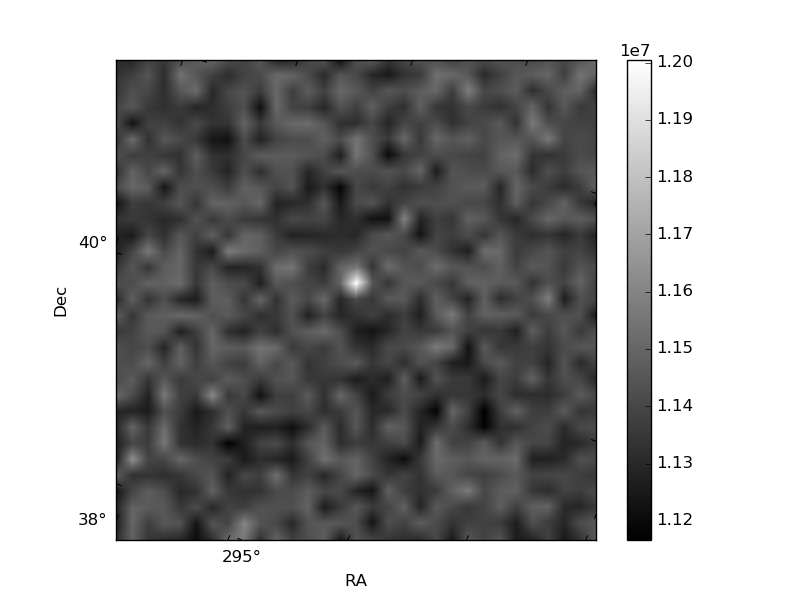
Histogram calculated using DETX and DETY for each event in the final _common_clean file
| Quadrant A | 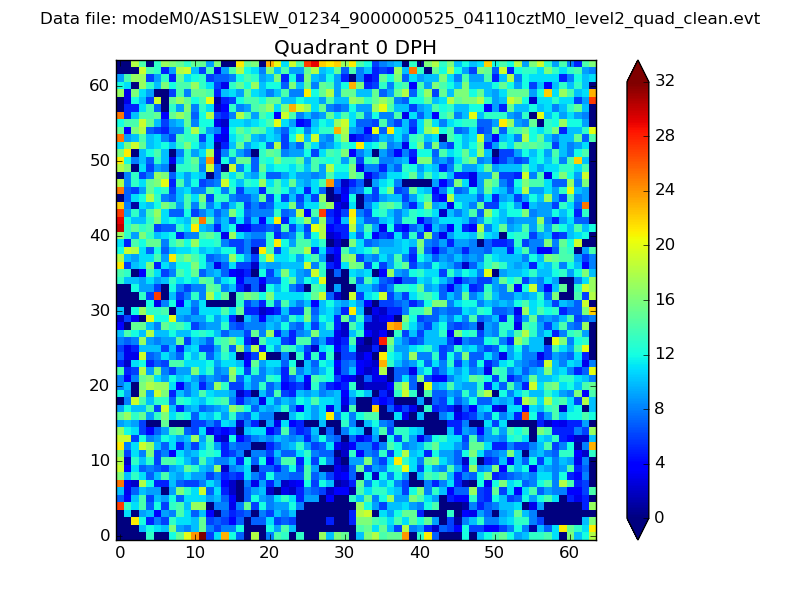 |
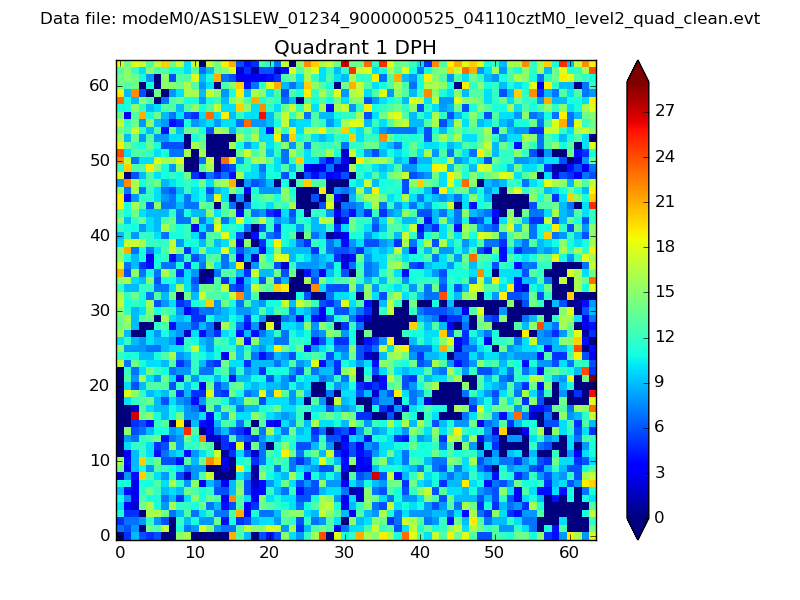 |
Quadrant B |
|---|---|---|---|
| Quadrant D | 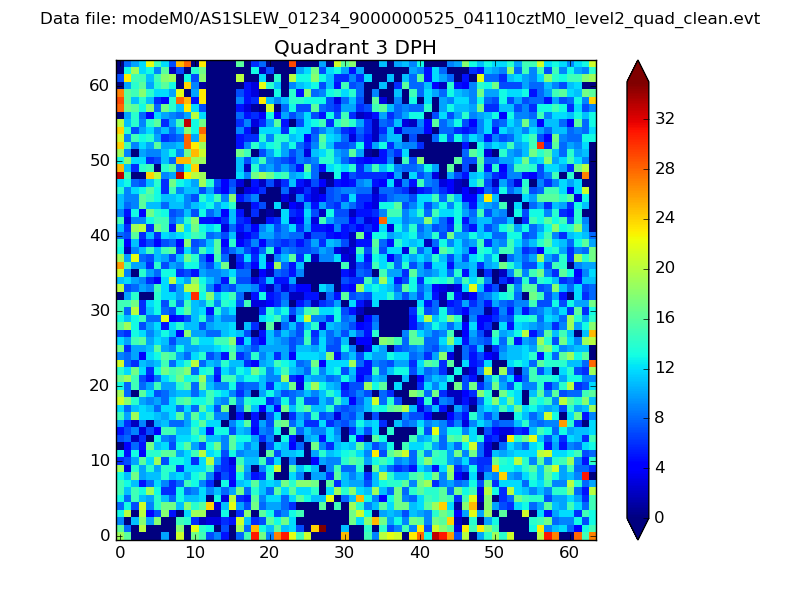 |
 |
Quadrant C |
| Plot type | Count rate plots | Images |
|---|---|---|
| Comparison with Poisson distribution Blue bars denote a histogram of data divided into 1 sec bins. Red curve is a Poisson curve with rate = median count rate of data. |
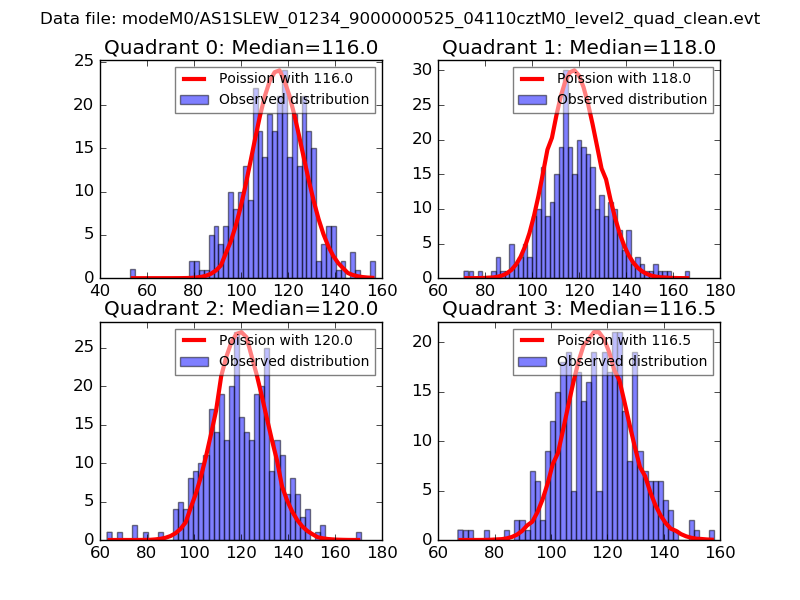 |
 |
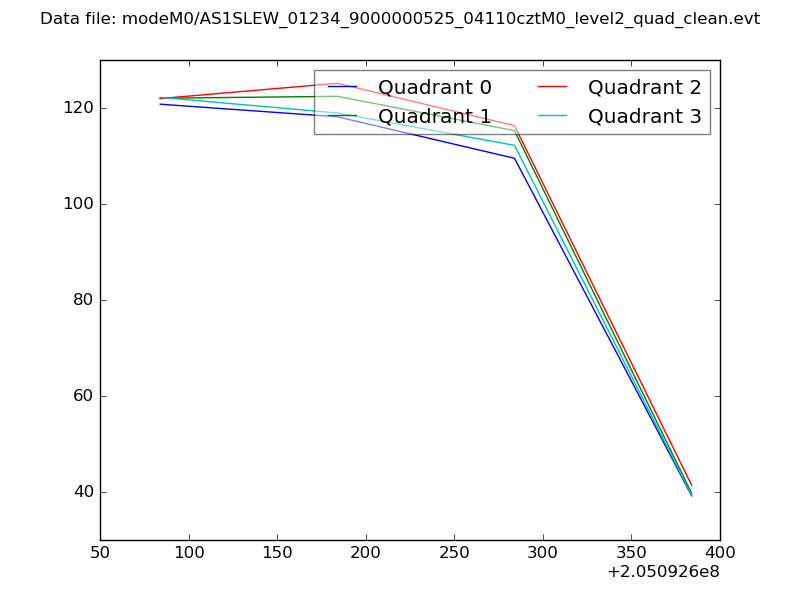
| Quadrant-wise count rates Data is divided into 100 sec bins |
 |
|
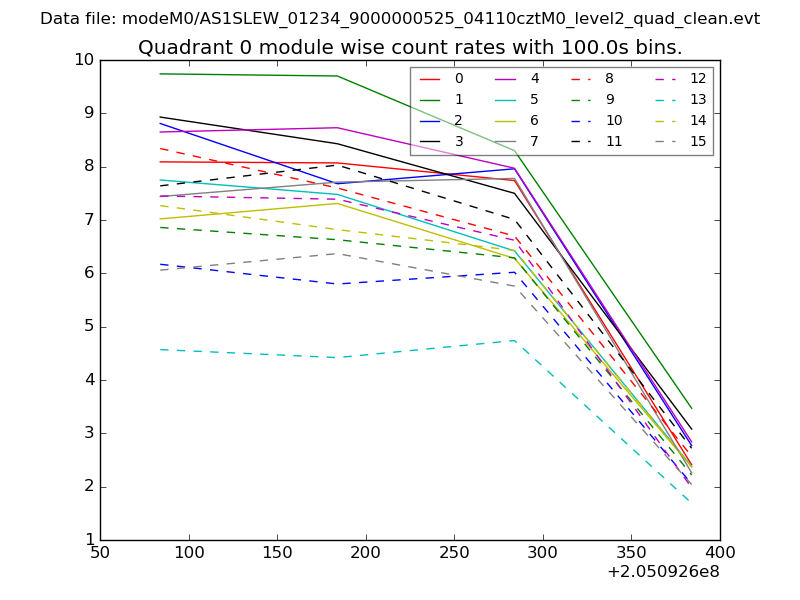
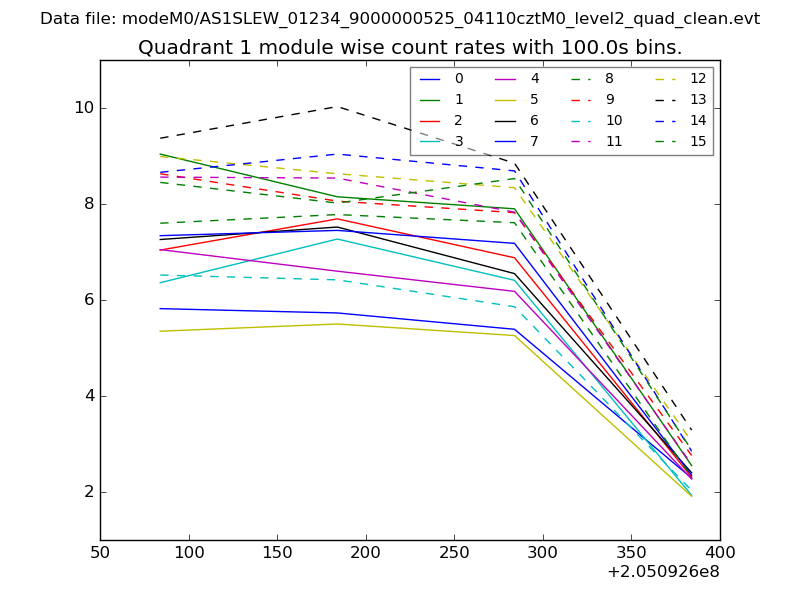
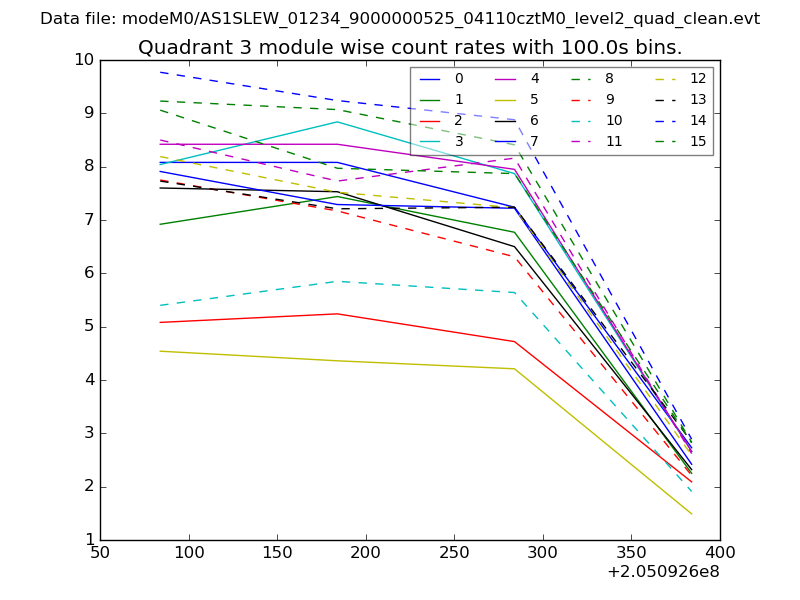
| Module-wise count rates for Quadrant A Data is divided into 100 sec bins |
 |
 |
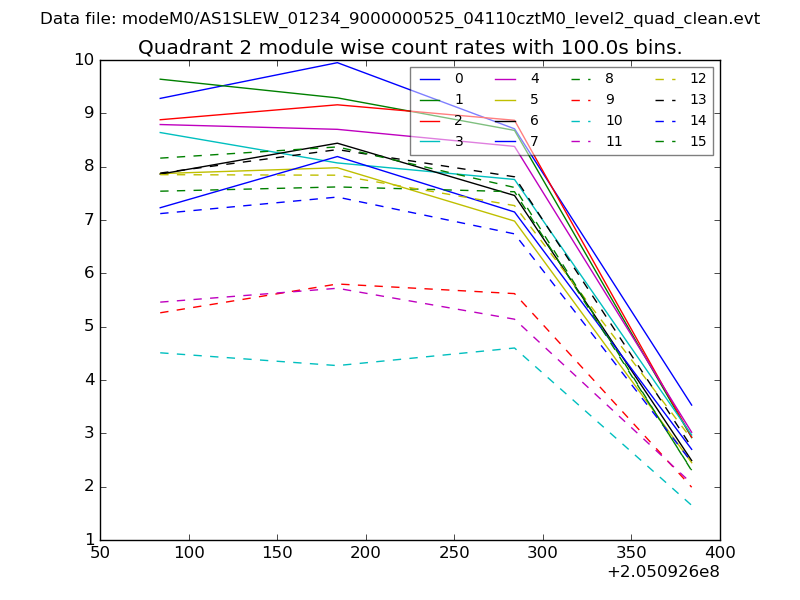
| Module-wise count rates for Quadrant B Data is divided into 100 sec bins |
 |
 |
| Module-wise count rates for Quadrant C Data is divided into 100 sec bins |
 |
 |
| Module-wise count rates for Quadrant D Data is divided into 100 sec bins |
 |
 |
| Parameter | Plot |
|---|---|
| CZT HV Monitor | 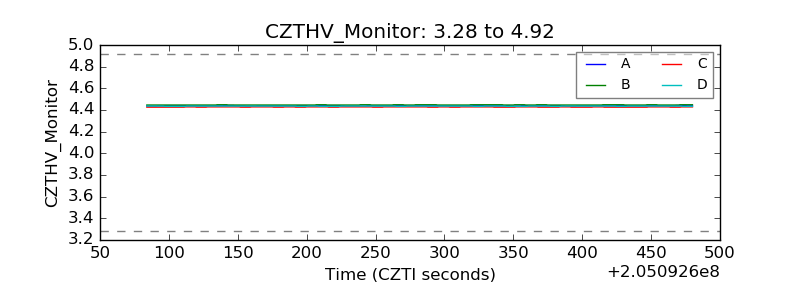 |
| D_VDD | 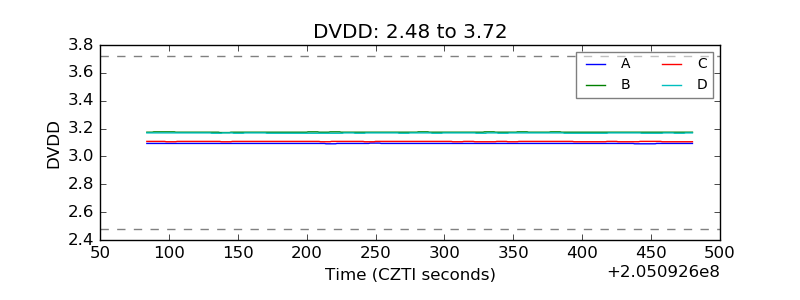 |
| Temperature 1 | 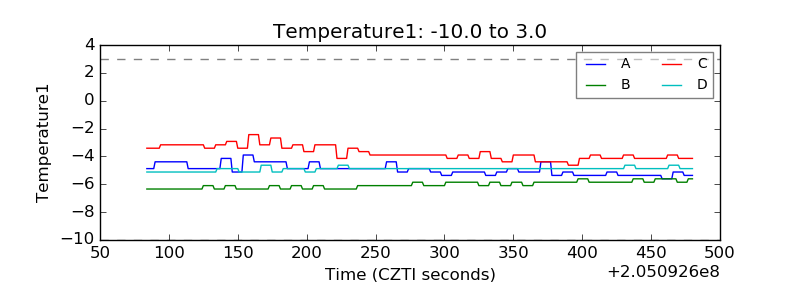 |
| Veto HV Monitor | 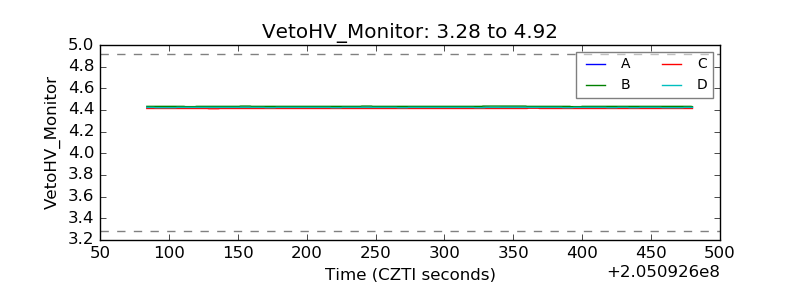 |
| Veto LLD | 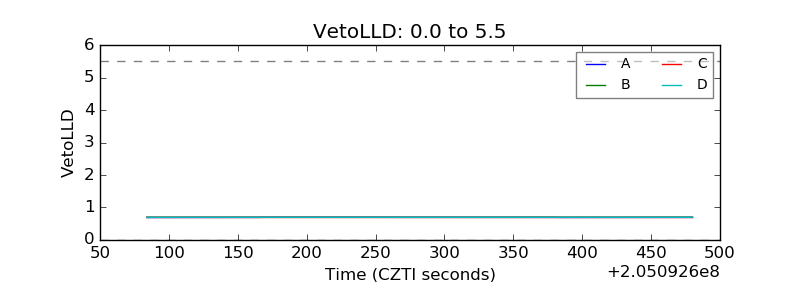 |
| Alpha Counter | 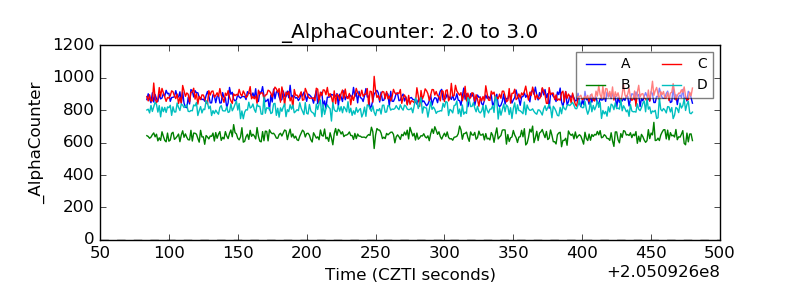 |
| _CPM_Rate | 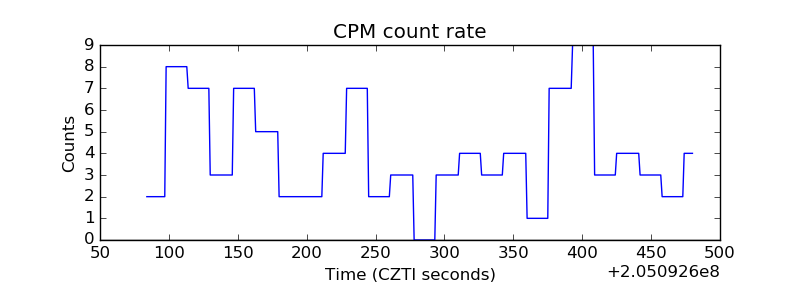 |
| CZT Counter | 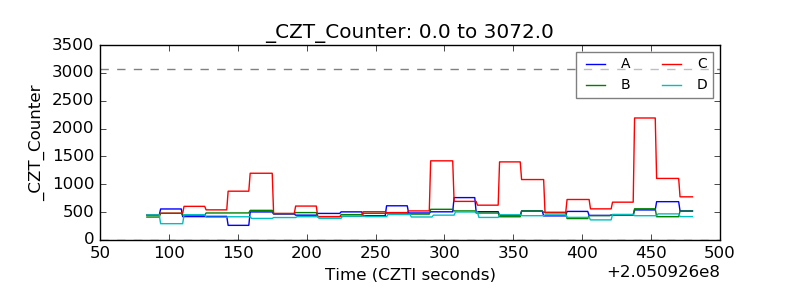 |
| +2.5 Volts monitor |  |
| +5 Volts monitor | 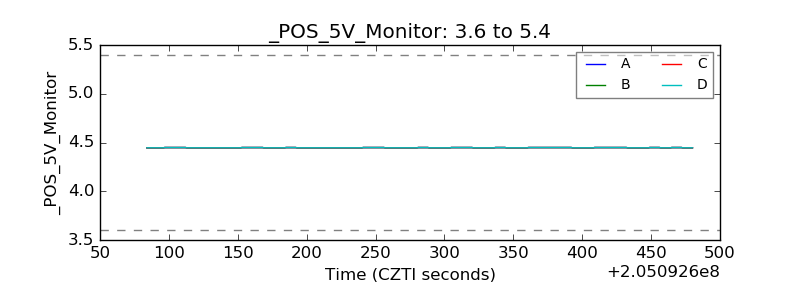 |
| _ROLL_ROT | 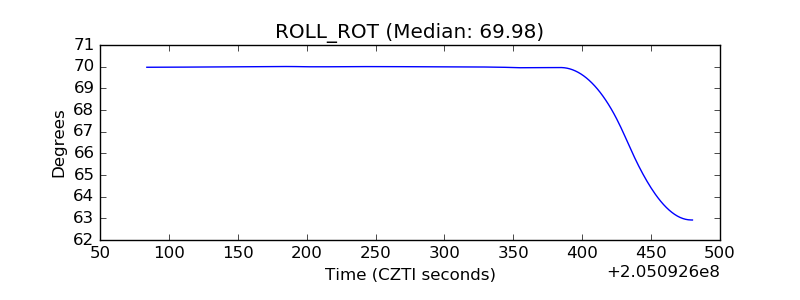 |
| _Roll_DEC | 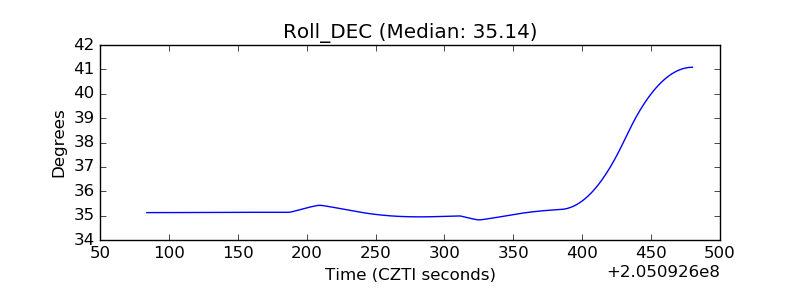 |
| _Roll_RA | 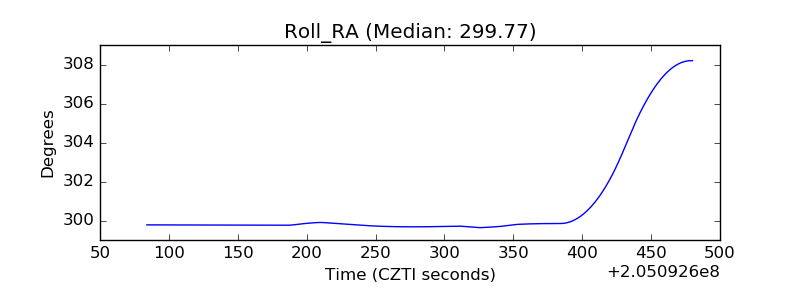 |
| Veto Counter | 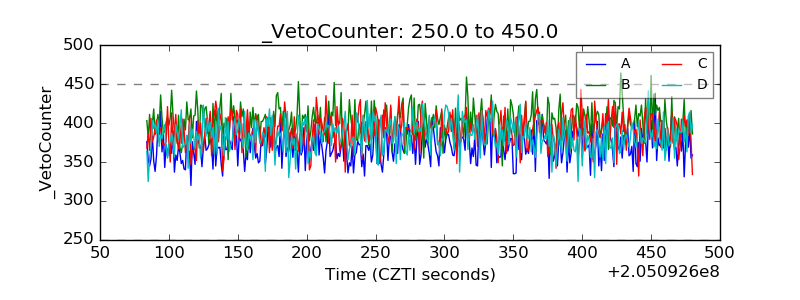 |