| Param | Original file | Final file |
|---|---|---|
| Filename | modeM0/AS1G05_167T01_9000000528cztM0_level2.fits | modeM0/AS1G05_167T01_9000000528cztM0_level2_quad_clean.evt |
| Size (bytes) | 342,751,680 | 376,793,280 |
| Size | 326.9 MB | 359.3 MB |
| Events in quadrant A | 2,023,668 | 2,295,715 |
| Events in quadrant B | 1,973,412 | 2,289,517 |
| Events in quadrant C | 2,021,112 | 2,191,226 |
| Events in quadrant D | 1,749,914 | 2,023,673 |
| Mode SS | |||
|---|---|---|---|
| Quadrant | BADHDUFLAG | Total packets | Discarded packets |
| A | 0 | 772 | 0 |
| B | 0 | 772 | 0 |
| C | 0 | 772 | 0 |
| D | 0 | 774 | 0 |
| Mode M0 | |||
|---|---|---|---|
| Quadrant | BADHDUFLAG | Total packets | Discarded packets |
| A | 0 | 83776 | 0 |
| B | 0 | 80010 | 0 |
| C | 0 | 78869 | 0 |
| D | 0 | 84450 | 0 |
| Mode M9 | |||
|---|---|---|---|
| Quadrant | BADHDUFLAG | Total packets | Discarded packets |
| A | 0 | 33 | 0 |
| B | 0 | 33 | 0 |
| C | 0 | 33 | 0 |
| D | 0 | 33 | 0 |
| Quadrant | Total seconds | Saturated seconds | Saturation percentage |
|---|---|---|---|
| A | 38033 | 778 | 2.045592% |
| B | 38034 | 766 | 2.013987% |
| C | 38032 | 491 | 1.291018% |
| D | 38035 | 843 | 2.216380% |
Noise dominated data is calculated using 1-second bins in cleaned event files. If a bin has >2000 counts, and if more than 50% of those come from <1% of pixels, then it is considered to be noise-dominated and hence unusable.
| Quadrant | # 1 sec bins | Bins with >0 counts | Bins with >2000 counts | High rate bins dominated by noise | Noise dominated (total time) | Noise dominated (detector-on time) | Marked lightcurve |
|---|---|---|---|---|---|---|---|
| A | 40618 | 38028 | 0 | 0 | 0.00% | 0.00% |  |
| B | 40618 | 38032 | 0 | 0 | 0.00% | 0.00% | 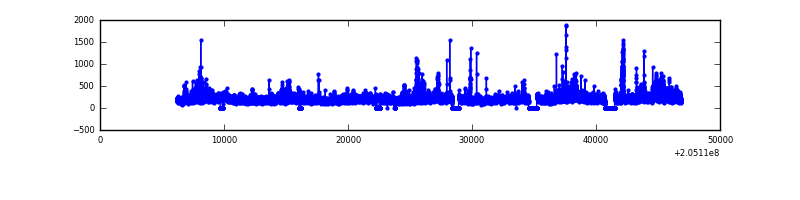 |
| C | 40618 | 38025 | 0 | 0 | 0.00% | 0.00% | 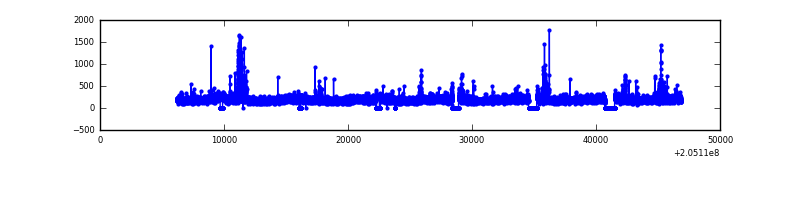 |
| D | 40618 | 38021 | 0 | 0 | 0.00% | 0.00% | 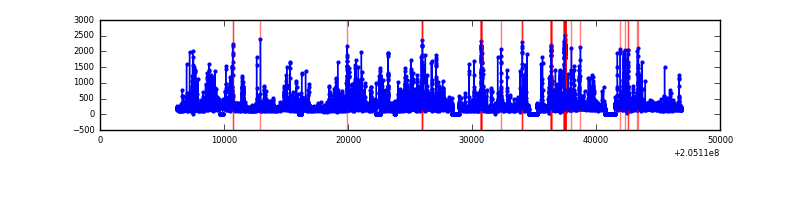 |
Top three noisy pixels from each quadrant. If the there are fewer than three noisy pixels in the level2.evt file, extra rows are filled as -1
| Pixel properties | Quadrant properties | ||||||
|---|---|---|---|---|---|---|---|
| Quadrant | DetID | PixID | Counts | Sigma | Mean | Median | Sigma |
| A | 14 | 188 | 2010 | 10.98 | 524 | 486 | 138.8 |
| A | 0 | 29 | 1978 | 10.75 | 524 | 486 | 138.8 |
| A | 14 | 204 | 1790 | 9.4 | 524 | 486 | 138.8 |
| B | 2 | 9 | 1725 | 11.39 | 518 | 490 | 108.4 |
| B | 12 | 226 | 1473 | 9.07 | 518 | 490 | 108.4 |
| B | 14 | 254 | 1414 | 8.52 | 518 | 490 | 108.4 |
| C | 1 | 80 | 1518 | 6.99 | 533 | 491 | 146.8 |
| C | 1 | 81 | 1489 | 6.8 | 533 | 491 | 146.8 |
| C | 12 | 241 | 1442 | 6.48 | 533 | 491 | 146.8 |
| D | 11 | 82 | 1471 | 7.48 | 497 | 448 | 136.7 |
| D | 3 | 14 | 1348 | 6.58 | 497 | 448 | 136.7 |
| D | 4 | 160 | 1322 | 6.39 | 497 | 448 | 136.7 |
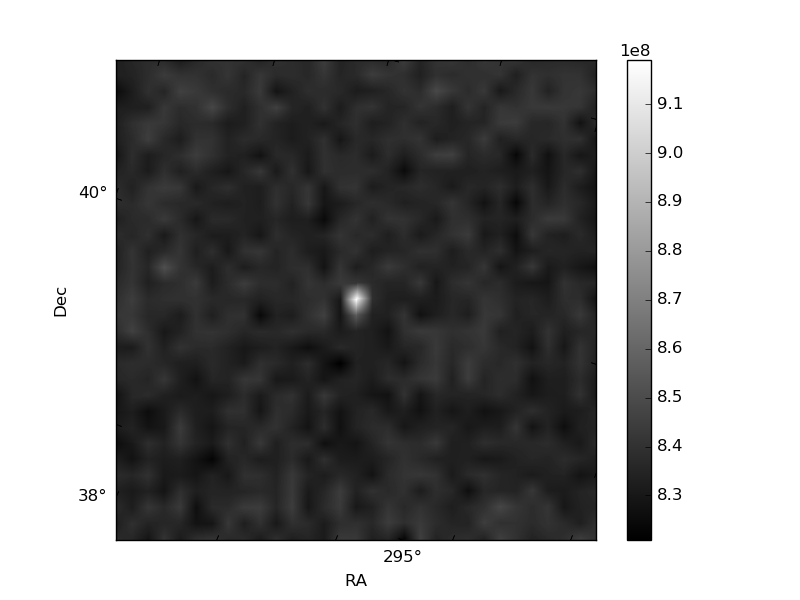
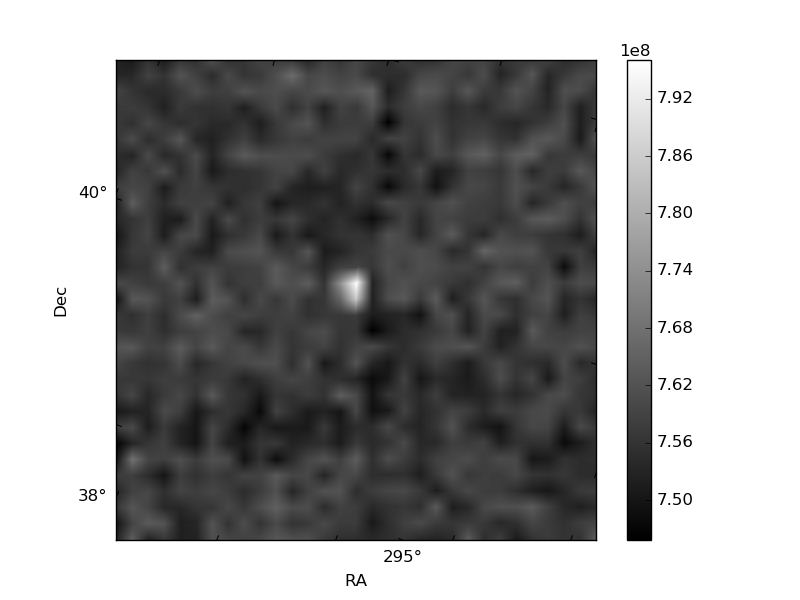
Histogram calculated using DETX and DETY for each event in the final _common_clean file
| Quadrant A | 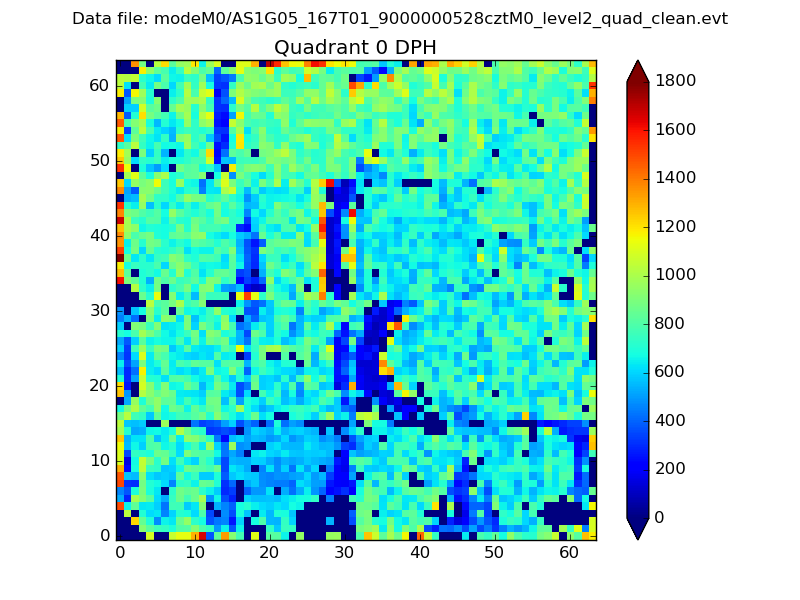 |
 |
Quadrant B |
|---|---|---|---|
| Quadrant D | 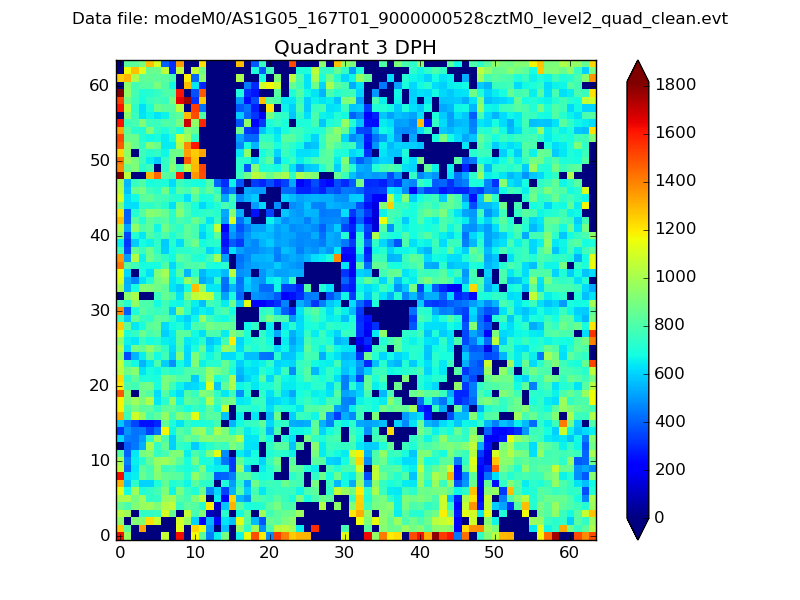 |
 |
Quadrant C |
| Plot type | Count rate plots | Images |
|---|---|---|
| Comparison with Poisson distribution Blue bars denote a histogram of data divided into 1 sec bins. Red curve is a Poisson curve with rate = median count rate of data. |
 |
 |
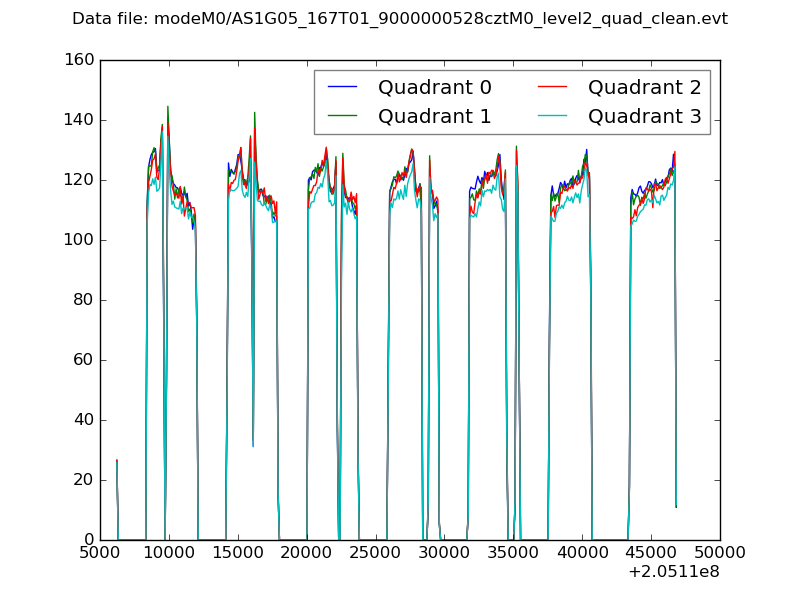
| Quadrant-wise count rates Data is divided into 100 sec bins |
 |
|
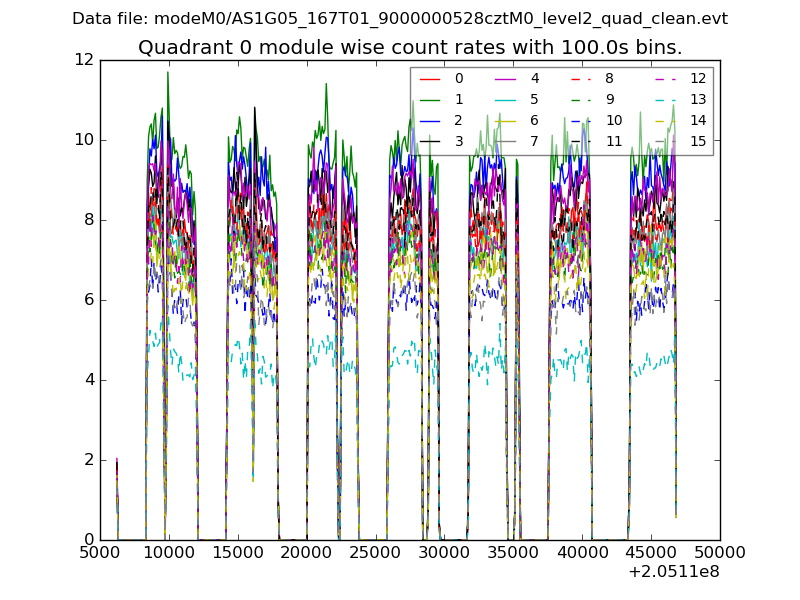
| Module-wise count rates for Quadrant A Data is divided into 100 sec bins |
 |
 |
| Module-wise count rates for Quadrant B Data is divided into 100 sec bins |
 |
 |
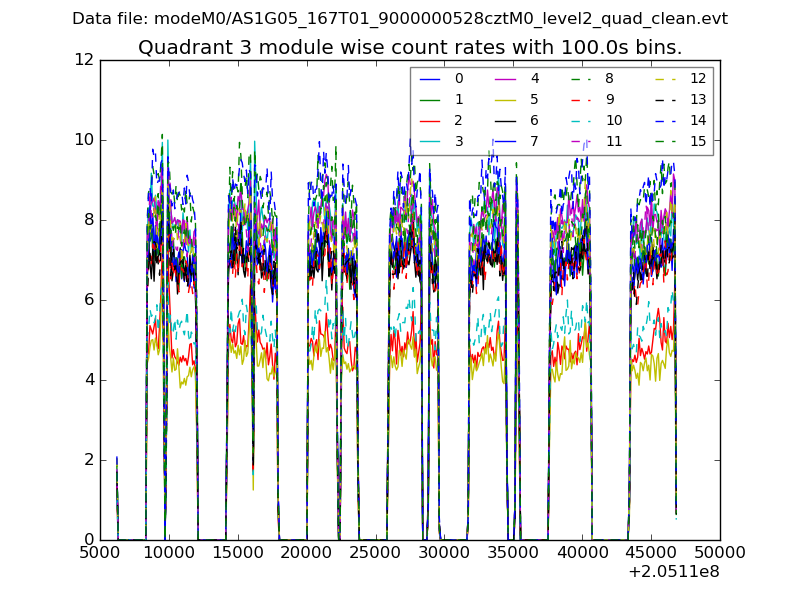
| Module-wise count rates for Quadrant C Data is divided into 100 sec bins |
 |
 |
| Module-wise count rates for Quadrant D Data is divided into 100 sec bins |
 |
 |
| Parameter | Plot |
|---|---|
| CZT HV Monitor |  |
| D_VDD | 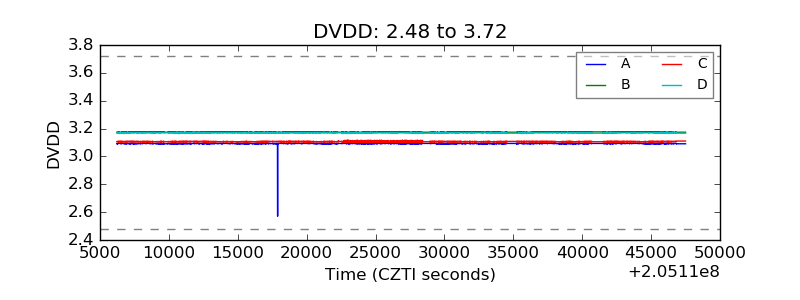 |
| Temperature 1 |  |
| Veto HV Monitor |  |
| Veto LLD | 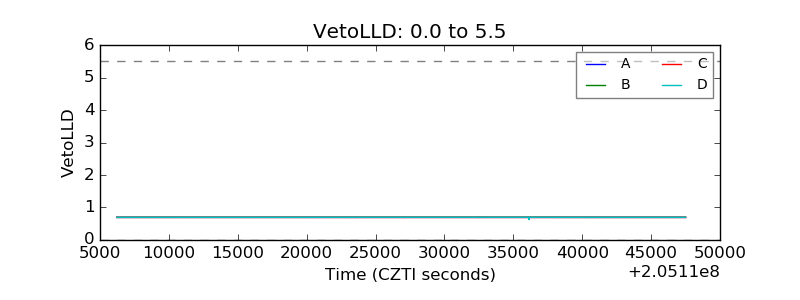 |
| Alpha Counter |  |
| _CPM_Rate |  |
| CZT Counter | 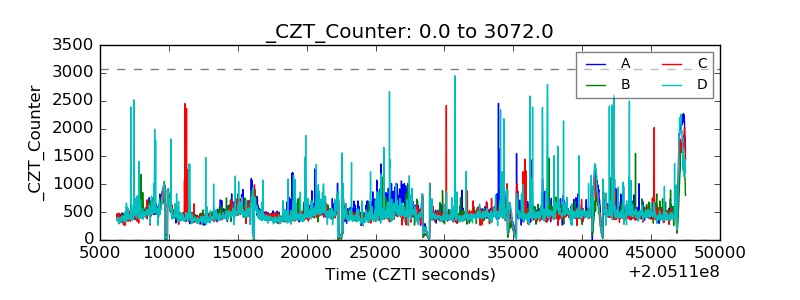 |
| +2.5 Volts monitor | 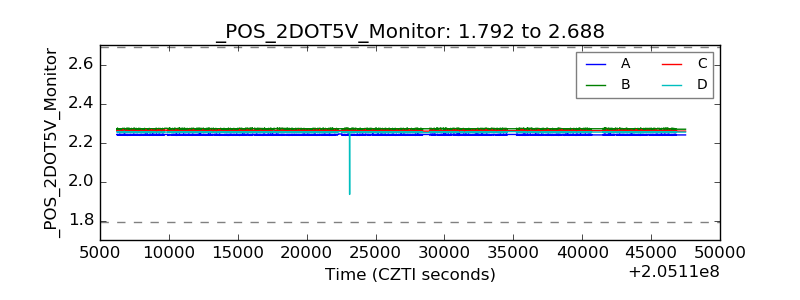 |
| +5 Volts monitor | 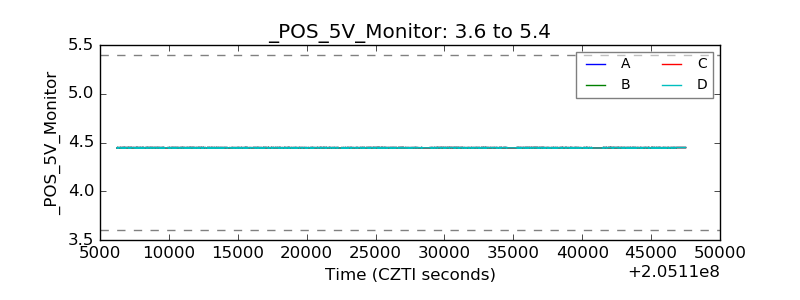 |
| _ROLL_ROT |  |
| _Roll_DEC |  |
| _Roll_RA | 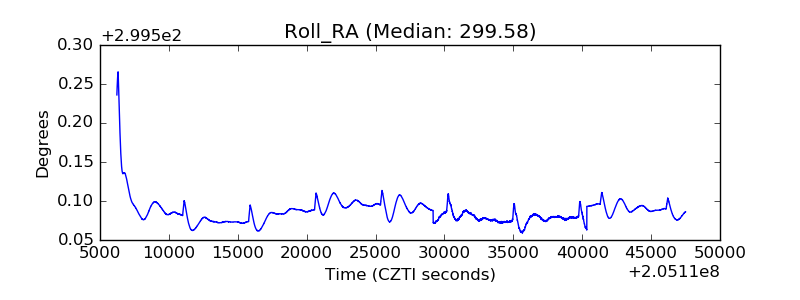 |
| Veto Counter |  |