| Param | Original file | Final file |
|---|---|---|
| Filename | modeM0/AS1G05_167T01_9000000528_04114cztM0_level2.evt | modeM0/AS1G05_167T01_9000000528_04114cztM0_level2_quad_clean.evt |
| Size (bytes) | 358,764,480 | 59,892,480 |
| Size | 342.1 MB | 57.1 MB |
| Events in quadrant A | 2,513,685 | 368,259 |
| Events in quadrant B | 2,667,641 | 368,132 |
| Events in quadrant C | 2,593,139 | 363,005 |
| Events in quadrant D | 2,736,874 | 350,069 |
| Mode SS | |||
|---|---|---|---|
| Quadrant | BADHDUFLAG | Total packets | Discarded packets |
| A | 0 | 106 | 0 |
| B | 0 | 106 | 0 |
| C | 0 | 106 | 0 |
| D | 0 | 106 | 0 |
| Mode M0 | |||
|---|---|---|---|
| Quadrant | BADHDUFLAG | Total packets | Discarded packets |
| A | 0 | 10981 | 2 |
| B | 0 | 11287 | 1 |
| C | 0 | 11301 | 3 |
| D | 0 | 11871 | 1 |
| Mode M9 | |||
|---|---|---|---|
| Quadrant | BADHDUFLAG | Total packets | Discarded packets |
| A | 0 | 2 | 0 |
| B | 0 | 2 | 0 |
| C | 0 | 2 | 0 |
| D | 0 | 2 | 0 |
| Quadrant | Total seconds | Saturated seconds | Saturation percentage |
|---|---|---|---|
| A | 5188 | 167 | 3.218967% |
| B | 5188 | 203 | 3.912876% |
| C | 5187 | 153 | 2.949682% |
| D | 5188 | 146 | 2.814187% |
Noise dominated data is calculated using 1-second bins in cleaned event files. If a bin has >2000 counts, and if more than 50% of those come from <1% of pixels, then it is considered to be noise-dominated and hence unusable.
| Quadrant | # 1 sec bins | Bins with >0 counts | Bins with >2000 counts | High rate bins dominated by noise | Noise dominated (total time) | Noise dominated (detector-on time) | Marked lightcurve |
|---|---|---|---|---|---|---|---|
| A | 5387 | 5187 | 0 | 0 | 0.00% | 0.00% | 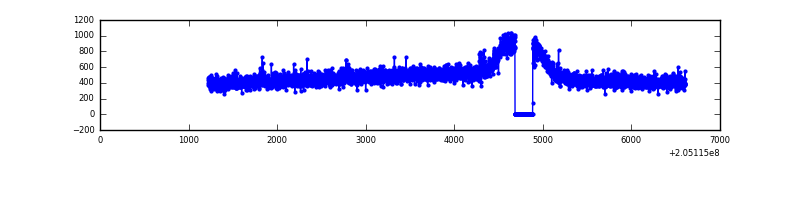 |
| B | 5387 | 5187 | 0 | 0 | 0.00% | 0.00% | 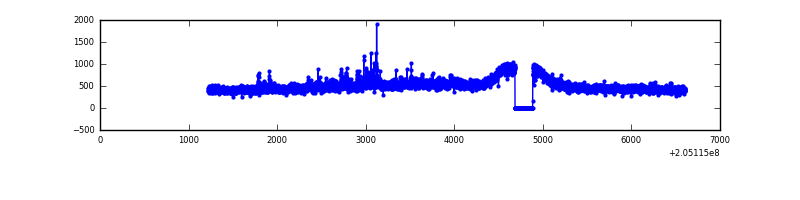 |
| C | 5387 | 5186 | 16 | 16 | 0.30% | 0.31% | 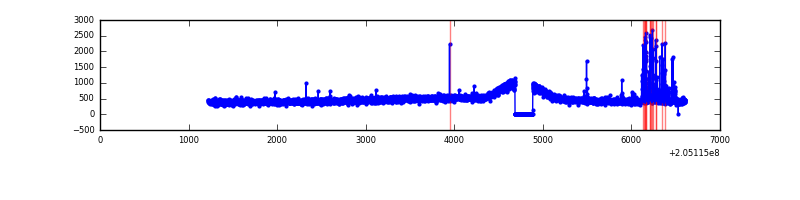 |
| D | 5387 | 5187 | 31 | 31 | 0.58% | 0.60% | 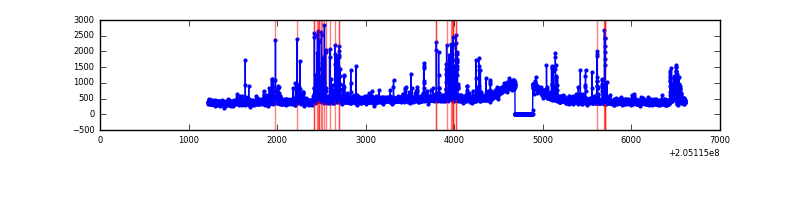 |
Top three noisy pixels from each quadrant. If the there are fewer than three noisy pixels in the level2.evt file, extra rows are filled as -1
| Pixel properties | Quadrant properties | ||||||
|---|---|---|---|---|---|---|---|
| Quadrant | DetID | PixID | Counts | Sigma | Mean | Median | Sigma |
| A | 0 | 50 | 20618 | 147.82 | 644 | 630 | 135.2 |
| A | 0 | 199 | 9855 | 68.22 | 644 | 630 | 135.2 |
| A | 0 | 226 | 7233 | 48.83 | 644 | 630 | 135.2 |
| B | 14 | 167 | 90017 | 700.58 | 649 | 634 | 127.6 |
| B | 15 | 204 | 53995 | 418.24 | 649 | 634 | 127.6 |
| B | 12 | 111 | 11889 | 88.22 | 649 | 634 | 127.6 |
| C | 14 | 234 | 113376 | 758.29 | 630 | 634 | 148.7 |
| C | 10 | 65 | 10107 | 63.71 | 630 | 634 | 148.7 |
| C | 9 | 144 | 8789 | 54.85 | 630 | 634 | 148.7 |
| D | 13 | 239 | 211474 | 1372.08 | 624 | 606 | 153.7 |
| D | 10 | 172 | 68842 | 444.0 | 624 | 606 | 153.7 |
| D | 2 | 14 | 40681 | 260.76 | 624 | 606 | 153.7 |
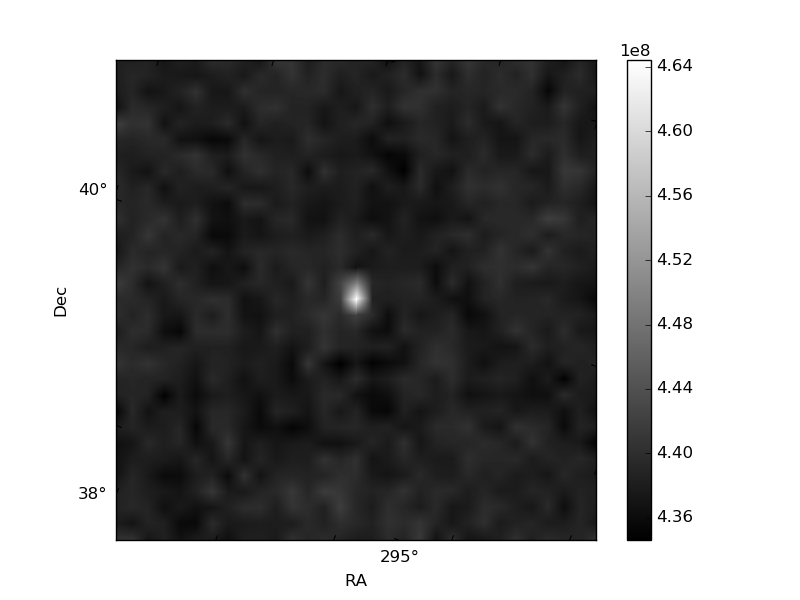
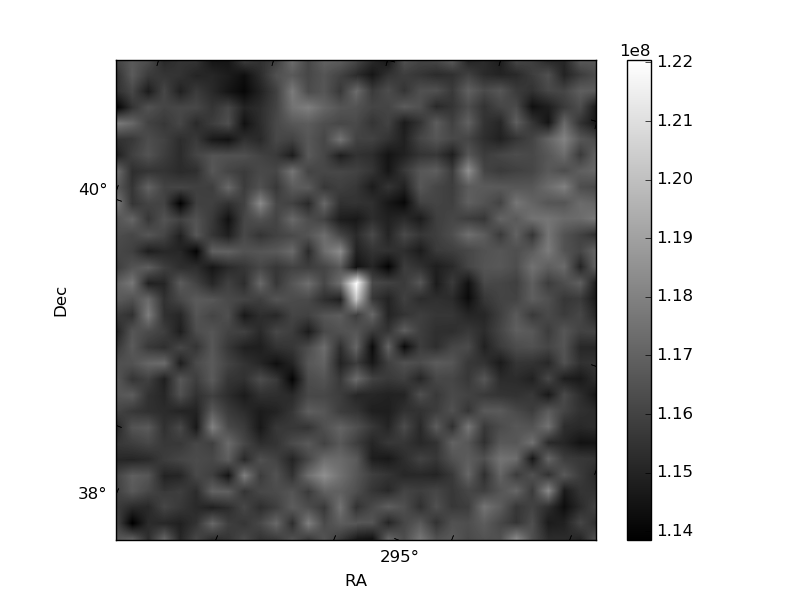
Histogram calculated using DETX and DETY for each event in the final _common_clean file
| Quadrant A | 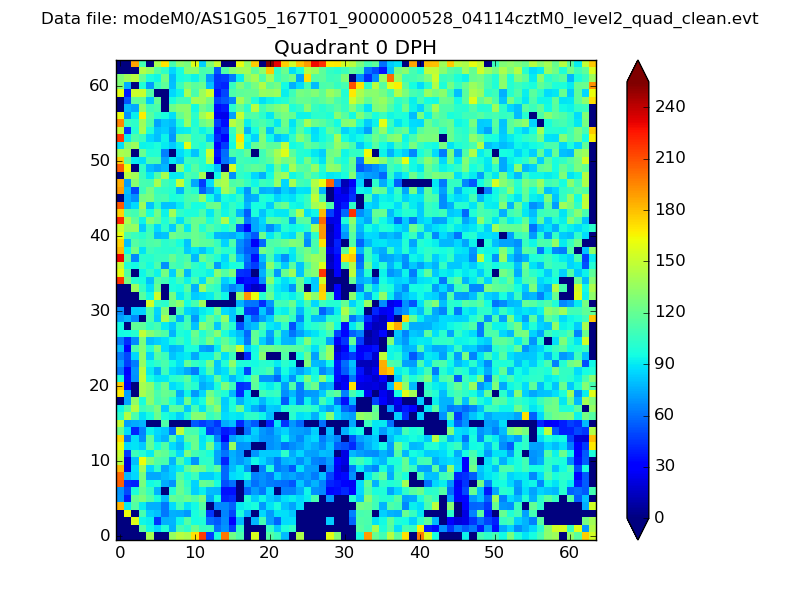 |
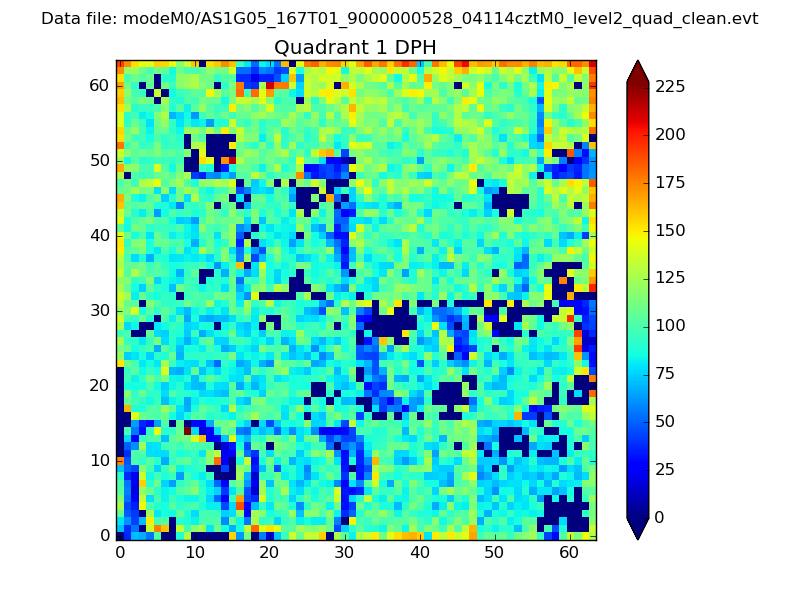 |
Quadrant B |
|---|---|---|---|
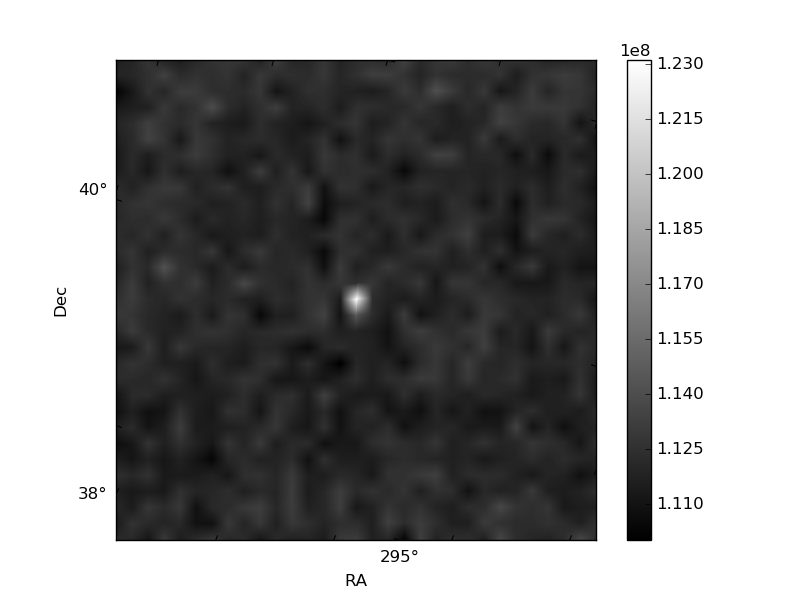
| Quadrant D | 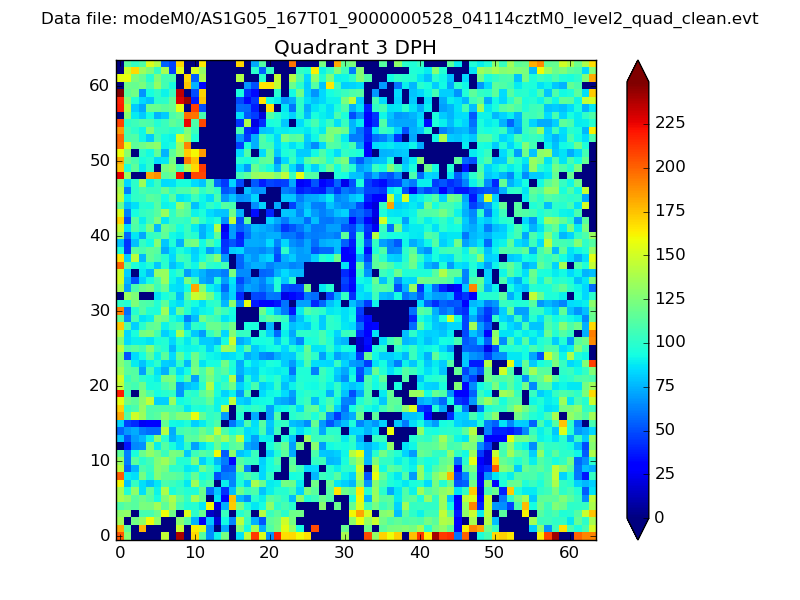 |
 |
Quadrant C |
| Plot type | Count rate plots | Images |
|---|---|---|
| Comparison with Poisson distribution Blue bars denote a histogram of data divided into 1 sec bins. Red curve is a Poisson curve with rate = median count rate of data. |
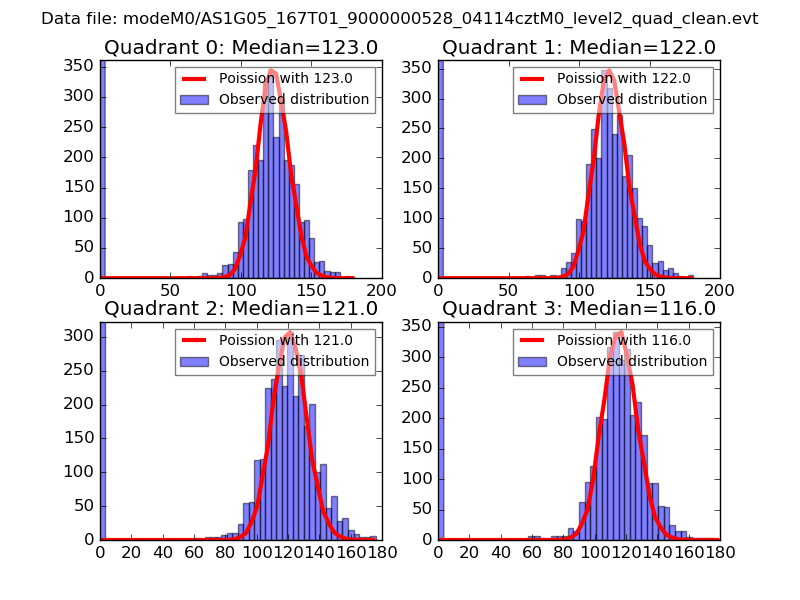 |
 |
| Quadrant-wise count rates Data is divided into 100 sec bins |
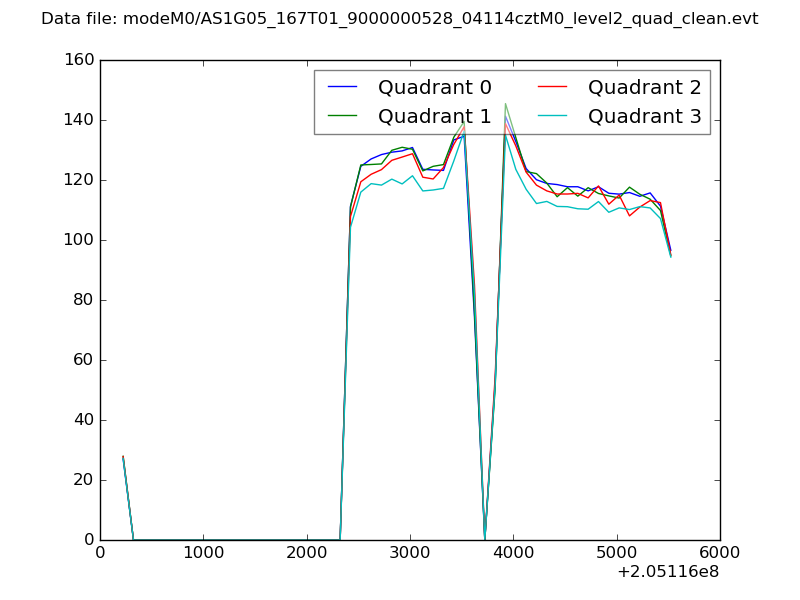 |
|
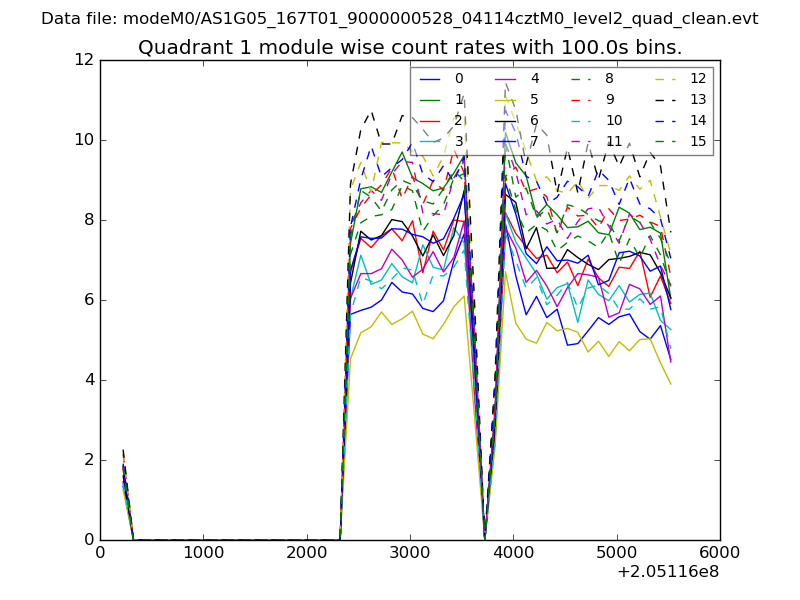
| Module-wise count rates for Quadrant A Data is divided into 100 sec bins |
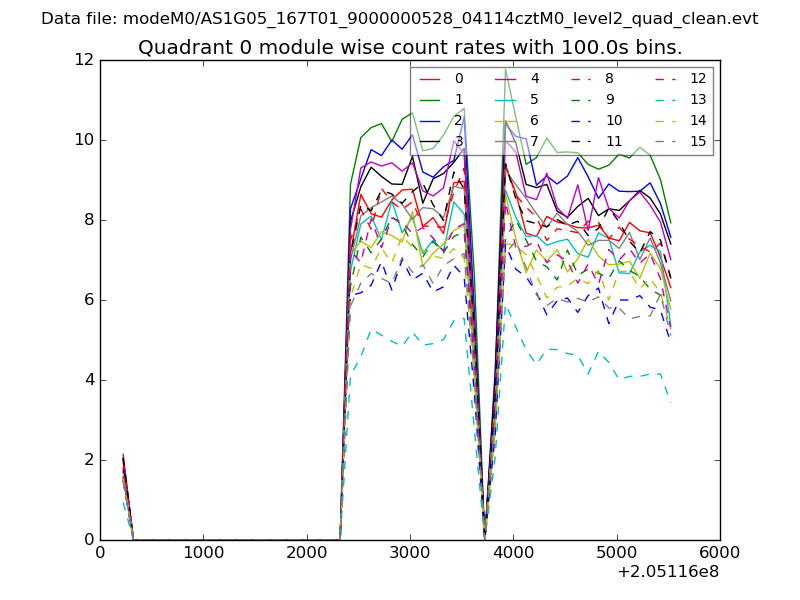 |
 |
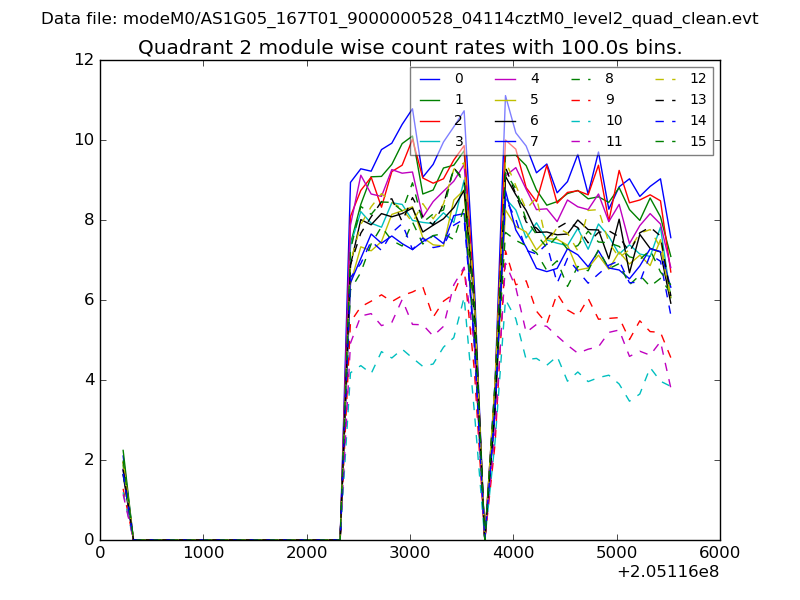
| Module-wise count rates for Quadrant B Data is divided into 100 sec bins |
 |
 |
| Module-wise count rates for Quadrant C Data is divided into 100 sec bins |
 |
 |
| Module-wise count rates for Quadrant D Data is divided into 100 sec bins |
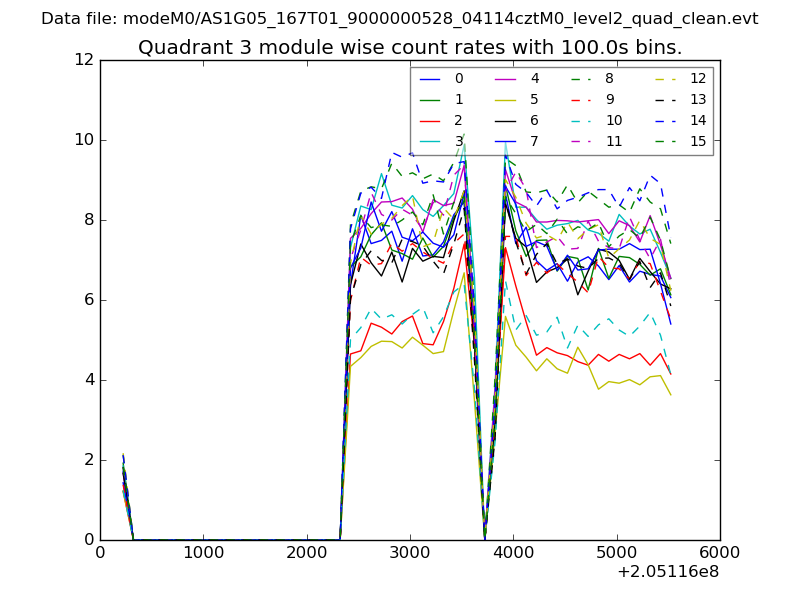 |
 |
| Parameter | Plot |
|---|---|
| CZT HV Monitor | 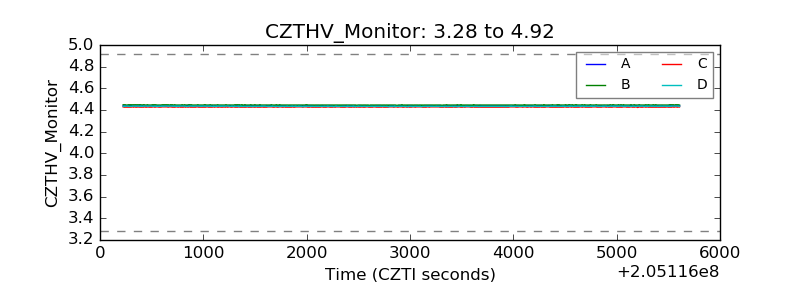 |
| D_VDD | 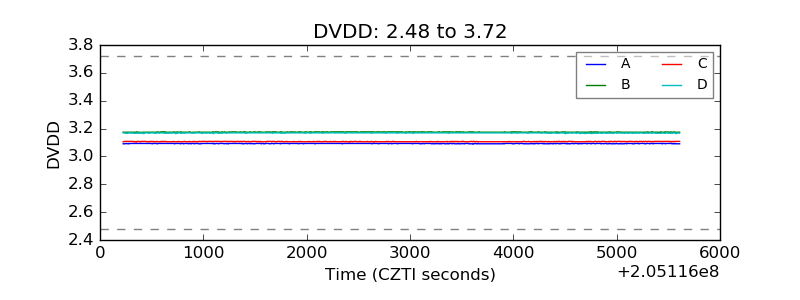 |
| Temperature 1 | 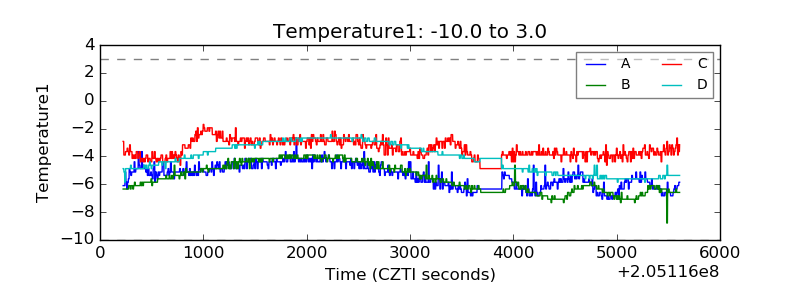 |
| Veto HV Monitor | 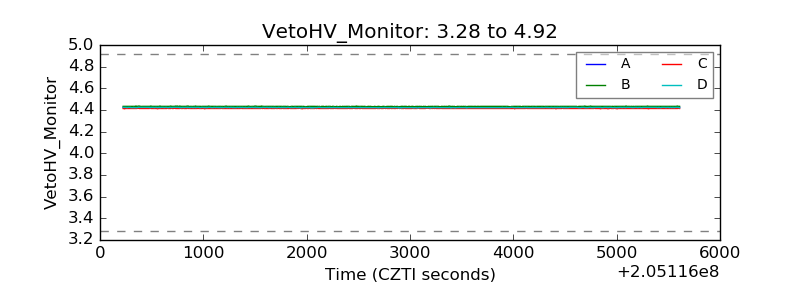 |
| Veto LLD | 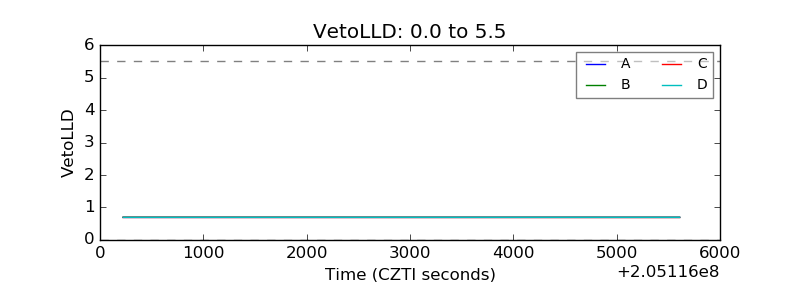 |
| Alpha Counter | 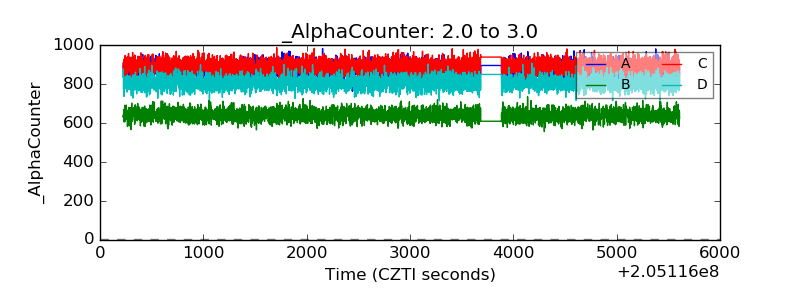 |
| _CPM_Rate | 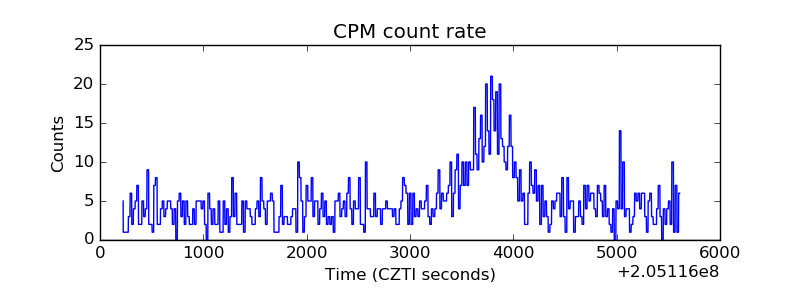 |
| CZT Counter | 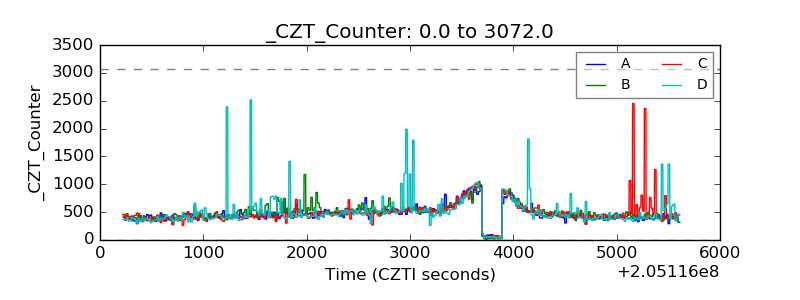 |
| +2.5 Volts monitor |  |
| +5 Volts monitor |  |
| _ROLL_ROT | 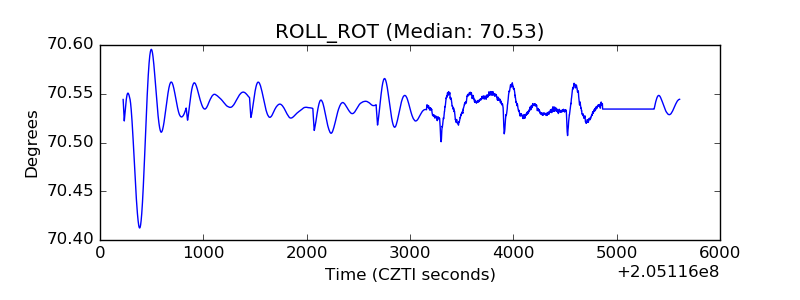 |
| _Roll_DEC | 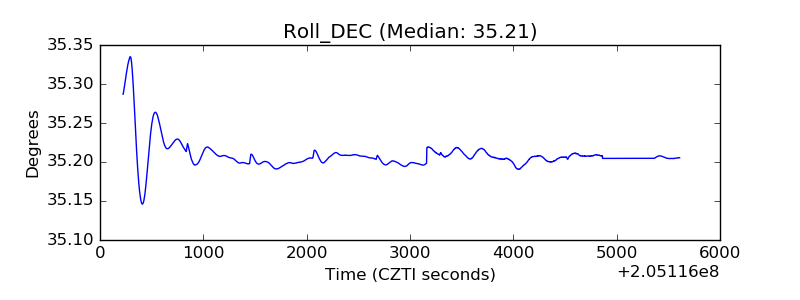 |
| _Roll_RA | 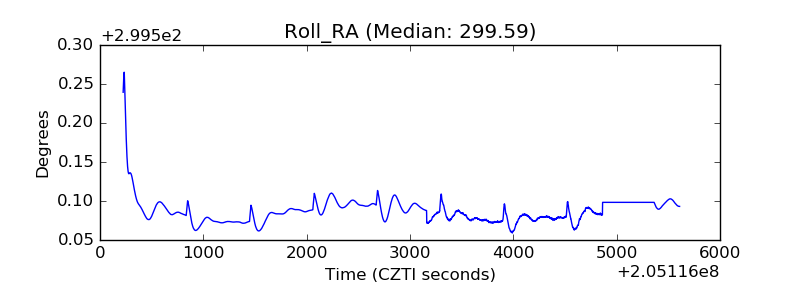 |
| Veto Counter | 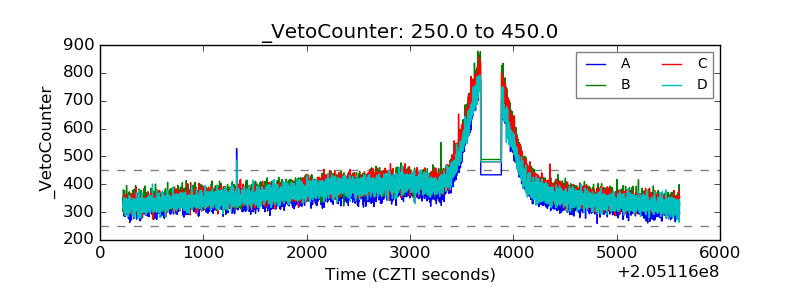 |