| Param | Original file | Final file |
|---|---|---|
| Filename | modeM0/AS1G05_167T01_9000000528_04119cztM0_level2.evt | modeM0/AS1G05_167T01_9000000528_04119cztM0_level2_quad_clean.evt |
| Size (bytes) | 1,580,319,360 | 251,982,720 |
| Size | 1.5 GB | 240.3 MB |
| Events in quadrant A | 12,465,693 | 1,528,575 |
| Events in quadrant B | 11,245,413 | 1,532,147 |
| Events in quadrant C | 10,541,038 | 1,521,293 |
| Events in quadrant D | 12,048,377 | 1,461,435 |
| Mode SS | |||
|---|---|---|---|
| Quadrant | BADHDUFLAG | Total packets | Discarded packets |
| A | 0 | 468 | 2 |
| B | 0 | 468 | 2 |
| C | 0 | 468 | 2 |
| D | 0 | 468 | 0 |
| Mode M0 | |||
|---|---|---|---|
| Quadrant | BADHDUFLAG | Total packets | Discarded packets |
| A | 0 | 52282 | 120 |
| B | 0 | 48244 | 104 |
| C | 0 | 47423 | 104 |
| D | 0 | 52133 | 109 |
| Mode M9 | |||
|---|---|---|---|
| Quadrant | BADHDUFLAG | Total packets | Discarded packets |
| A | 0 | 23 | 0 |
| B | 0 | 23 | 0 |
| C | 0 | 23 | 0 |
| D | 0 | 23 | 0 |
| Quadrant | Total seconds | Saturated seconds | Saturation percentage |
|---|---|---|---|
| A | 23085 | 413 | 1.789041% |
| B | 23086 | 366 | 1.585376% |
| C | 23086 | 247 | 1.069913% |
| D | 23087 | 587 | 2.542556% |
Noise dominated data is calculated using 1-second bins in cleaned event files. If a bin has >2000 counts, and if more than 50% of those come from <1% of pixels, then it is considered to be noise-dominated and hence unusable.
| Quadrant | # 1 sec bins | Bins with >0 counts | Bins with >2000 counts | High rate bins dominated by noise | Noise dominated (total time) | Noise dominated (detector-on time) | Marked lightcurve |
|---|---|---|---|---|---|---|---|
| A | 25366 | 23095 | 26 | 26 | 0.10% | 0.11% | 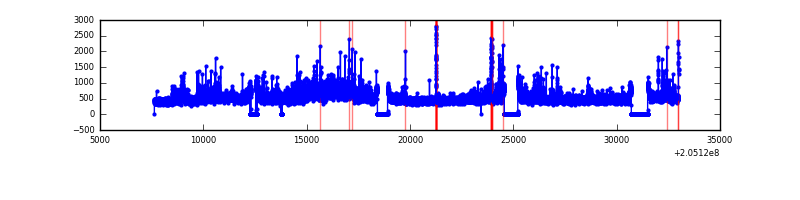 |
| B | 25365 | 23096 | 9 | 9 | 0.04% | 0.04% | 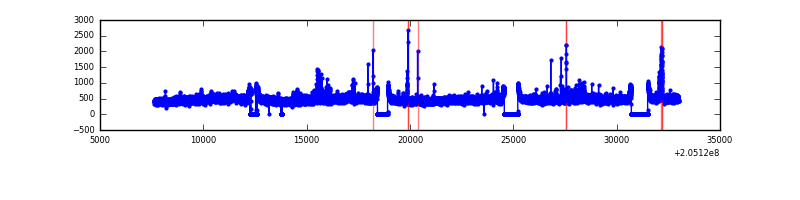 |
| C | 25365 | 23097 | 3 | 3 | 0.01% | 0.01% | 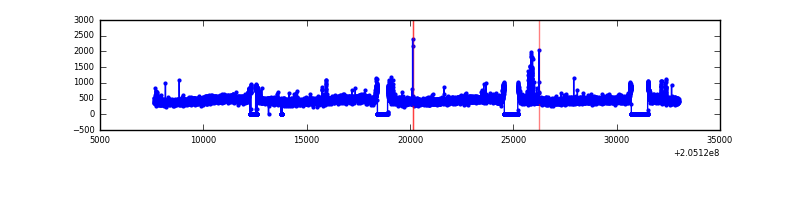 |
| D | 25365 | 23098 | 282 | 282 | 1.11% | 1.22% | 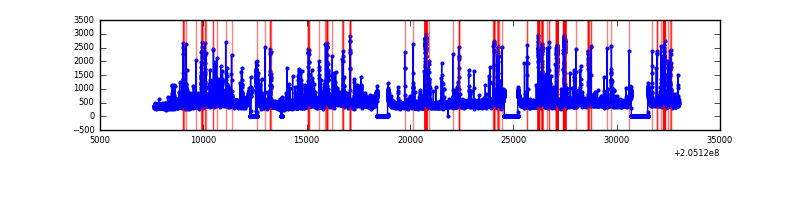 |
Top three noisy pixels from each quadrant. If the there are fewer than three noisy pixels in the level2.evt file, extra rows are filled as -1
| Pixel properties | Quadrant properties | ||||||
|---|---|---|---|---|---|---|---|
| Quadrant | DetID | PixID | Counts | Sigma | Mean | Median | Sigma |
| A | 0 | 199 | 1478947 | 2667.29 | 2715 | 2659 | 553.5 |
| A | 0 | 226 | 156729 | 278.37 | 2715 | 2659 | 553.5 |
| A | 0 | 50 | 105148 | 185.17 | 2715 | 2659 | 553.5 |
| B | 15 | 204 | 368722 | 698.21 | 2742 | 2682 | 524.3 |
| B | 7 | 252 | 97427 | 180.72 | 2742 | 2682 | 524.3 |
| B | 3 | 0 | 61996 | 113.14 | 2742 | 2682 | 524.3 |
| C | 9 | 144 | 133874 | 214.44 | 2643 | 2664 | 611.9 |
| C | 10 | 65 | 27872 | 41.2 | 2643 | 2664 | 611.9 |
| C | 8 | 128 | 27343 | 40.33 | 2643 | 2664 | 611.9 |
| D | 2 | 37 | 620628 | 982.78 | 2613 | 2540 | 628.9 |
| D | 13 | 239 | 616092 | 975.56 | 2613 | 2540 | 628.9 |
| D | 13 | 46 | 494542 | 782.3 | 2613 | 2540 | 628.9 |
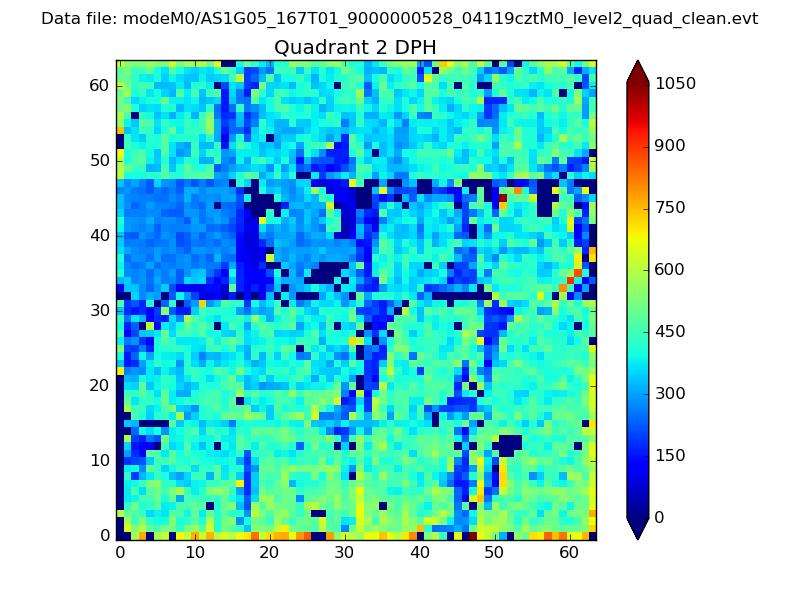
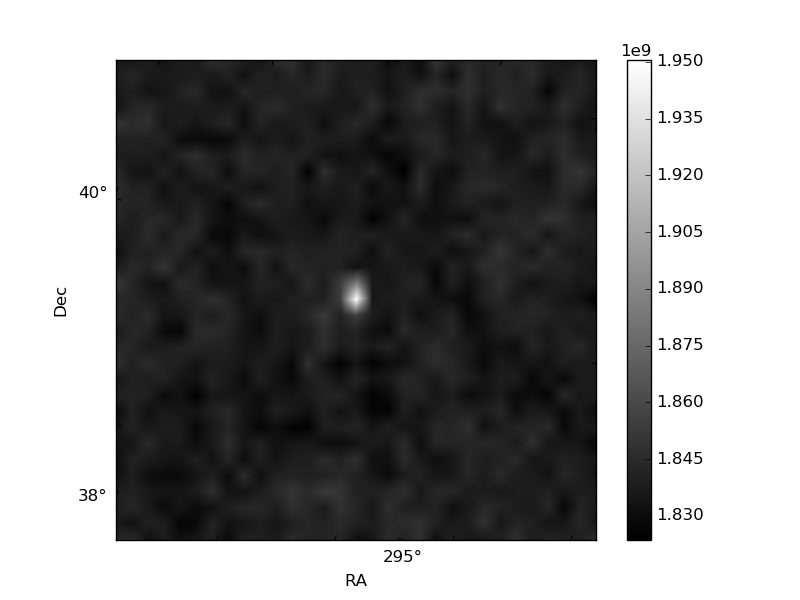
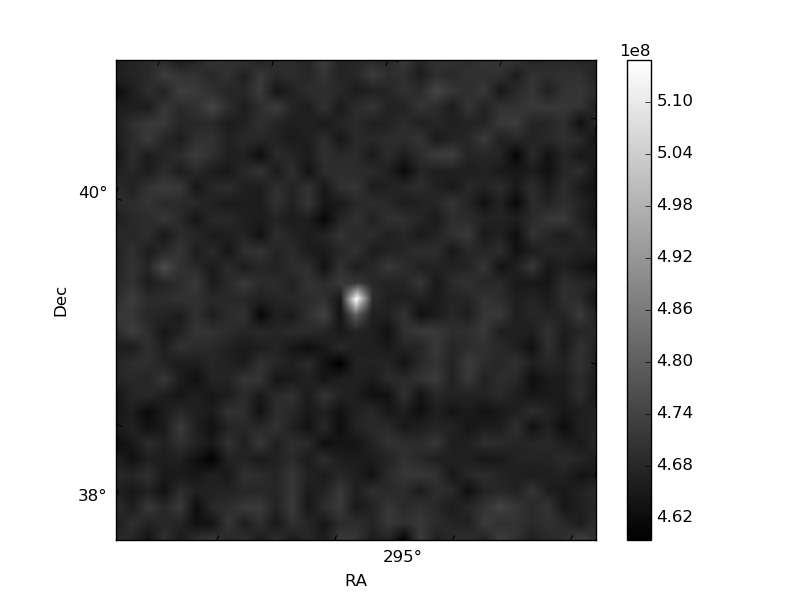
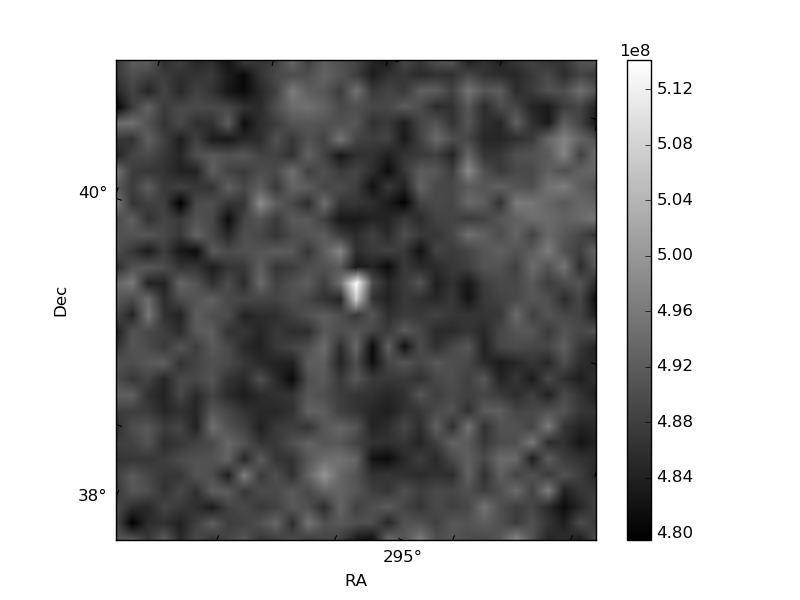
Histogram calculated using DETX and DETY for each event in the final _common_clean file
| Quadrant A | 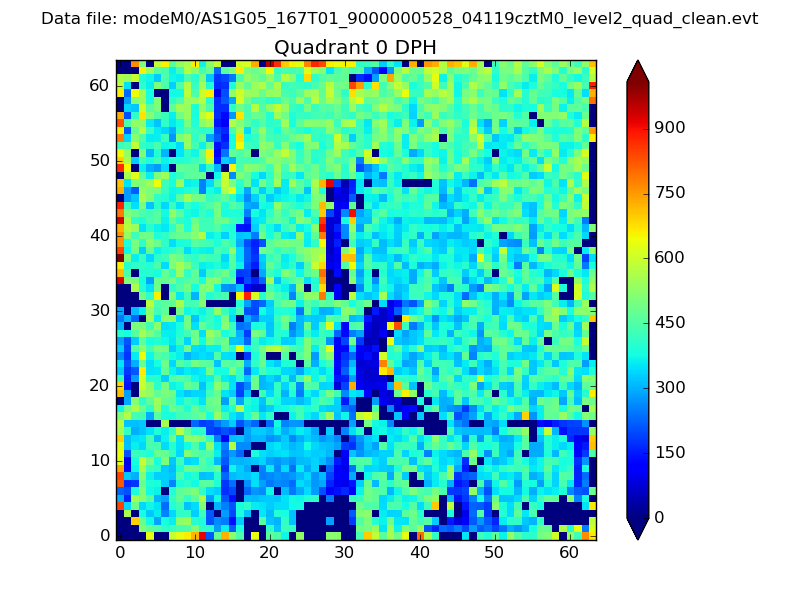 |
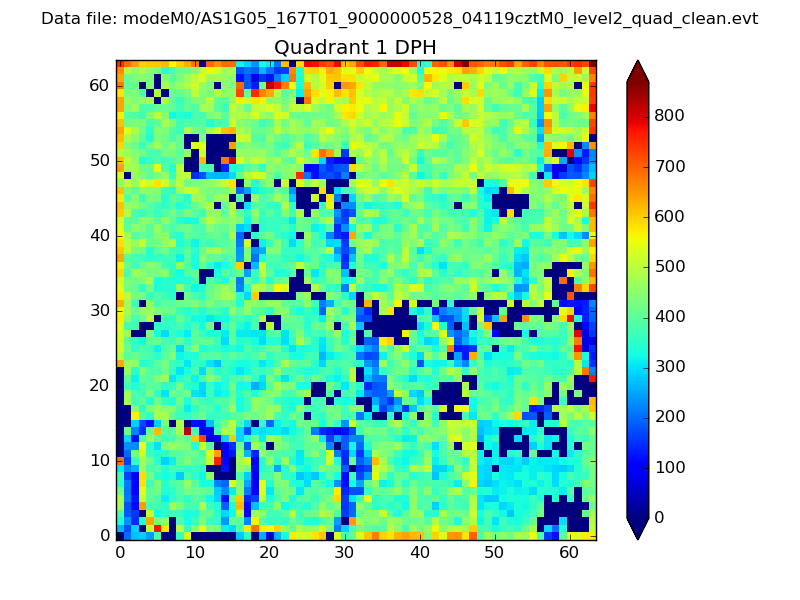 |
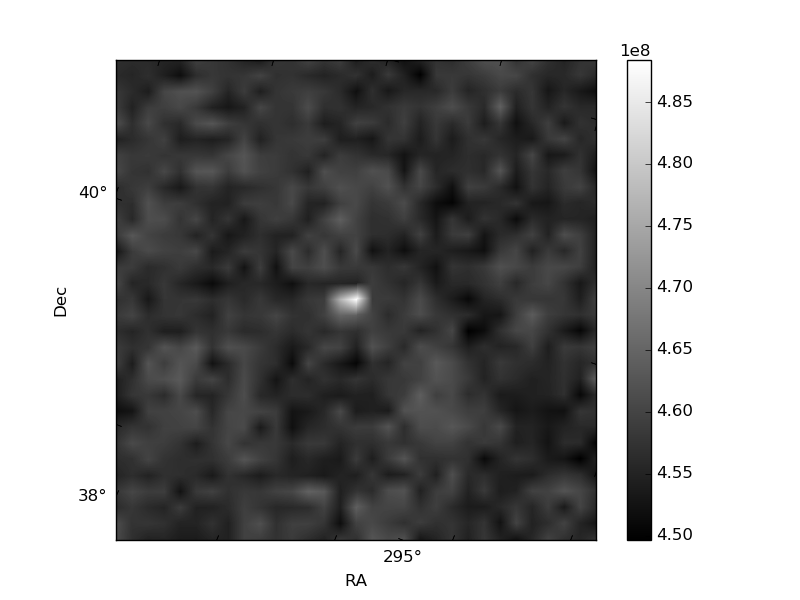
Quadrant B |
|---|---|---|---|
| Quadrant D | 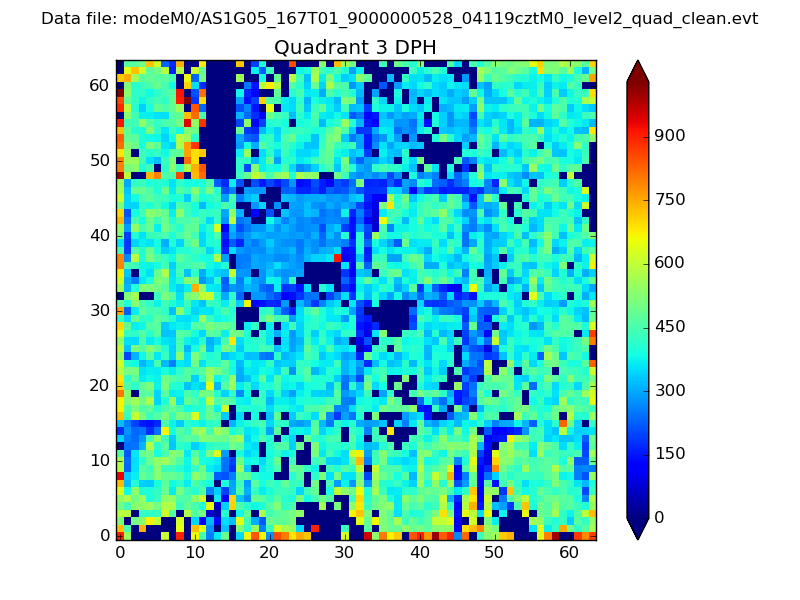 |
 |
Quadrant C |
| Plot type | Count rate plots | Images |
|---|---|---|
| Comparison with Poisson distribution Blue bars denote a histogram of data divided into 1 sec bins. Red curve is a Poisson curve with rate = median count rate of data. |
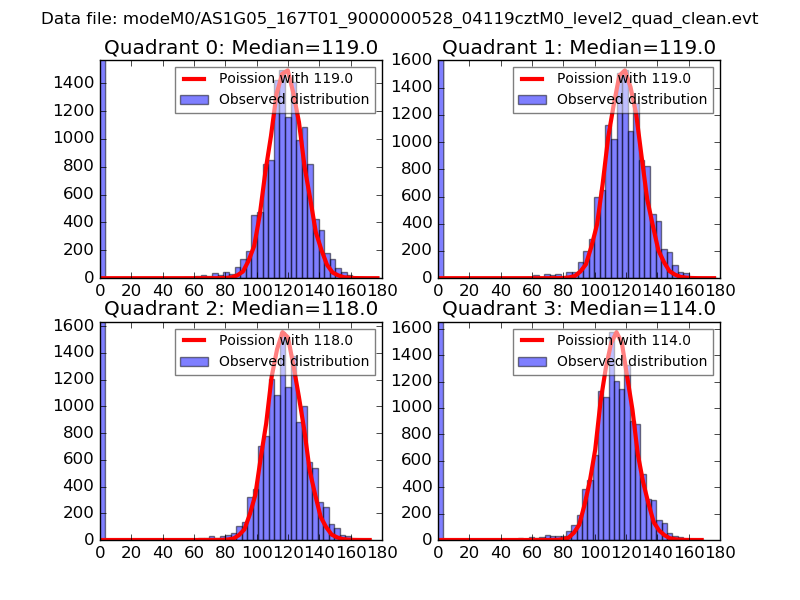 |
 |
| Quadrant-wise count rates Data is divided into 100 sec bins |
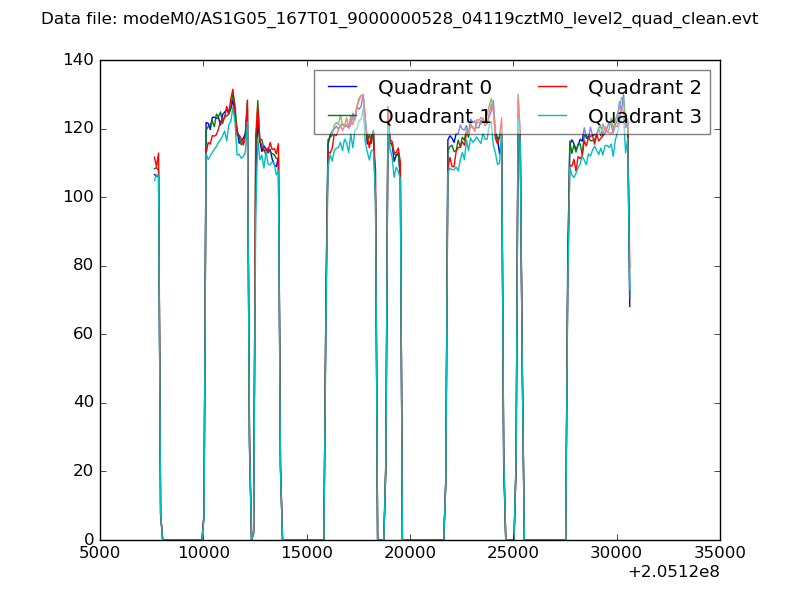 |
|
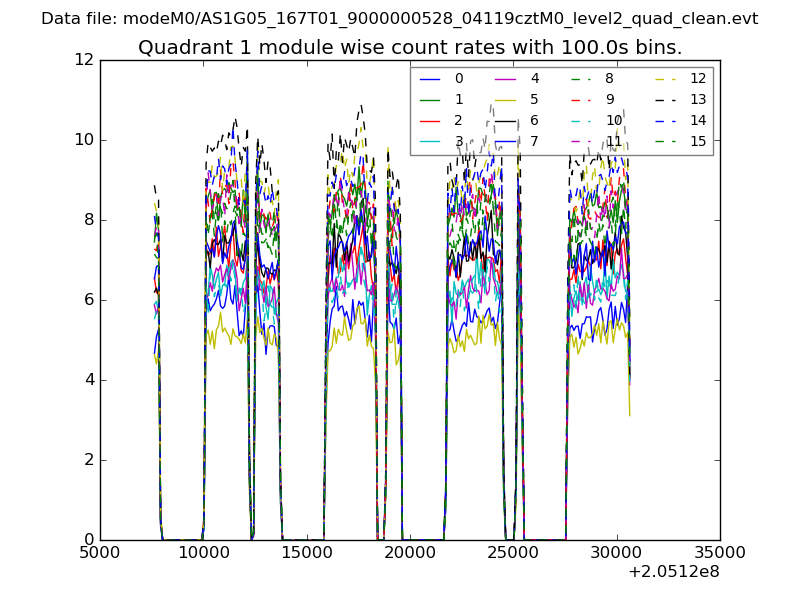
| Module-wise count rates for Quadrant A Data is divided into 100 sec bins |
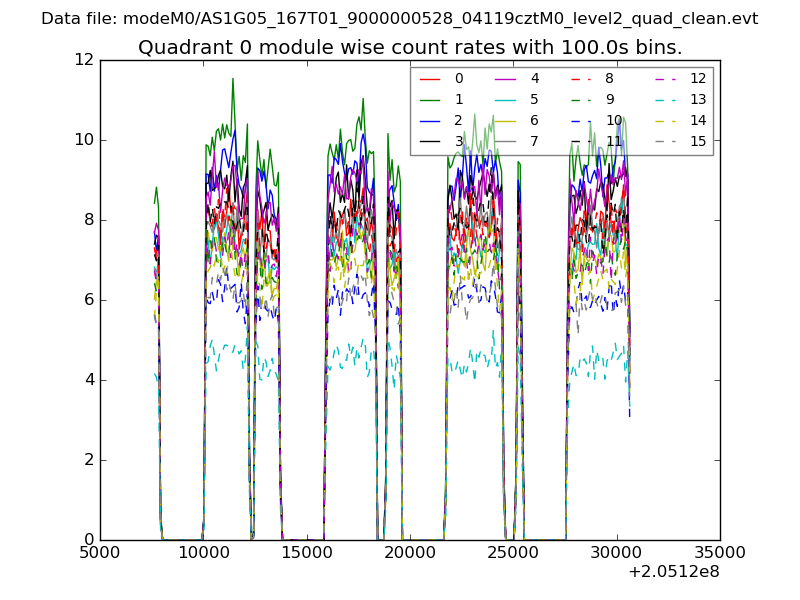 |
 |
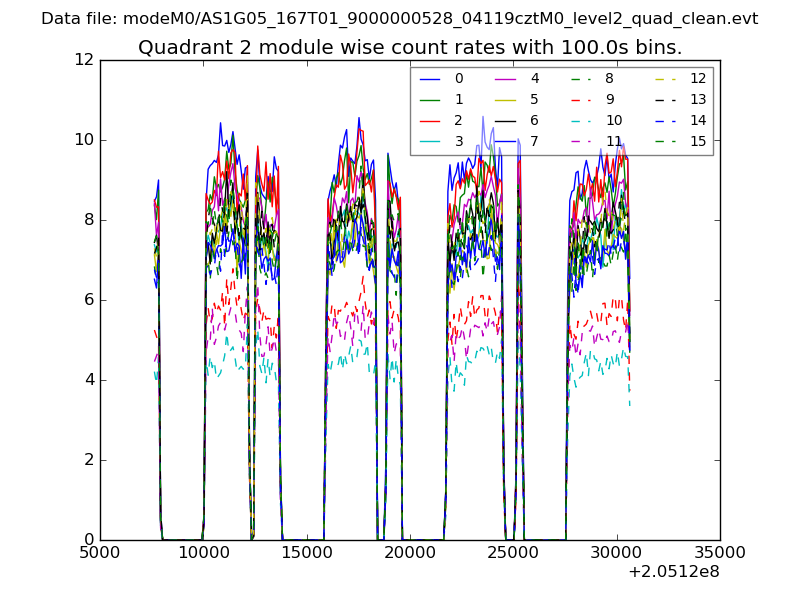
| Module-wise count rates for Quadrant B Data is divided into 100 sec bins |
 |
 |
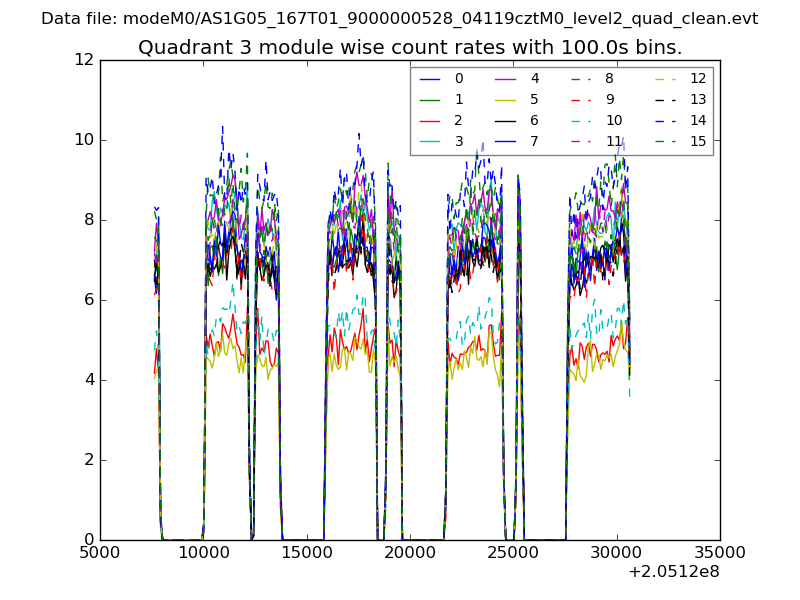
| Module-wise count rates for Quadrant C Data is divided into 100 sec bins |
 |
 |
| Module-wise count rates for Quadrant D Data is divided into 100 sec bins |
 |
 |
| Parameter | Plot |
|---|---|
| CZT HV Monitor | 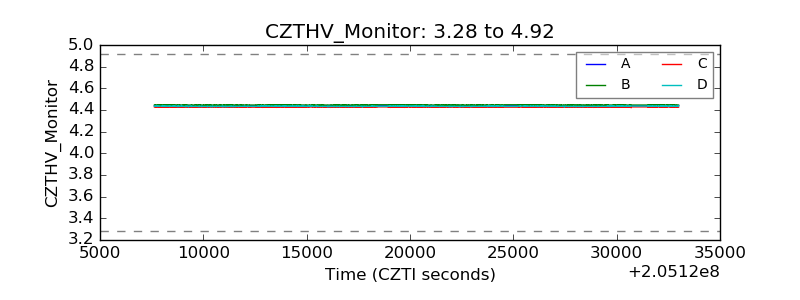 |
| D_VDD | 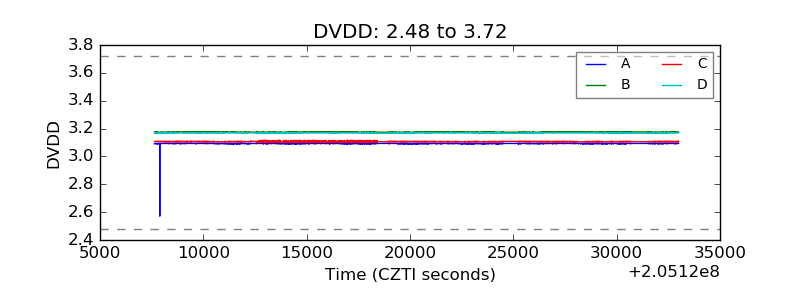 |
| Temperature 1 | 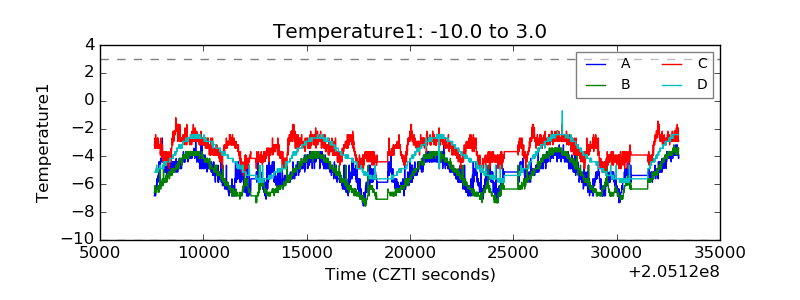 |
| Veto HV Monitor | 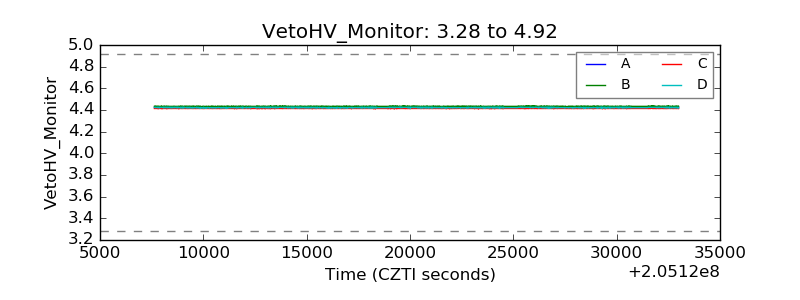 |
| Veto LLD | 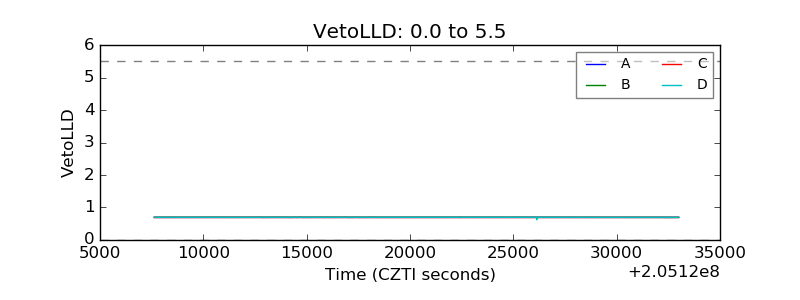 |
| Alpha Counter | 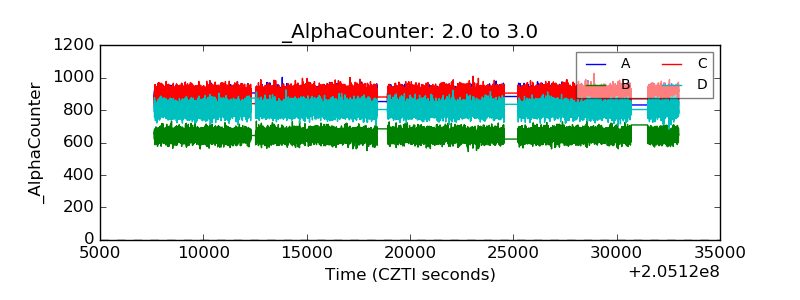 |
| _CPM_Rate | 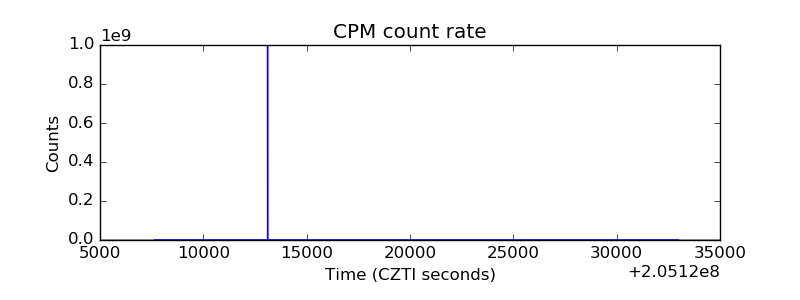 |
| CZT Counter | 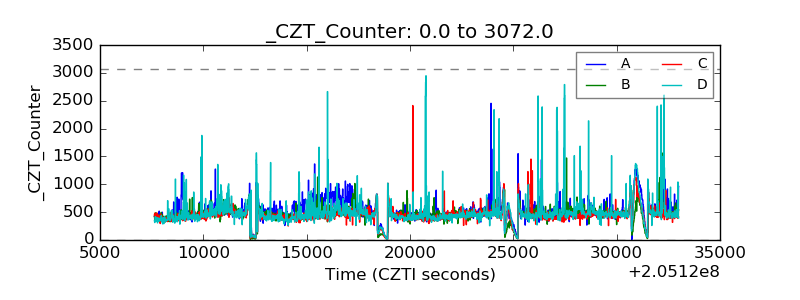 |
| +2.5 Volts monitor |  |
| +5 Volts monitor |  |
| _ROLL_ROT | 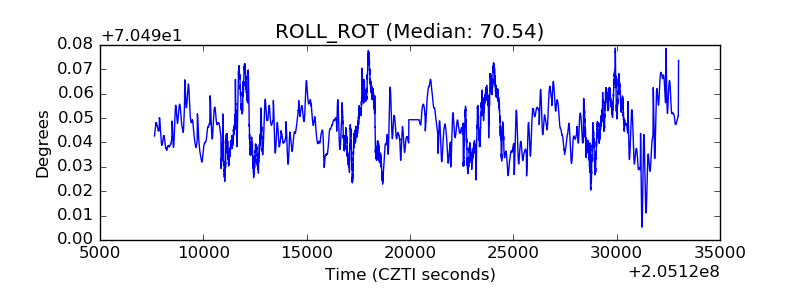 |
| _Roll_DEC | 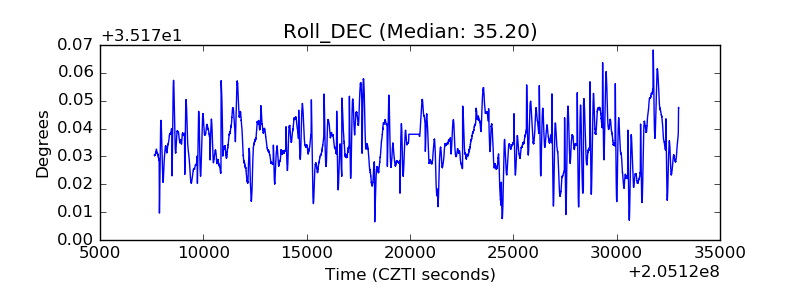 |
| _Roll_RA | 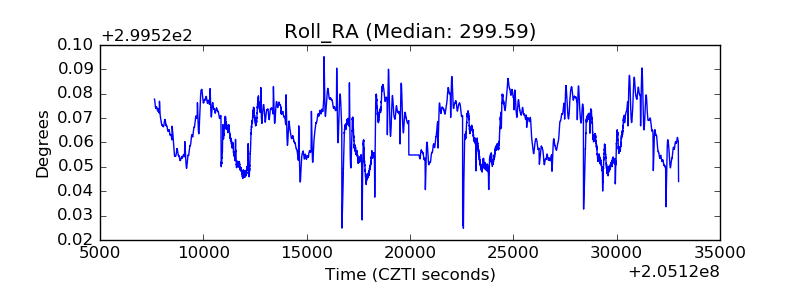 |
| Veto Counter | 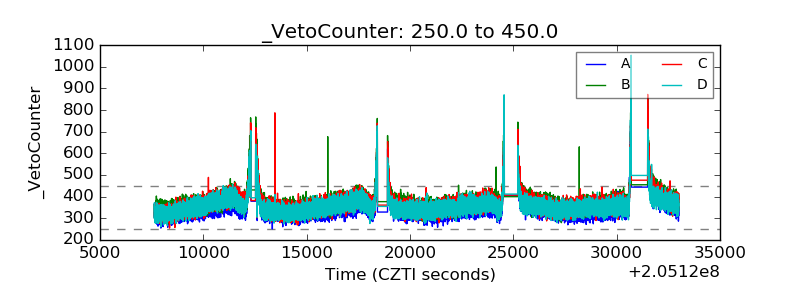 |