| Param | Original file | Final file |
|---|---|---|
| Filename | modeM0/AS1G05_167T01_9000000528_04120cztM0_level2.evt | modeM0/AS1G05_167T01_9000000528_04120cztM0_level2_quad_clean.evt |
| Size (bytes) | 368,789,760 | 63,460,800 |
| Size | 351.7 MB | 60.5 MB |
| Events in quadrant A | 2,696,998 | 395,064 |
| Events in quadrant B | 2,822,911 | 390,164 |
| Events in quadrant C | 2,518,849 | 386,955 |
| Events in quadrant D | 2,766,635 | 375,573 |
| Mode SS | |||
|---|---|---|---|
| Quadrant | BADHDUFLAG | Total packets | Discarded packets |
| A | 0 | 108 | 0 |
| B | 0 | 108 | 0 |
| C | 0 | 108 | 0 |
| D | 0 | 108 | 0 |
| Mode M0 | |||
|---|---|---|---|
| Quadrant | BADHDUFLAG | Total packets | Discarded packets |
| A | 0 | 11411 | 0 |
| B | 0 | 11599 | 0 |
| C | 0 | 11163 | 0 |
| D | 0 | 11764 | 0 |
| Mode M9 | |||
|---|---|---|---|
| Quadrant | BADHDUFLAG | Total packets | Discarded packets |
| A | 0 | 14 | 0 |
| B | 0 | 14 | 0 |
| C | 0 | 14 | 0 |
| D | 0 | 14 | 0 |
| Quadrant | Total seconds | Saturated seconds | Saturation percentage |
|---|---|---|---|
| A | 5340 | 96 | 1.797753% |
| B | 5340 | 101 | 1.891386% |
| C | 5340 | 80 | 1.498127% |
| D | 5340 | 110 | 2.059925% |
Noise dominated data is calculated using 1-second bins in cleaned event files. If a bin has >2000 counts, and if more than 50% of those come from <1% of pixels, then it is considered to be noise-dominated and hence unusable.
| Quadrant | # 1 sec bins | Bins with >0 counts | Bins with >2000 counts | High rate bins dominated by noise | Noise dominated (total time) | Noise dominated (detector-on time) | Marked lightcurve |
|---|---|---|---|---|---|---|---|
| A | 5340 | 5340 | 5 | 5 | 0.09% | 0.09% | 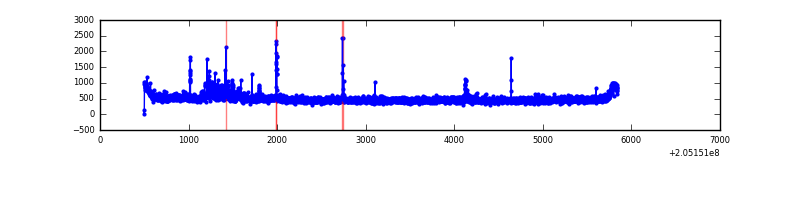 |
| B | 5340 | 5340 | 3 | 3 | 0.06% | 0.06% | 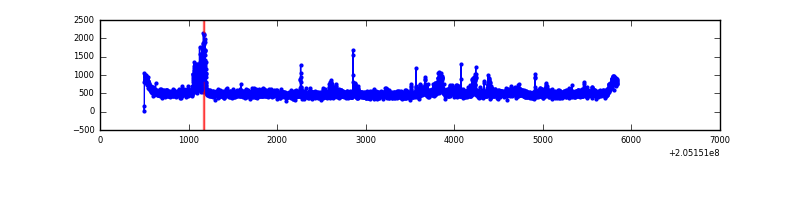 |
| C | 5340 | 5340 | 8 | 8 | 0.15% | 0.15% | 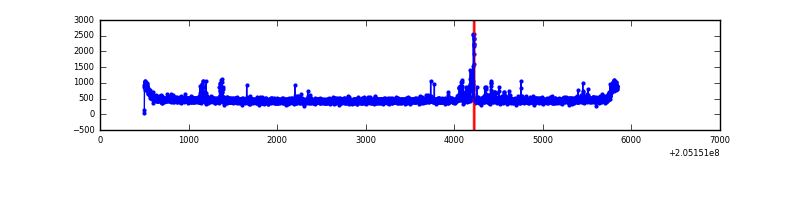 |
| D | 5340 | 5340 | 34 | 34 | 0.64% | 0.64% | 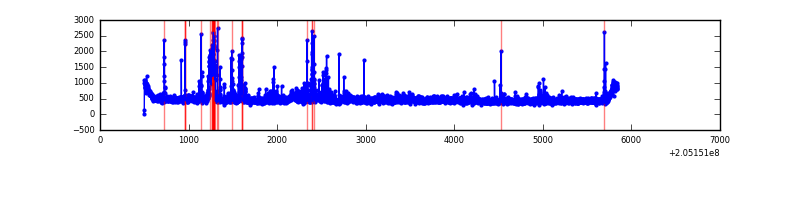 |
Top three noisy pixels from each quadrant. If the there are fewer than three noisy pixels in the level2.evt file, extra rows are filled as -1
| Pixel properties | Quadrant properties | ||||||
|---|---|---|---|---|---|---|---|
| Quadrant | DetID | PixID | Counts | Sigma | Mean | Median | Sigma |
| A | 0 | 199 | 178468 | 1359.48 | 633 | 621 | 130.8 |
| A | 14 | 111 | 26310 | 196.37 | 633 | 621 | 130.8 |
| A | 0 | 226 | 21731 | 161.37 | 633 | 621 | 130.8 |
| B | 15 | 204 | 236895 | 1909.77 | 638 | 624 | 123.7 |
| B | 7 | 252 | 89029 | 714.58 | 638 | 624 | 123.7 |
| B | 12 | 111 | 11126 | 84.89 | 638 | 624 | 123.7 |
| C | 9 | 144 | 105172 | 717.97 | 616 | 620 | 145.6 |
| C | 10 | 65 | 5400 | 32.82 | 616 | 620 | 145.6 |
| C | 13 | 61 | 5190 | 31.38 | 616 | 620 | 145.6 |
| D | 2 | 37 | 229259 | 1537.8 | 613 | 594 | 148.7 |
| D | 12 | 233 | 80284 | 535.92 | 613 | 594 | 148.7 |
| D | 13 | 239 | 68448 | 456.33 | 613 | 594 | 148.7 |
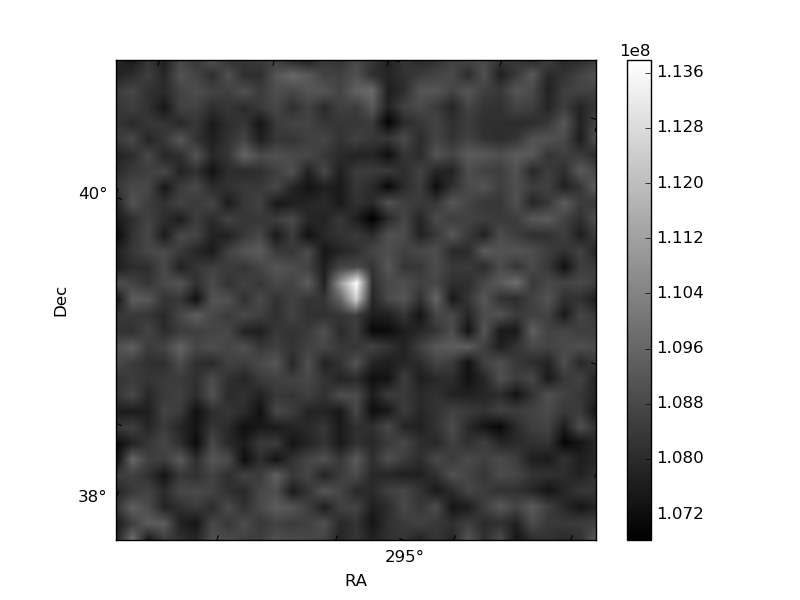
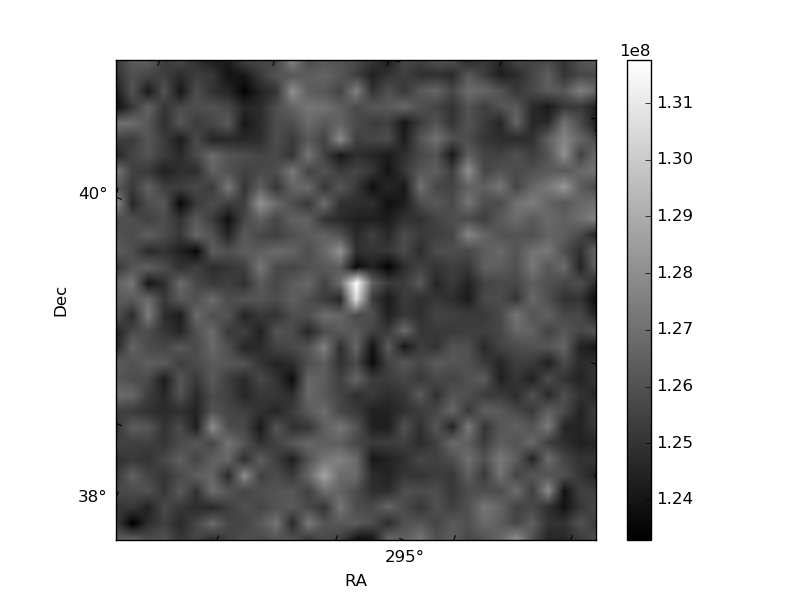
Histogram calculated using DETX and DETY for each event in the final _common_clean file
| Quadrant A | 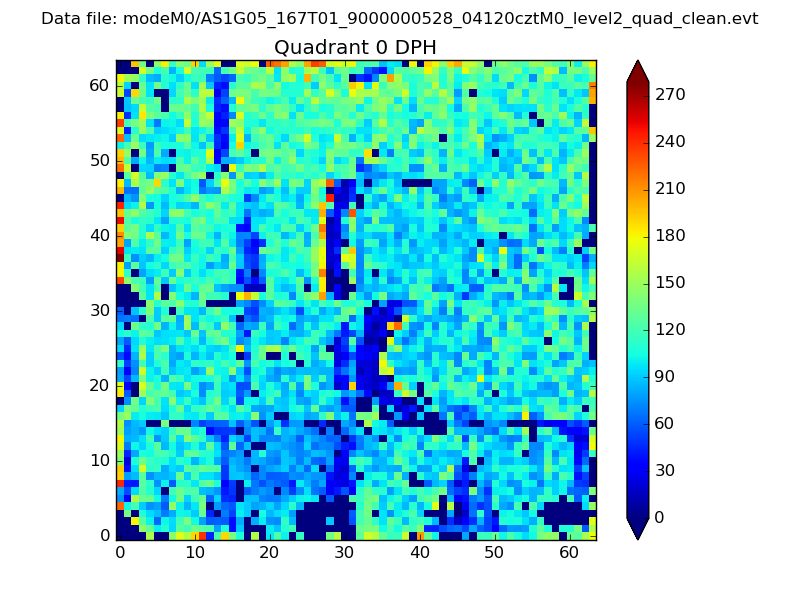 |
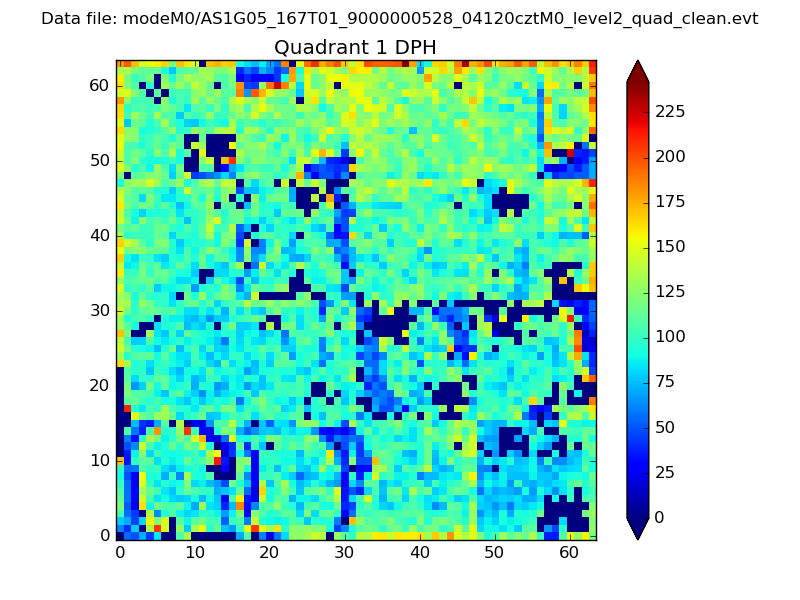 |
Quadrant B |
|---|---|---|---|
| Quadrant D | 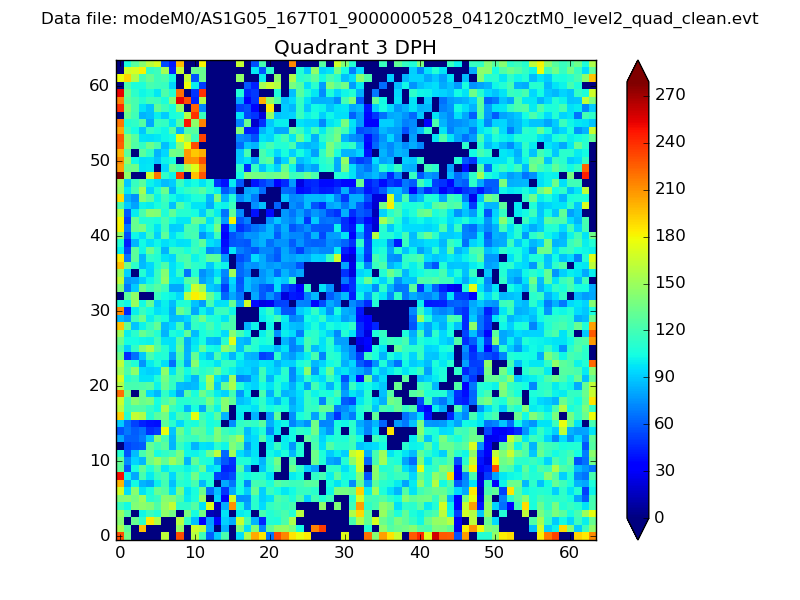 |
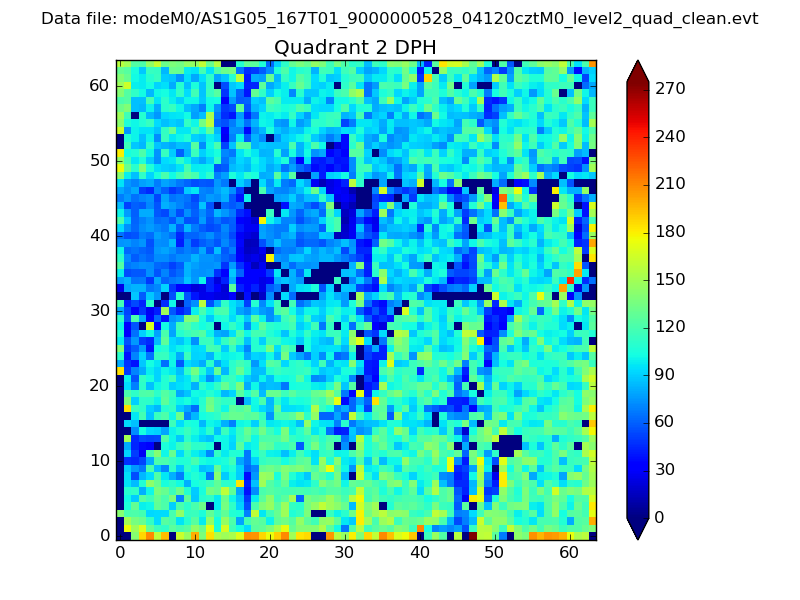 |
Quadrant C |
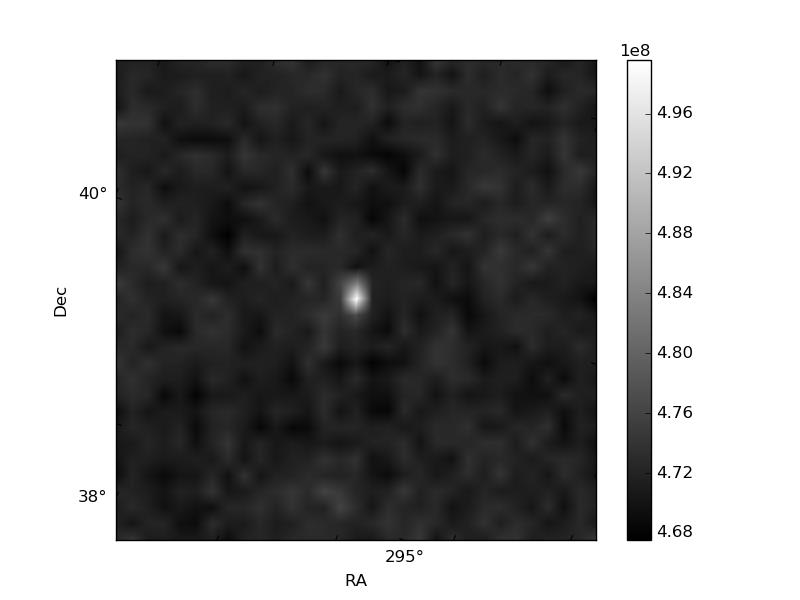
| Plot type | Count rate plots | Images |
|---|---|---|
| Comparison with Poisson distribution Blue bars denote a histogram of data divided into 1 sec bins. Red curve is a Poisson curve with rate = median count rate of data. |
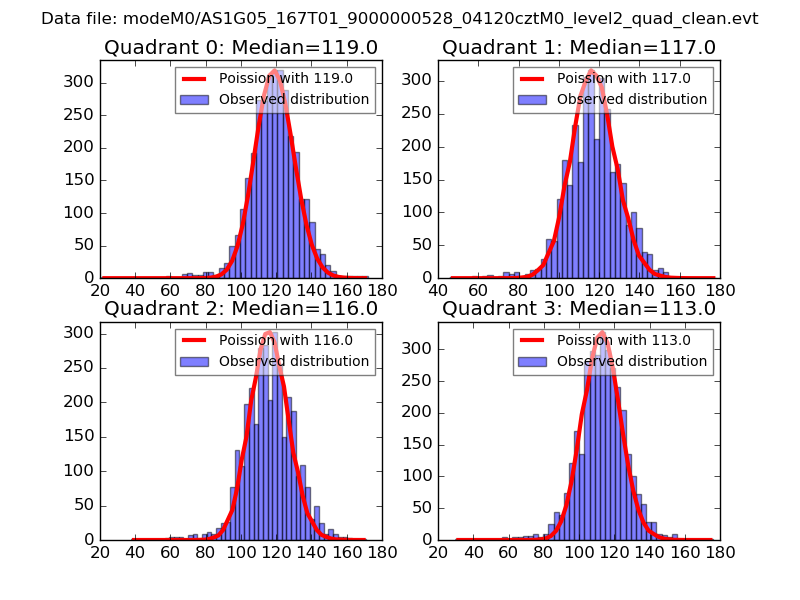 |
 |
| Quadrant-wise count rates Data is divided into 100 sec bins |
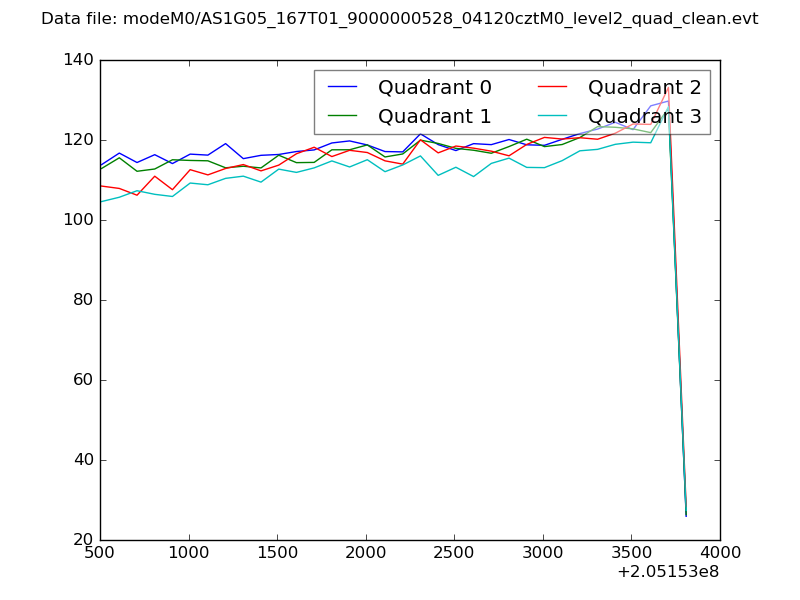 |
|
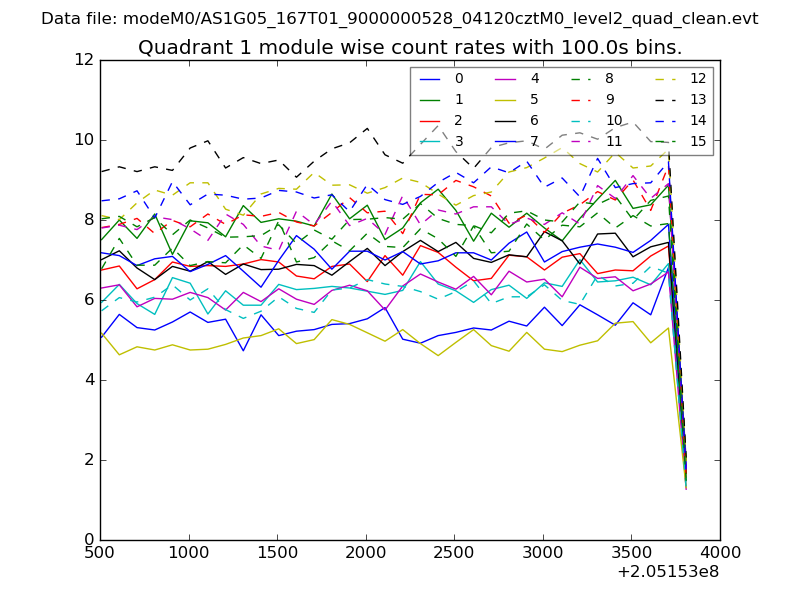
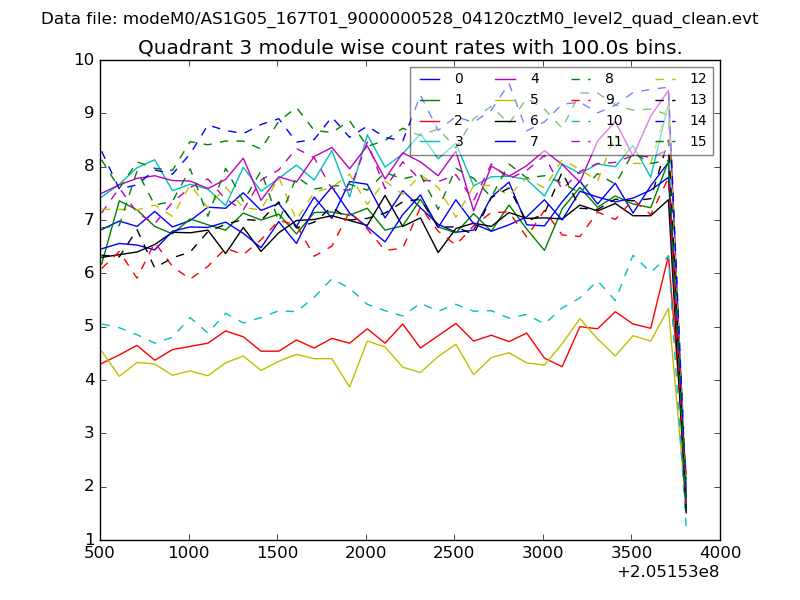
| Module-wise count rates for Quadrant A Data is divided into 100 sec bins |
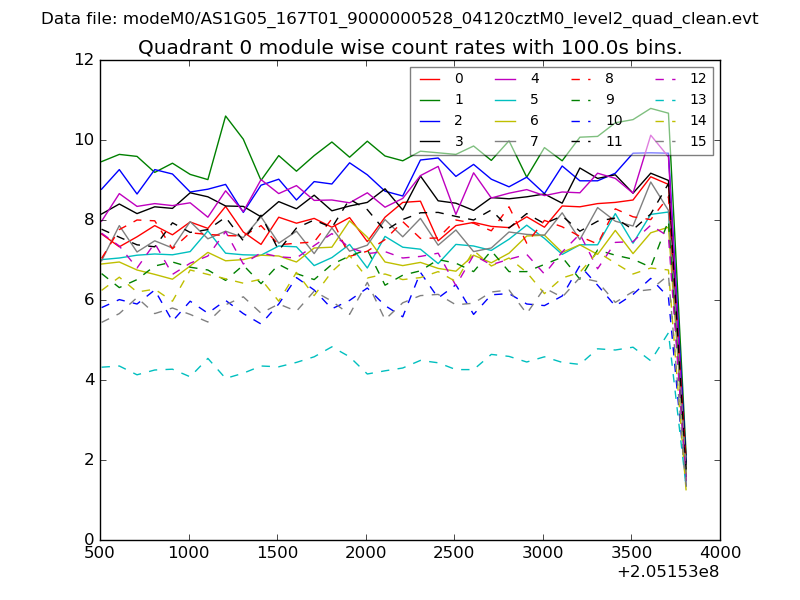 |
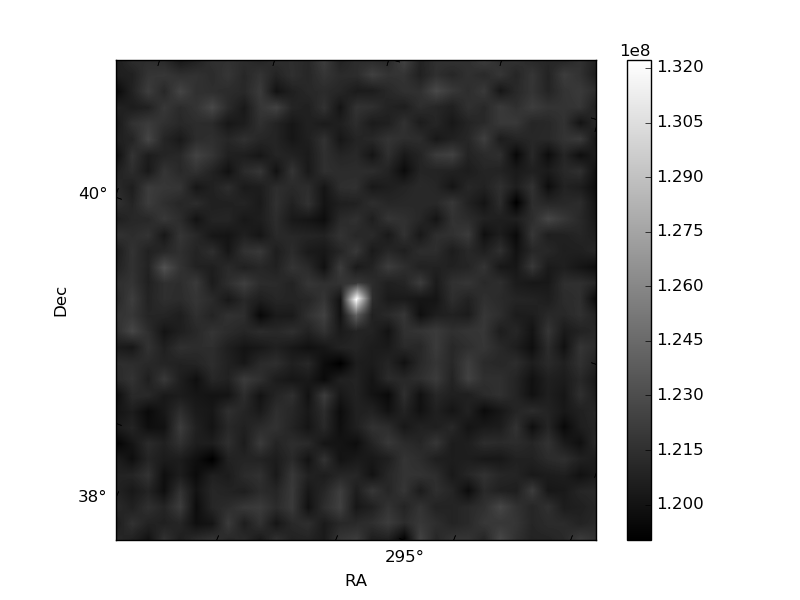 |
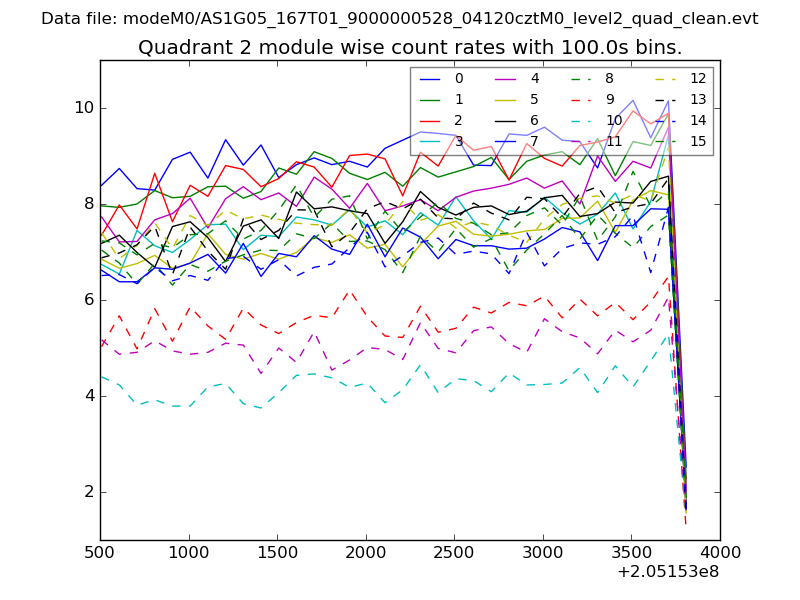
| Module-wise count rates for Quadrant B Data is divided into 100 sec bins |
 |
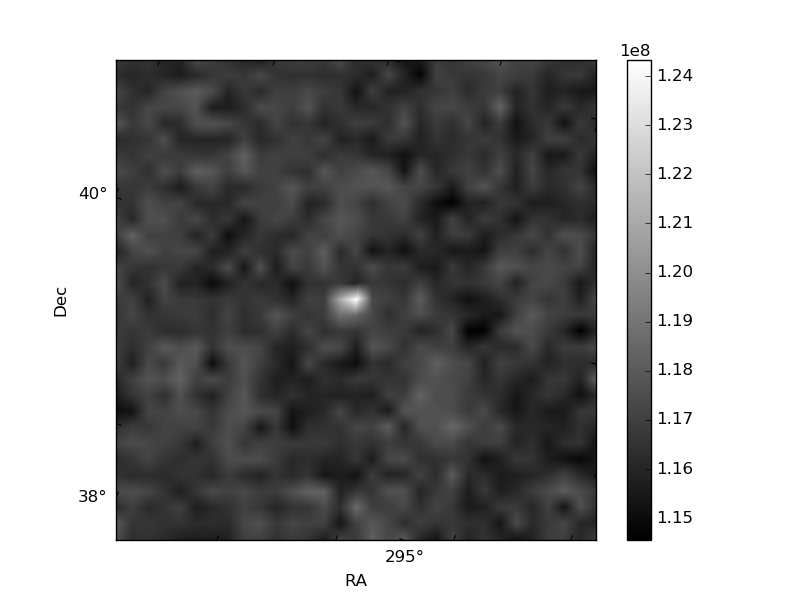 |
| Module-wise count rates for Quadrant C Data is divided into 100 sec bins |
 |
 |
| Module-wise count rates for Quadrant D Data is divided into 100 sec bins |
 |
 |
| Parameter | Plot |
|---|---|
| CZT HV Monitor | 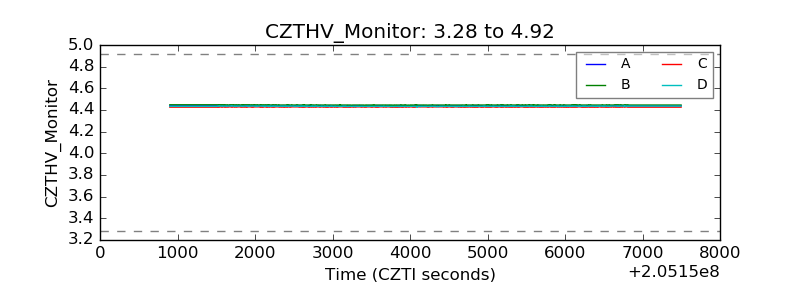 |
| D_VDD | 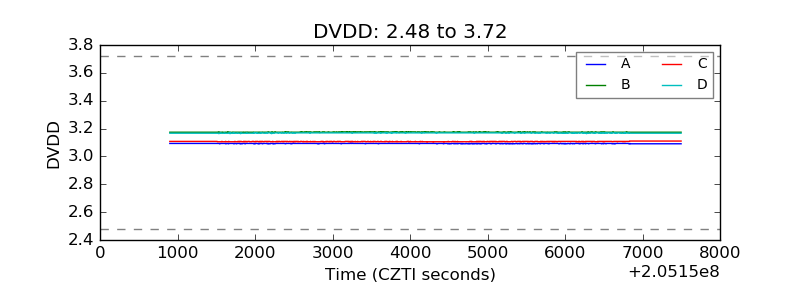 |
| Temperature 1 | 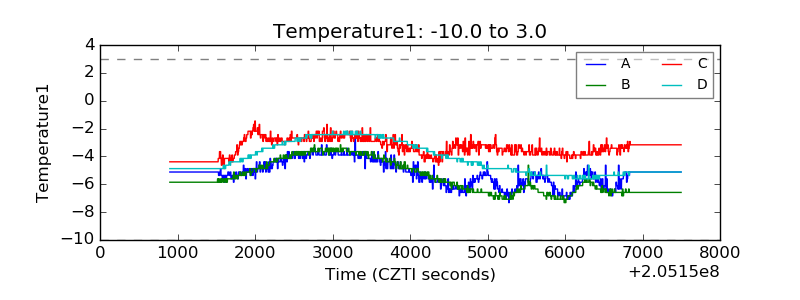 |
| Veto HV Monitor | 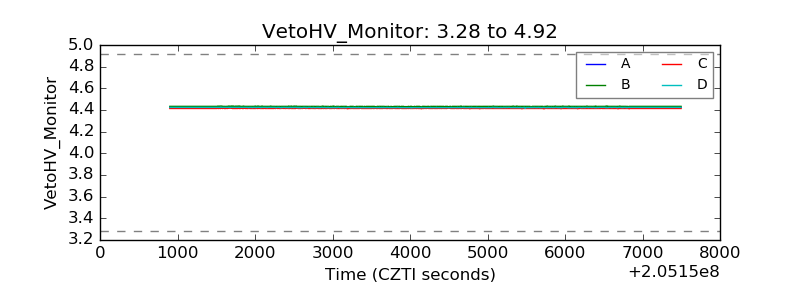 |
| Veto LLD | 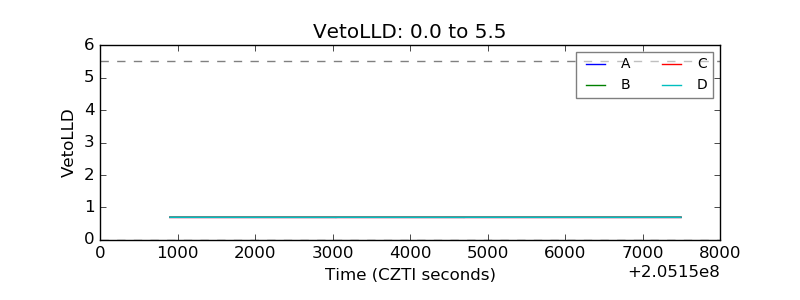 |
| Alpha Counter | 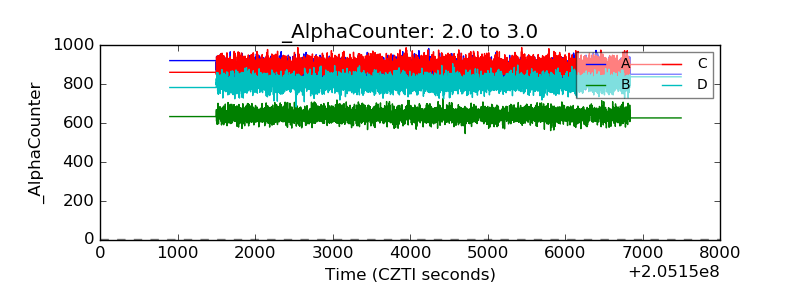 |
| _CPM_Rate | 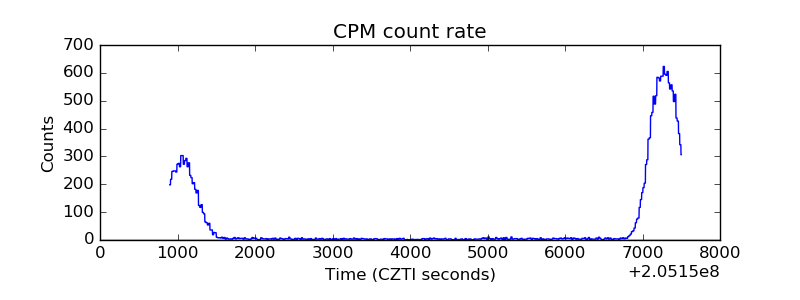 |
| CZT Counter | 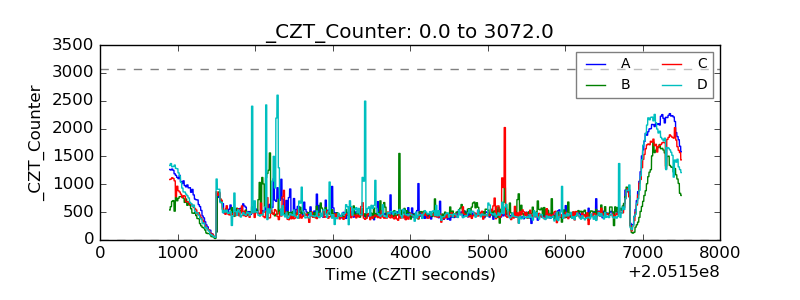 |
| +2.5 Volts monitor |  |
| +5 Volts monitor |  |
| _ROLL_ROT |  |
| _Roll_DEC | 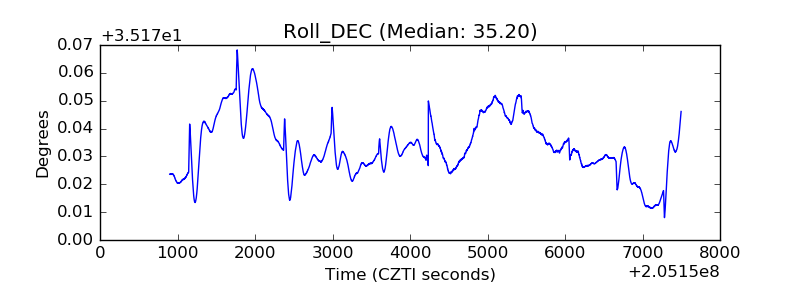 |
| _Roll_RA | 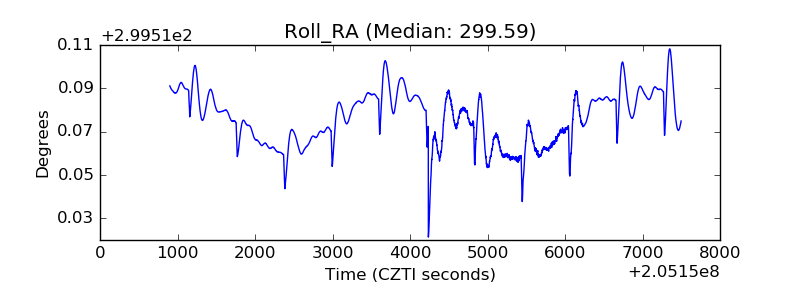 |
| Veto Counter | 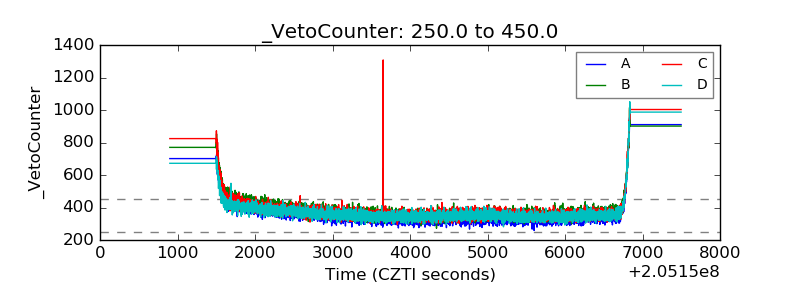 |