| Param | Original file | Final file |
|---|---|---|
| Filename | modeM0/AS1G05_195T01_9000000530cztM0_level2.fits | modeM0/AS1G05_195T01_9000000530cztM0_level2_quad_clean.evt |
| Size (bytes) | 605,761,920 | 598,417,920 |
| Size | 577.7 MB | 570.7 MB |
| Events in quadrant A | 3,630,792 | 3,589,355 |
| Events in quadrant B | 3,451,086 | 3,536,098 |
| Events in quadrant C | 3,594,818 | 3,435,211 |
| Events in quadrant D | 2,962,146 | 2,861,419 |
| Mode SS | |||
|---|---|---|---|
| Quadrant | BADHDUFLAG | Total packets | Discarded packets |
| A | 0 | 1402 | 0 |
| B | 0 | 1400 | 0 |
| C | 0 | 1394 | 0 |
| D | 0 | 1398 | 0 |
| Mode M0 | |||
|---|---|---|---|
| Quadrant | BADHDUFLAG | Total packets | Discarded packets |
| A | 0 | 155318 | 0 |
| B | 0 | 169713 | 0 |
| C | 0 | 144070 | 0 |
| D | 0 | 198015 | 0 |
| Mode M9 | |||
|---|---|---|---|
| Quadrant | BADHDUFLAG | Total packets | Discarded packets |
| A | 0 | 105 | 0 |
| B | 0 | 104 | 0 |
| C | 0 | 103 | 0 |
| D | 0 | 107 | 0 |
| Quadrant | Total seconds | Saturated seconds | Saturation percentage |
|---|---|---|---|
| A | 68502 | 1663 | 2.427666% |
| B | 68498 | 3221 | 4.702327% |
| C | 68540 | 803 | 1.171579% |
| D | 68497 | 8297 | 12.112939% |
Noise dominated data is calculated using 1-second bins in cleaned event files. If a bin has >2000 counts, and if more than 50% of those come from <1% of pixels, then it is considered to be noise-dominated and hence unusable.
| Quadrant | # 1 sec bins | Bins with >0 counts | Bins with >2000 counts | High rate bins dominated by noise | Noise dominated (total time) | Noise dominated (detector-on time) | Marked lightcurve |
|---|---|---|---|---|---|---|---|
| A | 80939 | 68546 | 0 | 0 | 0.00% | 0.00% |  |
| B | 80939 | 68491 | 0 | 0 | 0.00% | 0.00% |  |
| C | 80938 | 68632 | 0 | 0 | 0.00% | 0.00% |  |
| D | 80938 | 68550 | 0 | 0 | 0.00% | 0.00% |  |
Top three noisy pixels from each quadrant. If the there are fewer than three noisy pixels in the level2.evt file, extra rows are filled as -1
| Pixel properties | Quadrant properties | ||||||
|---|---|---|---|---|---|---|---|
| Quadrant | DetID | PixID | Counts | Sigma | Mean | Median | Sigma |
| A | 14 | 188 | 3667 | 11.45 | 943 | 882 | 243.3 |
| A | 0 | 29 | 3536 | 10.91 | 943 | 882 | 243.3 |
| A | 14 | 204 | 3129 | 9.24 | 943 | 882 | 243.3 |
| B | 2 | 9 | 3058 | 11.95 | 912 | 867 | 183.4 |
| B | 12 | 226 | 2542 | 9.13 | 912 | 867 | 183.4 |
| B | 14 | 254 | 2356 | 8.12 | 912 | 867 | 183.4 |
| C | 1 | 80 | 2681 | 7.13 | 948 | 877 | 253.1 |
| C | 1 | 81 | 2662 | 7.05 | 948 | 877 | 253.1 |
| C | 12 | 241 | 2555 | 6.63 | 948 | 877 | 253.1 |
| D | 11 | 82 | 2572 | 7.89 | 844 | 765 | 229.0 |
| D | 4 | 160 | 2293 | 6.67 | 844 | 765 | 229.0 |
| D | 3 | 14 | 2253 | 6.5 | 844 | 765 | 229.0 |
Histogram calculated using DETX and DETY for each event in the final _common_clean file
| Quadrant A | 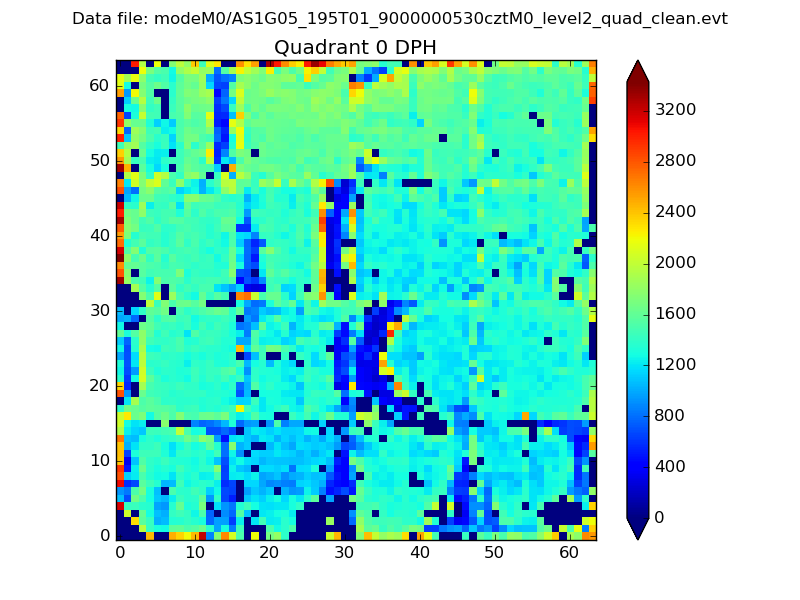 |
 |
Quadrant B |
|---|---|---|---|
| Quadrant D | 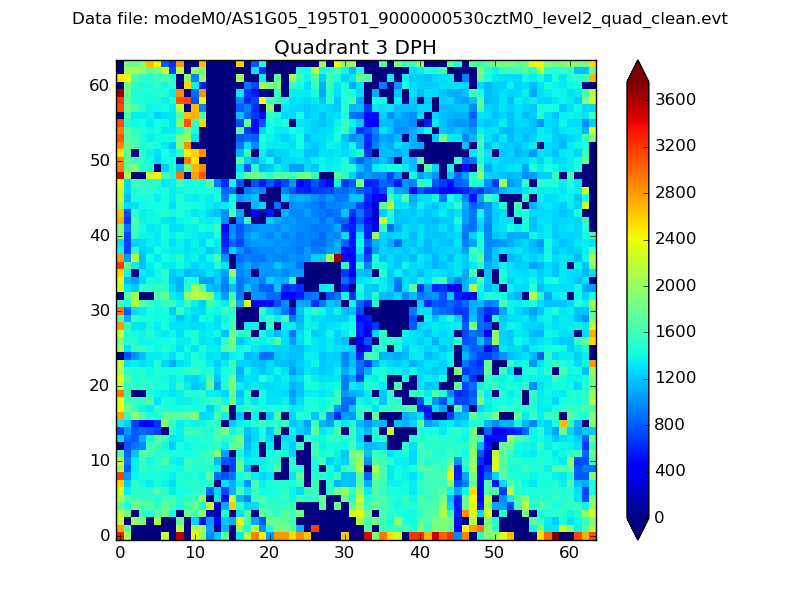 |
 |
Quadrant C |
| Plot type | Count rate plots | Images |
|---|---|---|
| Comparison with Poisson distribution Blue bars denote a histogram of data divided into 1 sec bins. Red curve is a Poisson curve with rate = median count rate of data. |
 |
 |
| Quadrant-wise count rates Data is divided into 100 sec bins |
 |
|
| Module-wise count rates for Quadrant A Data is divided into 100 sec bins |
 |
 |
| Module-wise count rates for Quadrant B Data is divided into 100 sec bins |
 |
 |
| Module-wise count rates for Quadrant C Data is divided into 100 sec bins |
 |
 |
| Module-wise count rates for Quadrant D Data is divided into 100 sec bins |
 |
 |
| Parameter | Plot |
|---|---|
| CZT HV Monitor |  |
| D_VDD |  |
| Temperature 1 |  |
| Veto HV Monitor |  |
| Veto LLD |  |
| Alpha Counter |  |
| _CPM_Rate |  |
| CZT Counter |  |
| +2.5 Volts monitor |  |
| +5 Volts monitor |  |
| _ROLL_ROT |  |
| _Roll_DEC |  |
| _Roll_RA |  |
| Veto Counter |  |