| Param | Original file | Final file |
|---|---|---|
| Filename | modeM0/AS1G05_195T01_9000000530_04122cztM0_level2.evt | modeM0/AS1G05_195T01_9000000530_04122cztM0_level2_quad_clean.evt |
| Size (bytes) | 403,545,600 | 79,721,280 |
| Size | 384.9 MB | 76.0 MB |
| Events in quadrant A | 2,820,583 | 518,718 |
| Events in quadrant B | 3,070,473 | 512,749 |
| Events in quadrant C | 3,150,026 | 501,533 |
| Events in quadrant D | 2,810,541 | 500,757 |
| Mode SS | |||
|---|---|---|---|
| Quadrant | BADHDUFLAG | Total packets | Discarded packets |
| A | 0 | 110 | 0 |
| B | 0 | 110 | 0 |
| C | 0 | 110 | 0 |
| D | 0 | 110 | 0 |
| Mode M0 | |||
|---|---|---|---|
| Quadrant | BADHDUFLAG | Total packets | Discarded packets |
| A | 0 | 12057 | 2 |
| B | 0 | 12850 | 1 |
| C | 0 | 13480 | 1 |
| D | 0 | 12090 | 1 |
| Mode M9 | |||
|---|---|---|---|
| Quadrant | BADHDUFLAG | Total packets | Discarded packets |
| A | 0 | 10 | 0 |
| B | 0 | 10 | 0 |
| C | 0 | 10 | 0 |
| D | 0 | 10 | 0 |
| Quadrant | Total seconds | Saturated seconds | Saturation percentage |
|---|---|---|---|
| A | 5429 | 129 | 2.376128% |
| B | 5429 | 86 | 1.584085% |
| C | 5429 | 260 | 4.789096% |
| D | 5429 | 83 | 1.528827% |
Noise dominated data is calculated using 1-second bins in cleaned event files. If a bin has >2000 counts, and if more than 50% of those come from <1% of pixels, then it is considered to be noise-dominated and hence unusable.
| Quadrant | # 1 sec bins | Bins with >0 counts | Bins with >2000 counts | High rate bins dominated by noise | Noise dominated (total time) | Noise dominated (detector-on time) | Marked lightcurve |
|---|---|---|---|---|---|---|---|
| A | 6524 | 5430 | 51 | 51 | 0.78% | 0.94% | 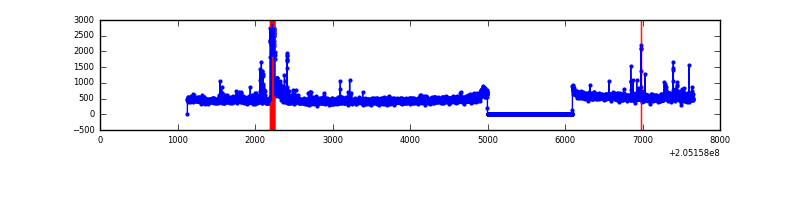 |
| B | 6524 | 5430 | 14 | 14 | 0.21% | 0.26% | 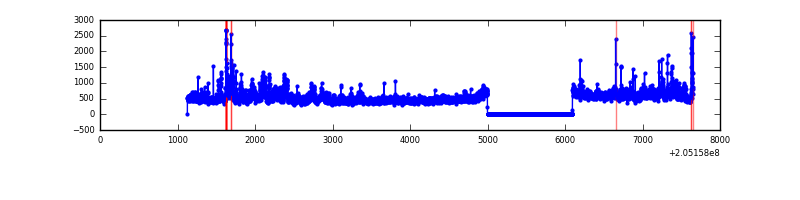 |
| C | 6524 | 5430 | 138 | 138 | 2.12% | 2.54% | 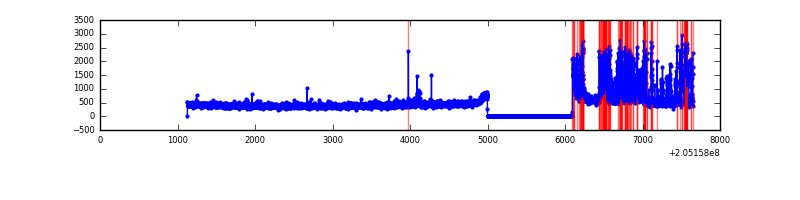 |
| D | 6524 | 5430 | 20 | 20 | 0.31% | 0.37% | 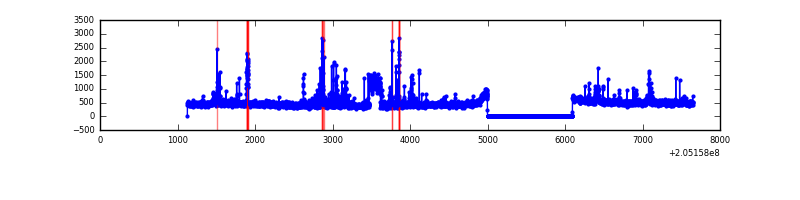 |
Top three noisy pixels from each quadrant. If the there are fewer than three noisy pixels in the level2.evt file, extra rows are filled as -1
| Pixel properties | Quadrant properties | ||||||
|---|---|---|---|---|---|---|---|
| Quadrant | DetID | PixID | Counts | Sigma | Mean | Median | Sigma |
| A | 15 | 234 | 191151 | 1470.37 | 626 | 613 | 129.6 |
| A | 0 | 199 | 131831 | 1012.6 | 626 | 613 | 129.6 |
| A | 0 | 118 | 27022 | 203.8 | 626 | 613 | 129.6 |
| B | 15 | 204 | 450651 | 3742.88 | 629 | 615 | 120.2 |
| B | 10 | 16 | 39791 | 325.82 | 629 | 615 | 120.2 |
| B | 4 | 48 | 37018 | 302.76 | 629 | 615 | 120.2 |
| C | 9 | 144 | 816480 | 5923.08 | 593 | 596 | 137.7 |
| C | 13 | 61 | 4947 | 31.59 | 593 | 596 | 137.7 |
| C | 14 | 67 | 4385 | 27.51 | 593 | 596 | 137.7 |
| D | 2 | 37 | 353059 | 2439.27 | 601 | 584 | 144.5 |
| D | 10 | 172 | 66892 | 458.88 | 601 | 584 | 144.5 |
| D | 13 | 239 | 55286 | 378.56 | 601 | 584 | 144.5 |
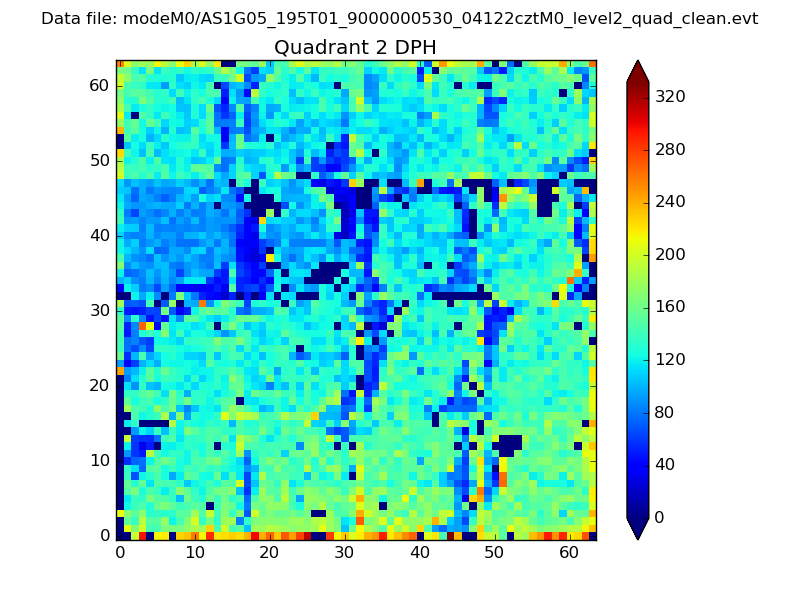
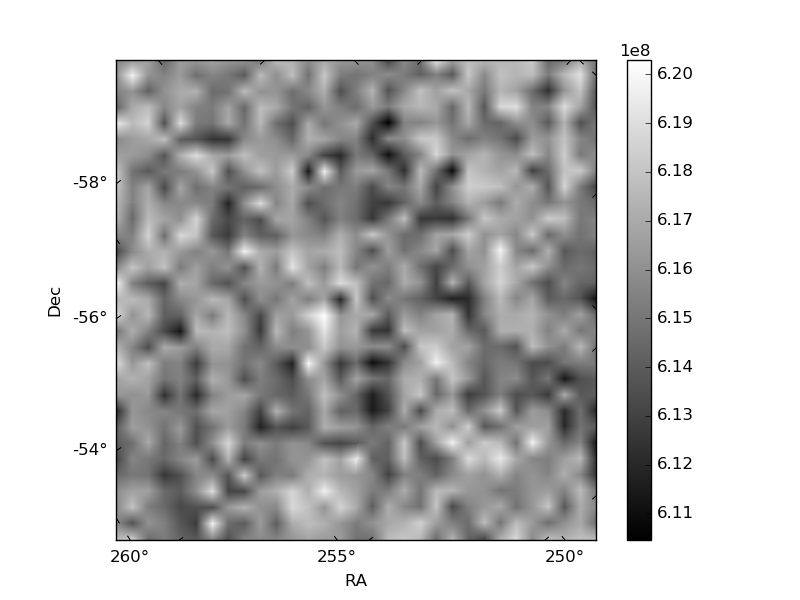
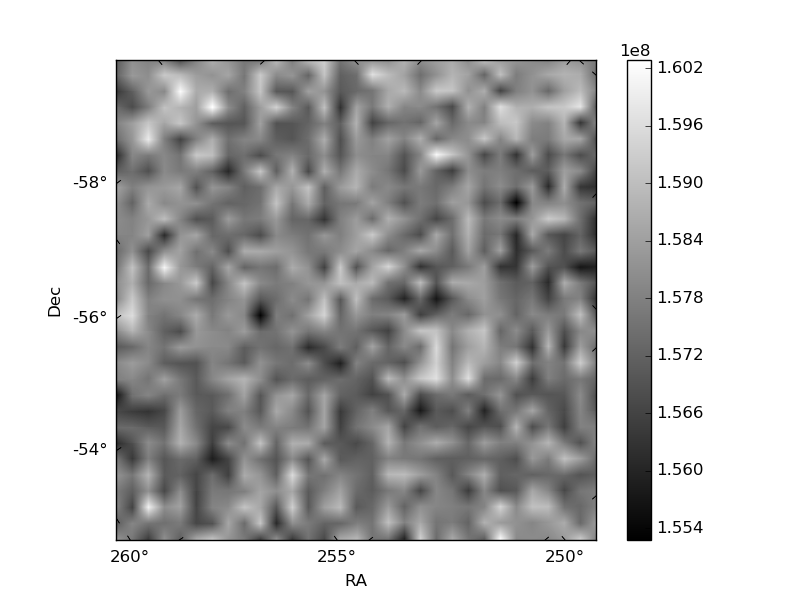
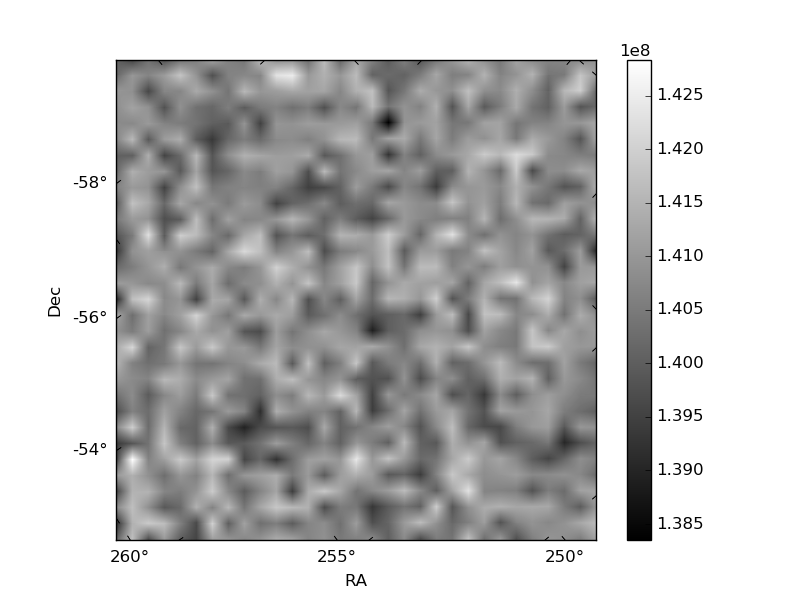
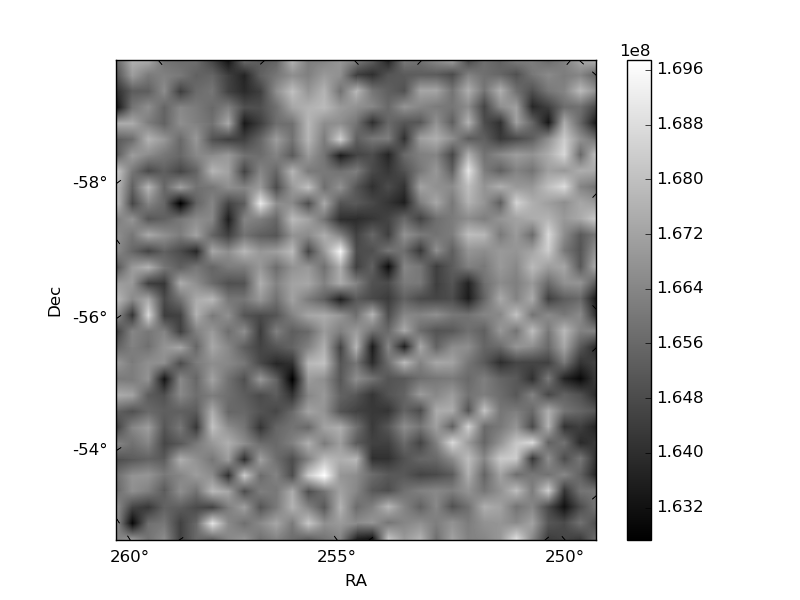
Histogram calculated using DETX and DETY for each event in the final _common_clean file
| Quadrant A | 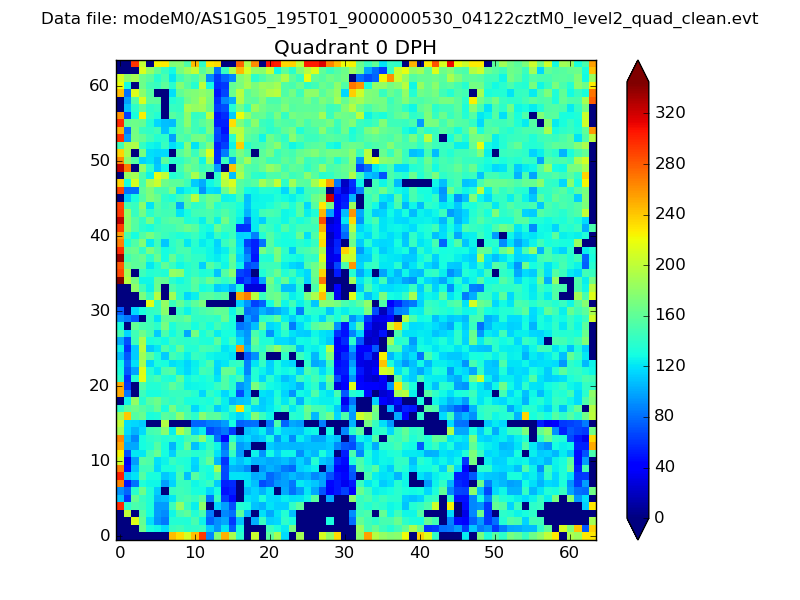 |
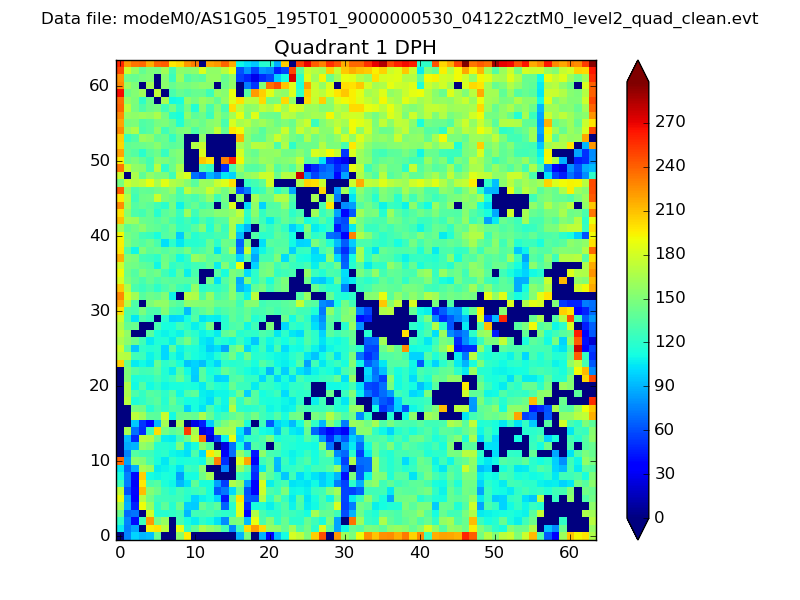 |
Quadrant B |
|---|---|---|---|
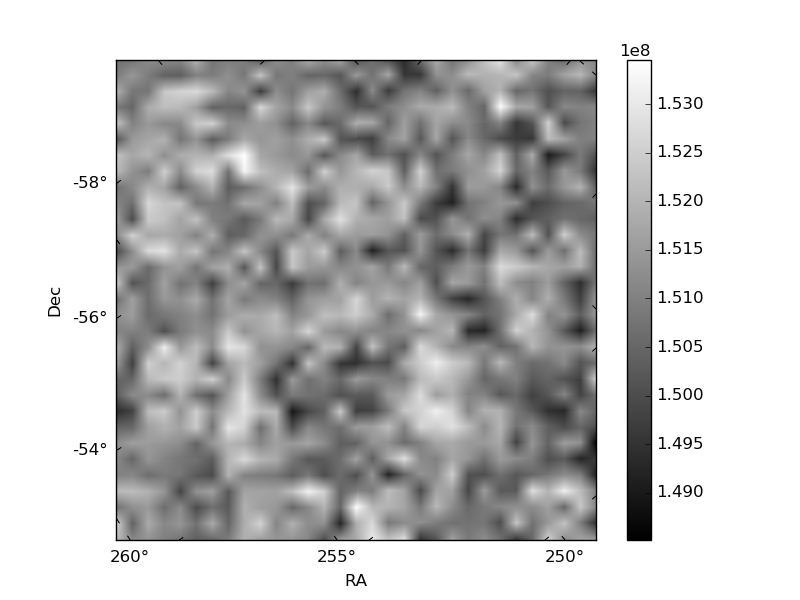
| Quadrant D | 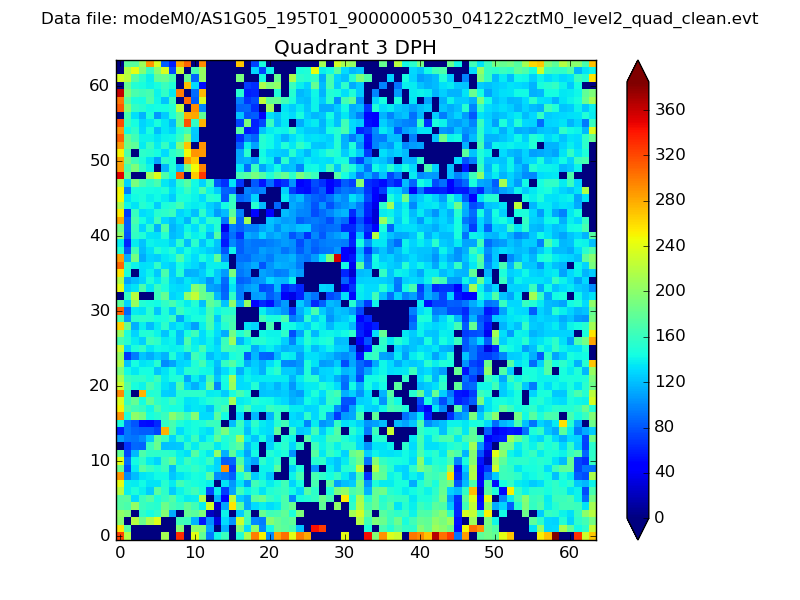 |
 |
Quadrant C |
| Plot type | Count rate plots | Images |
|---|---|---|
| Comparison with Poisson distribution Blue bars denote a histogram of data divided into 1 sec bins. Red curve is a Poisson curve with rate = median count rate of data. |
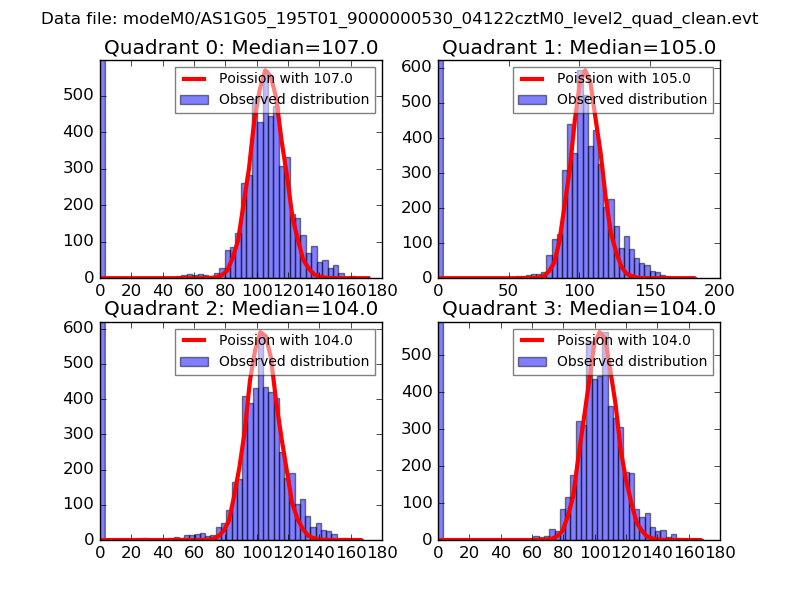 |
 |
| Quadrant-wise count rates Data is divided into 100 sec bins |
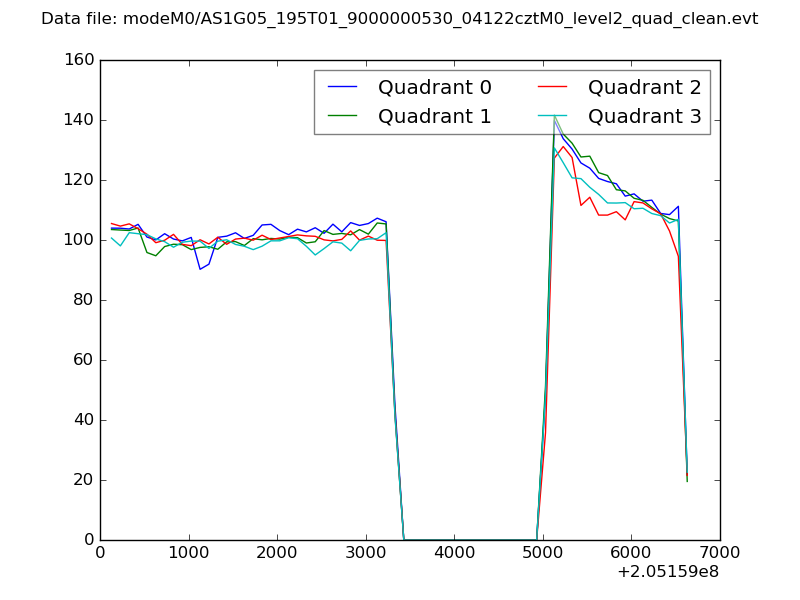 |
|
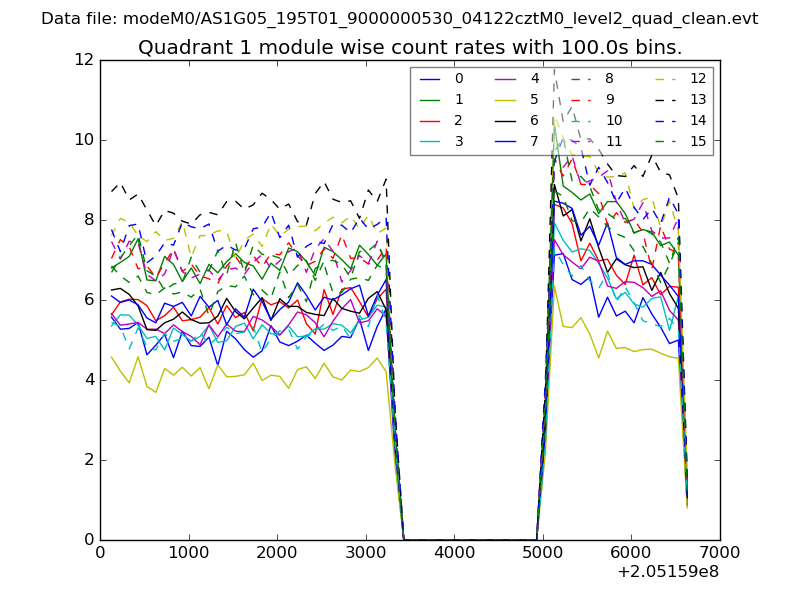
| Module-wise count rates for Quadrant A Data is divided into 100 sec bins |
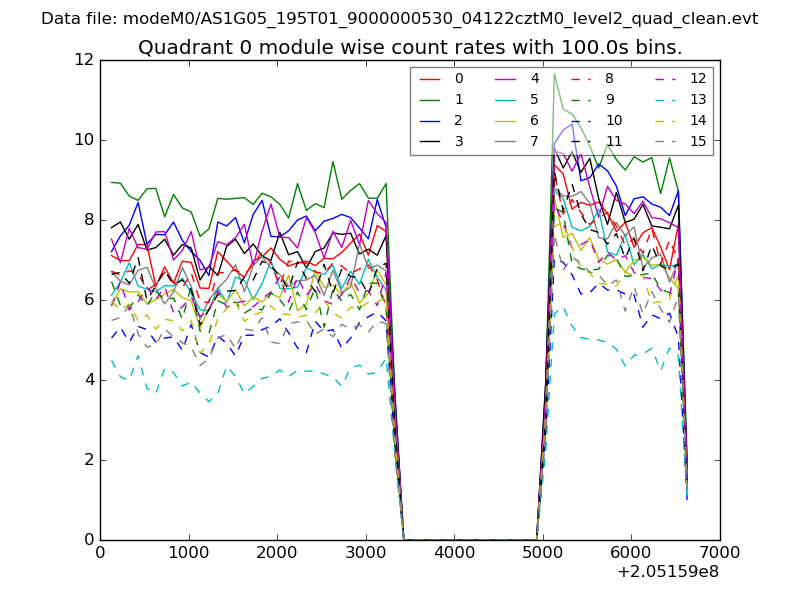 |
 |
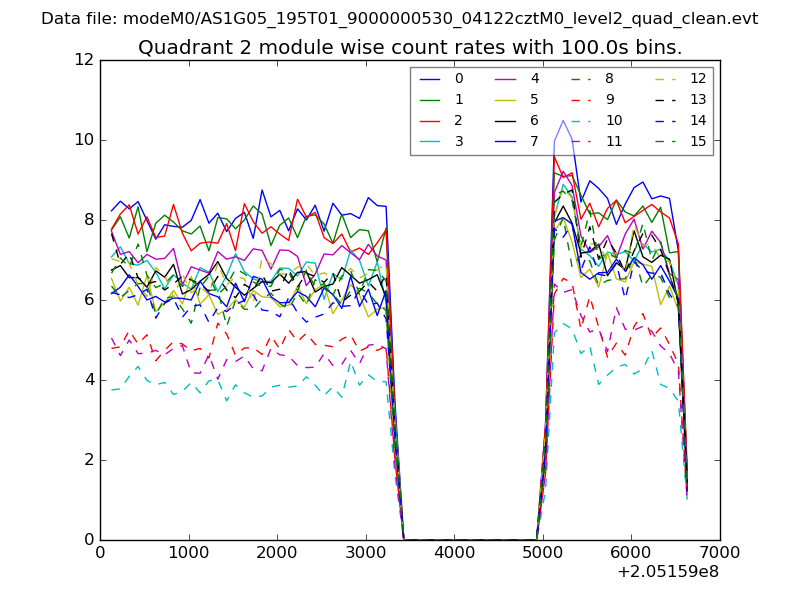
| Module-wise count rates for Quadrant B Data is divided into 100 sec bins |
 |
 |
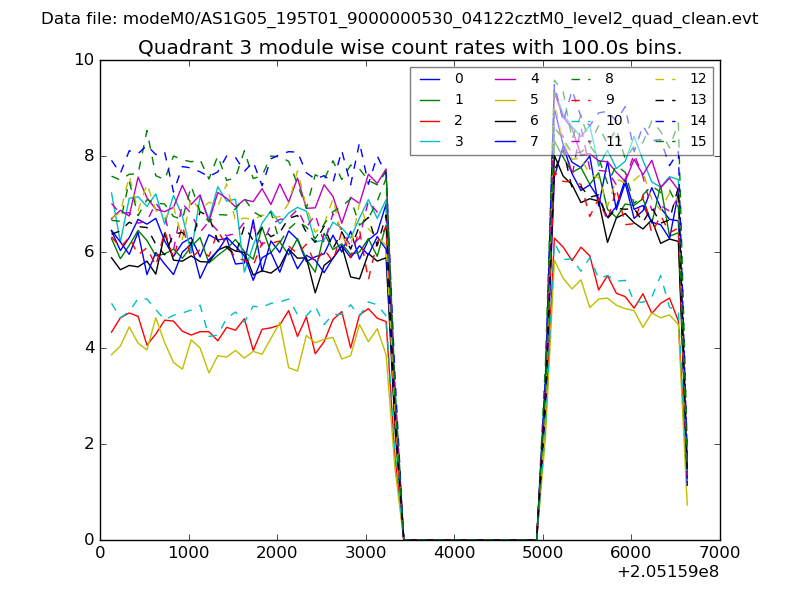
| Module-wise count rates for Quadrant C Data is divided into 100 sec bins |
 |
 |
| Module-wise count rates for Quadrant D Data is divided into 100 sec bins |
 |
 |
| Parameter | Plot |
|---|---|
| CZT HV Monitor | 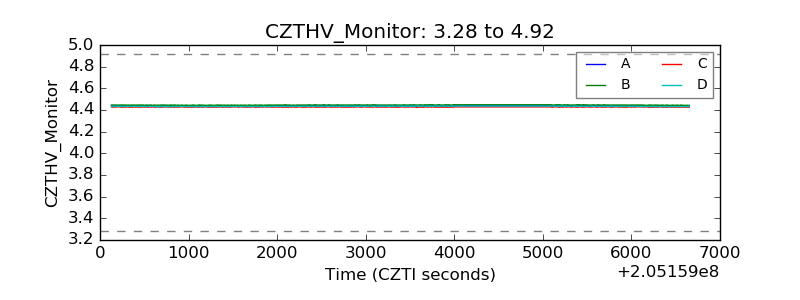 |
| D_VDD | 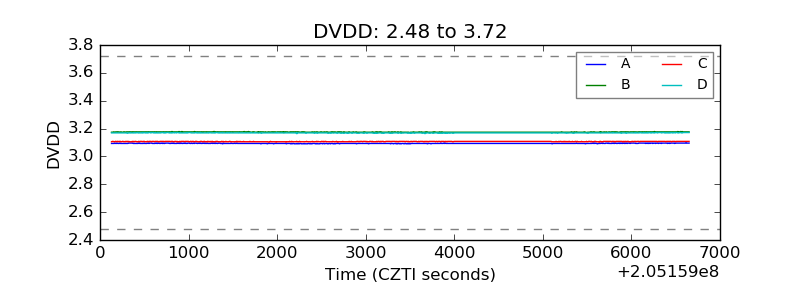 |
| Temperature 1 | 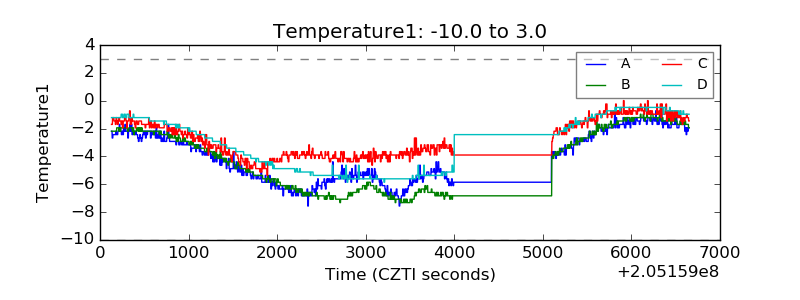 |
| Veto HV Monitor | 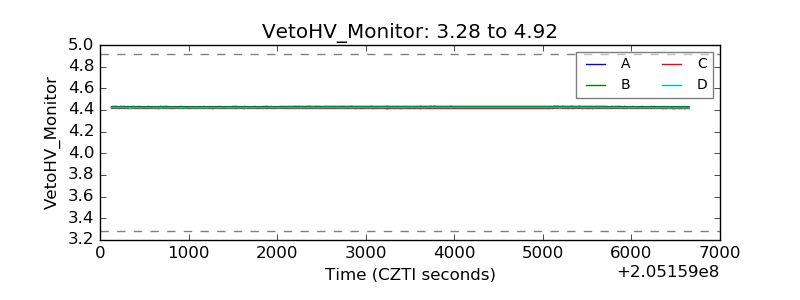 |
| Veto LLD |  |
| Alpha Counter | 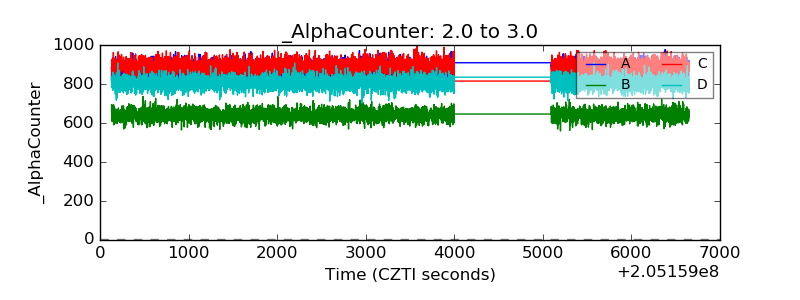 |
| _CPM_Rate | 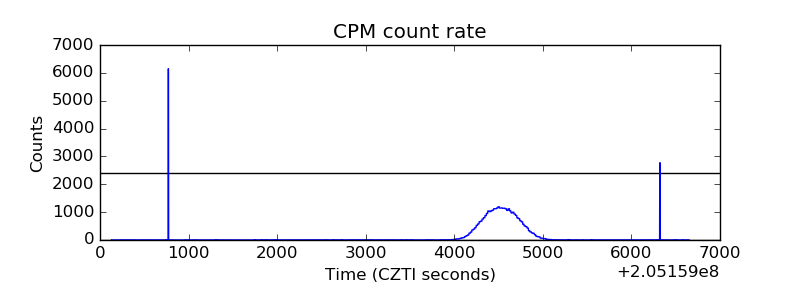 |
| CZT Counter | 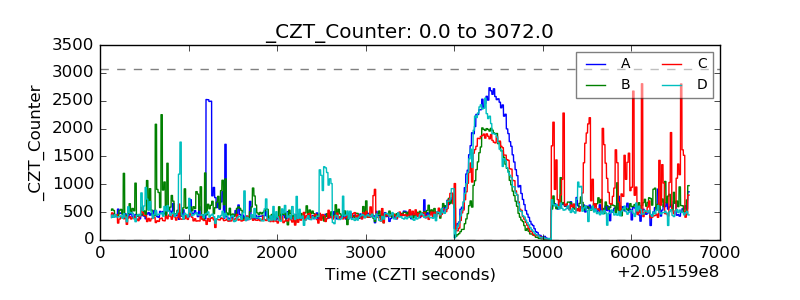 |
| +2.5 Volts monitor |  |
| +5 Volts monitor |  |
| _ROLL_ROT | 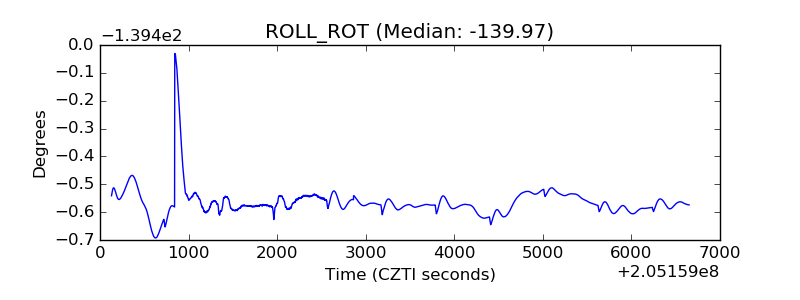 |
| _Roll_DEC | 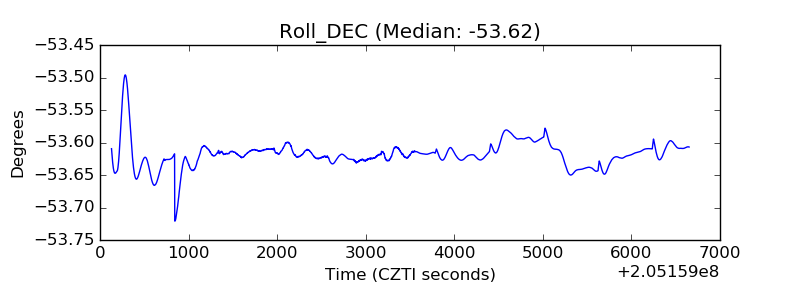 |
| _Roll_RA | 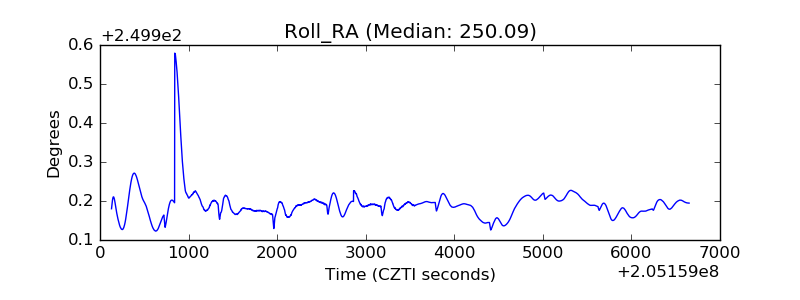 |
| Veto Counter | 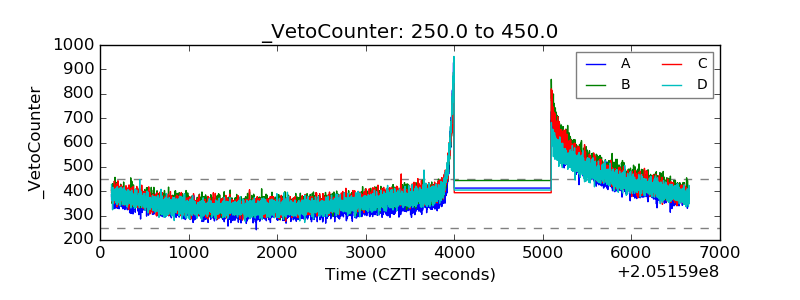 |