| Param | Original file | Final file |
|---|---|---|
| Filename | modeM0/AS1G05_195T01_9000000530_04123cztM0_level2.evt | modeM0/AS1G05_195T01_9000000530_04123cztM0_level2_quad_clean.evt |
| Size (bytes) | 480,614,400 | 95,129,280 |
| Size | 458.3 MB | 90.7 MB |
| Events in quadrant A | 3,465,076 | 621,724 |
| Events in quadrant B | 3,532,205 | 620,355 |
| Events in quadrant C | 3,672,254 | 598,649 |
| Events in quadrant D | 3,451,438 | 593,616 |
| Mode SS | |||
|---|---|---|---|
| Quadrant | BADHDUFLAG | Total packets | Discarded packets |
| A | 0 | 130 | 0 |
| B | 0 | 130 | 0 |
| C | 0 | 130 | 0 |
| D | 0 | 130 | 0 |
| Mode M0 | |||
|---|---|---|---|
| Quadrant | BADHDUFLAG | Total packets | Discarded packets |
| A | 0 | 14524 | 2 |
| B | 0 | 14807 | 1 |
| C | 0 | 15566 | 1 |
| D | 0 | 14368 | 1 |
| Mode M9 | |||
|---|---|---|---|
| Quadrant | BADHDUFLAG | Total packets | Discarded packets |
| A | 0 | 12 | 0 |
| B | 0 | 12 | 0 |
| C | 0 | 12 | 0 |
| D | 0 | 12 | 0 |
| Quadrant | Total seconds | Saturated seconds | Saturation percentage |
|---|---|---|---|
| A | 6401 | 110 | 1.718481% |
| B | 6401 | 71 | 1.109202% |
| C | 6401 | 234 | 3.655679% |
| D | 6401 | 100 | 1.562256% |
Noise dominated data is calculated using 1-second bins in cleaned event files. If a bin has >2000 counts, and if more than 50% of those come from <1% of pixels, then it is considered to be noise-dominated and hence unusable.
| Quadrant | # 1 sec bins | Bins with >0 counts | Bins with >2000 counts | High rate bins dominated by noise | Noise dominated (total time) | Noise dominated (detector-on time) | Marked lightcurve |
|---|---|---|---|---|---|---|---|
| A | 7596 | 6402 | 45 | 45 | 0.59% | 0.70% | 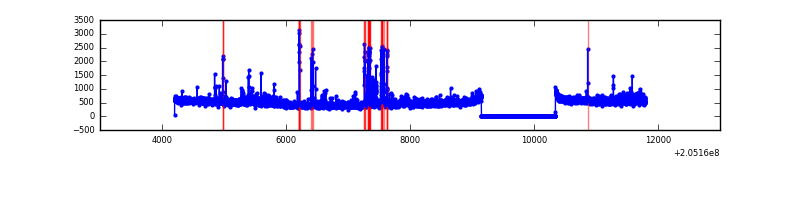 |
| B | 7596 | 6402 | 6 | 6 | 0.08% | 0.09% |  |
| C | 7596 | 6402 | 142 | 142 | 1.87% | 2.22% | 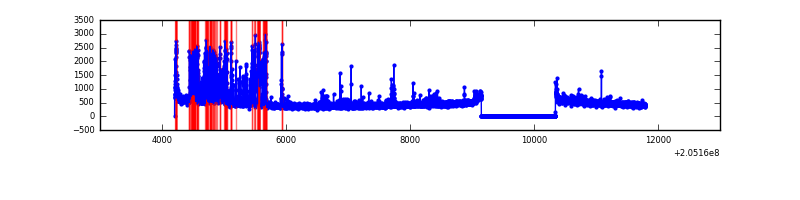 |
| D | 7596 | 6402 | 16 | 16 | 0.21% | 0.25% |  |
Top three noisy pixels from each quadrant. If the there are fewer than three noisy pixels in the level2.evt file, extra rows are filled as -1
| Pixel properties | Quadrant properties | ||||||
|---|---|---|---|---|---|---|---|
| Quadrant | DetID | PixID | Counts | Sigma | Mean | Median | Sigma |
| A | 0 | 199 | 205849 | 1313.54 | 767 | 751 | 156.1 |
| A | 0 | 50 | 143486 | 914.14 | 767 | 751 | 156.1 |
| A | 0 | 118 | 58838 | 372.01 | 767 | 751 | 156.1 |
| B | 15 | 204 | 349978 | 2370.64 | 773 | 756 | 147.3 |
| B | 10 | 16 | 38781 | 258.13 | 773 | 756 | 147.3 |
| B | 0 | 183 | 28137 | 185.87 | 773 | 756 | 147.3 |
| C | 9 | 144 | 823290 | 4888.21 | 724 | 728 | 168.3 |
| C | 13 | 61 | 6013 | 31.41 | 724 | 728 | 168.3 |
| C | 12 | 4 | 4723 | 23.74 | 724 | 728 | 168.3 |
| D | 2 | 37 | 480397 | 2727.39 | 733 | 711 | 175.9 |
| D | 12 | 233 | 52375 | 293.75 | 733 | 711 | 175.9 |
| D | 2 | 232 | 29682 | 164.72 | 733 | 711 | 175.9 |
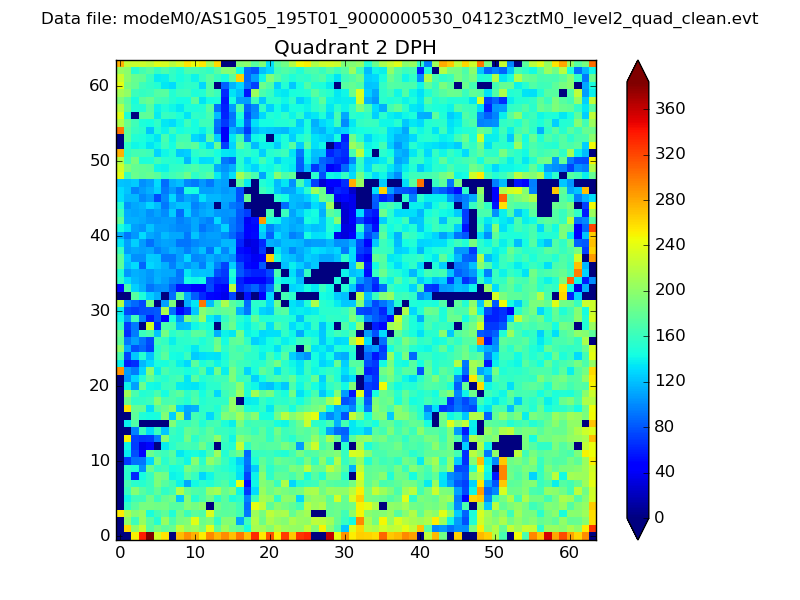
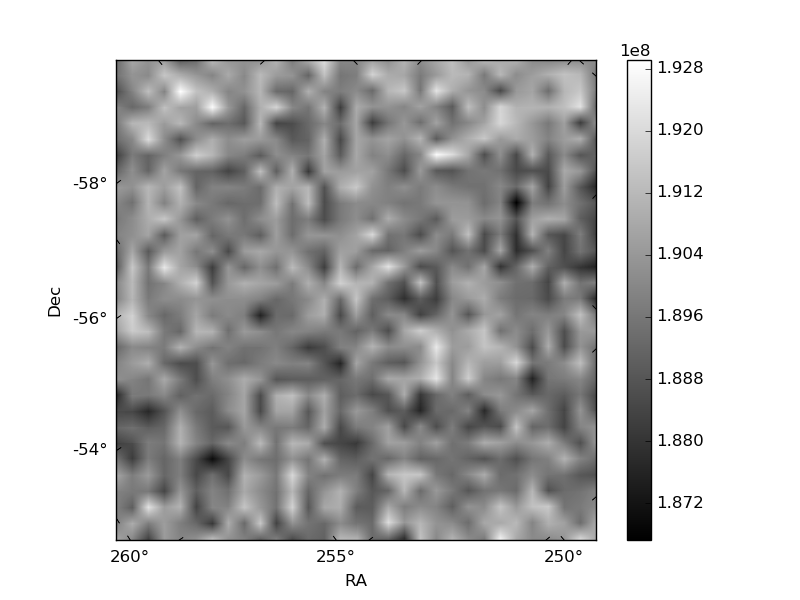
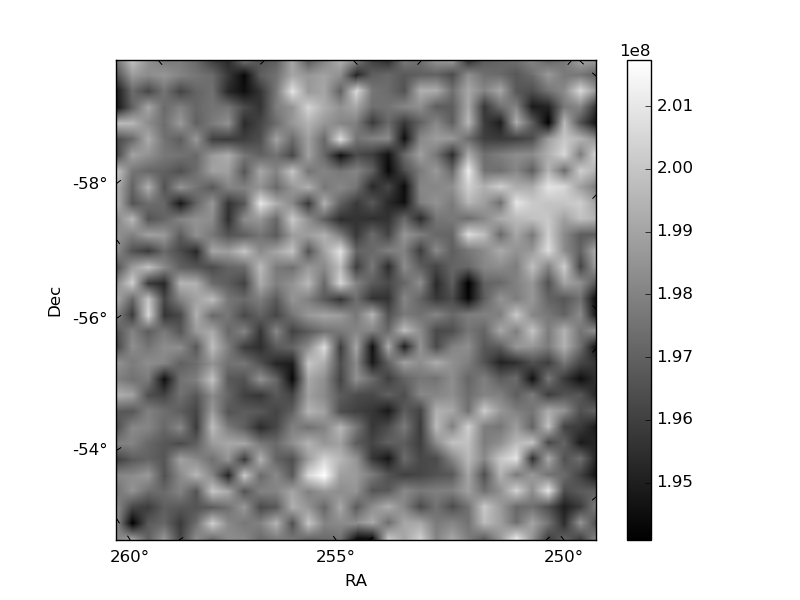
Histogram calculated using DETX and DETY for each event in the final _common_clean file
| Quadrant A | 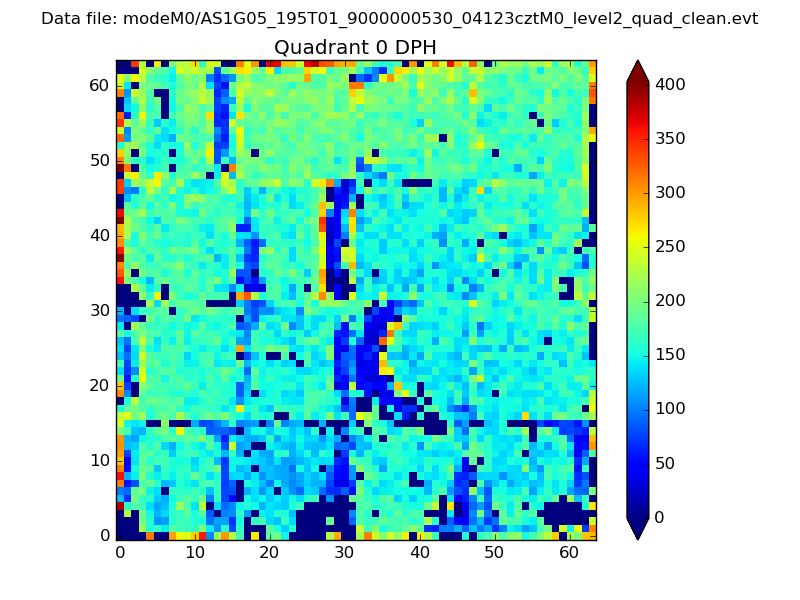 |
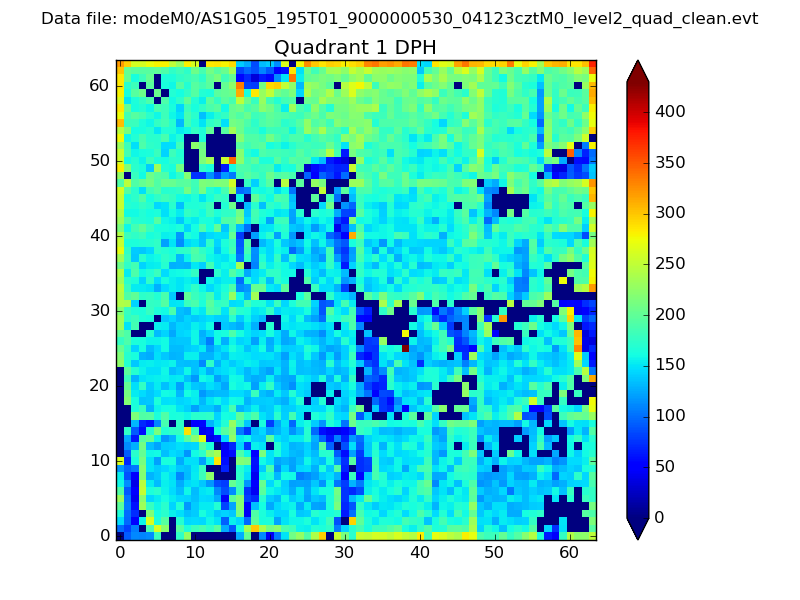 |
Quadrant B |
|---|---|---|---|
| Quadrant D | 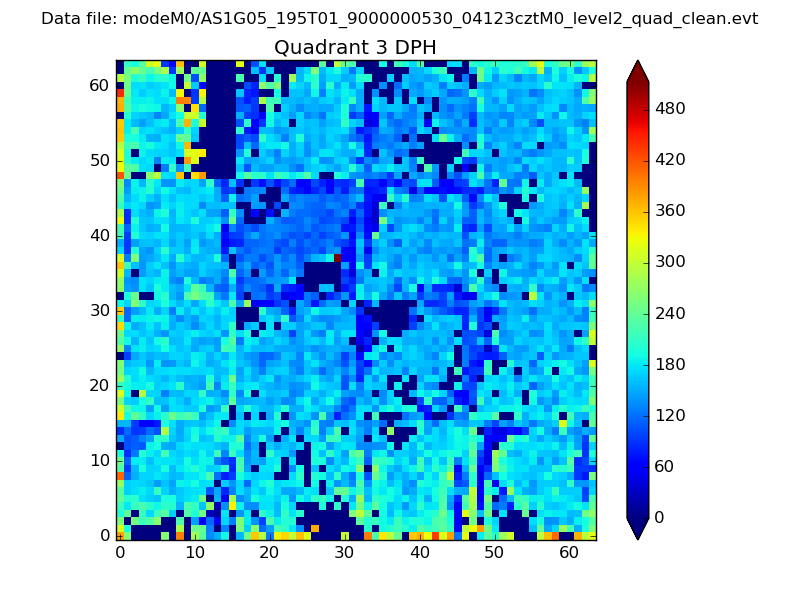 |
 |
Quadrant C |
| Plot type | Count rate plots | Images |
|---|---|---|
| Comparison with Poisson distribution Blue bars denote a histogram of data divided into 1 sec bins. Red curve is a Poisson curve with rate = median count rate of data. |
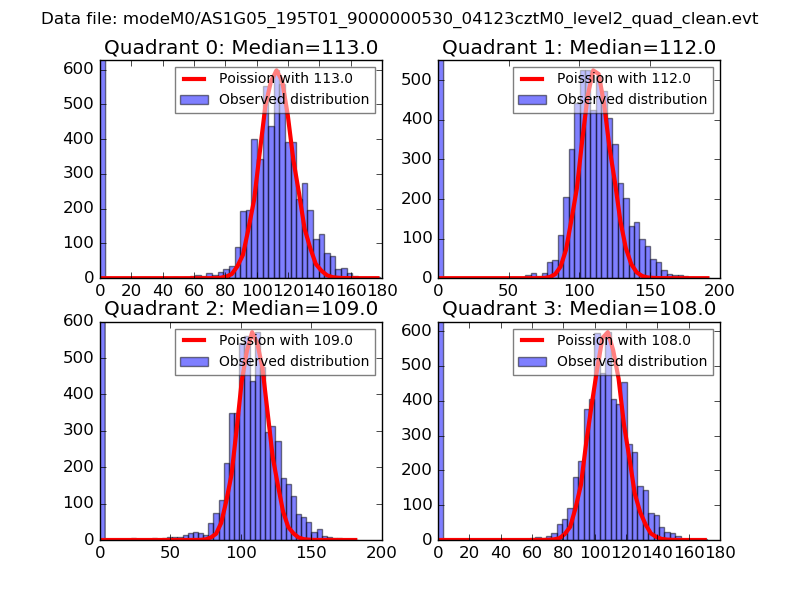 |
 |
| Quadrant-wise count rates Data is divided into 100 sec bins |
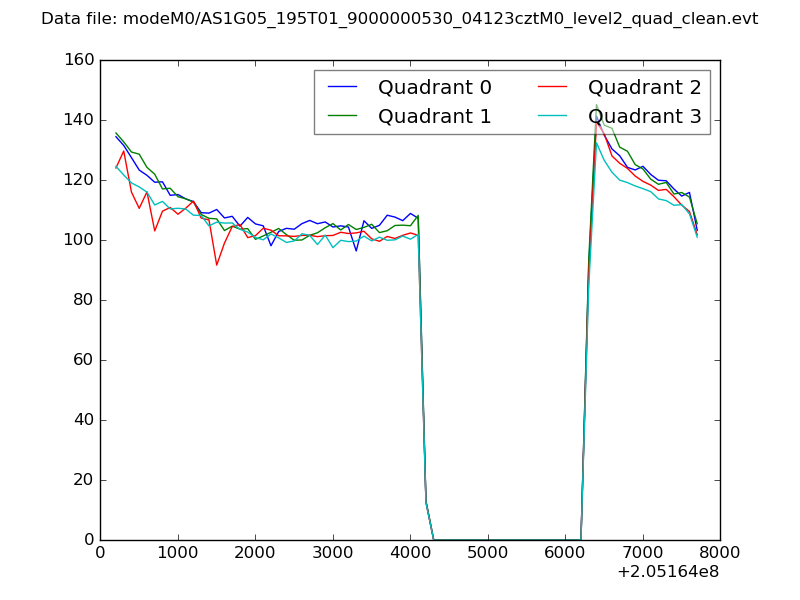 |
|
| Module-wise count rates for Quadrant A Data is divided into 100 sec bins |
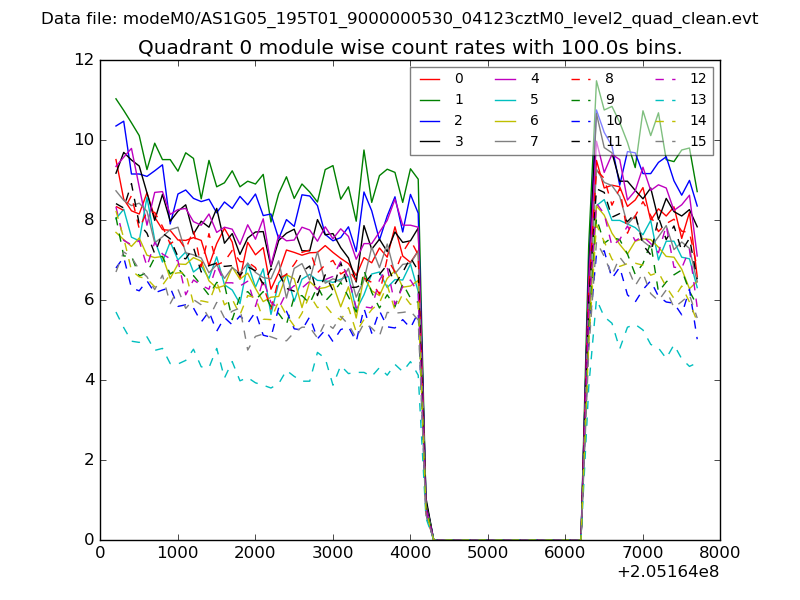 |
 |
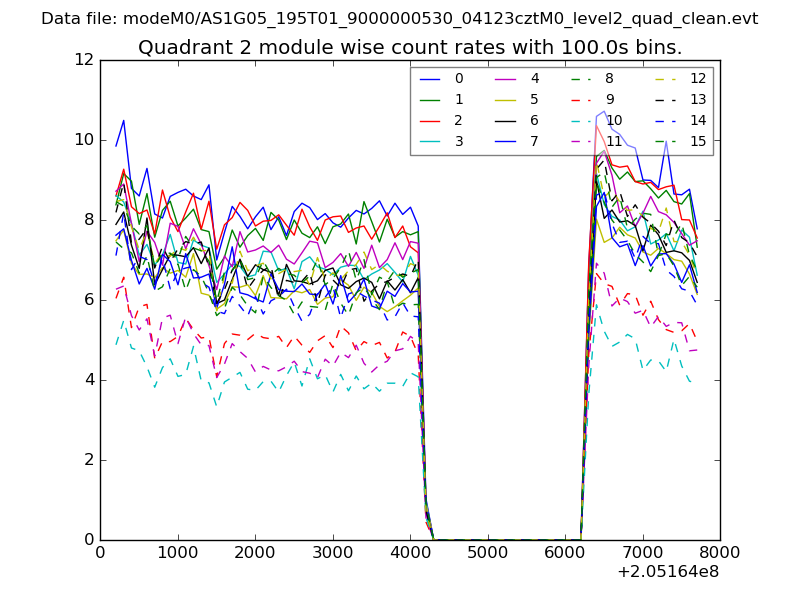
| Module-wise count rates for Quadrant B Data is divided into 100 sec bins |
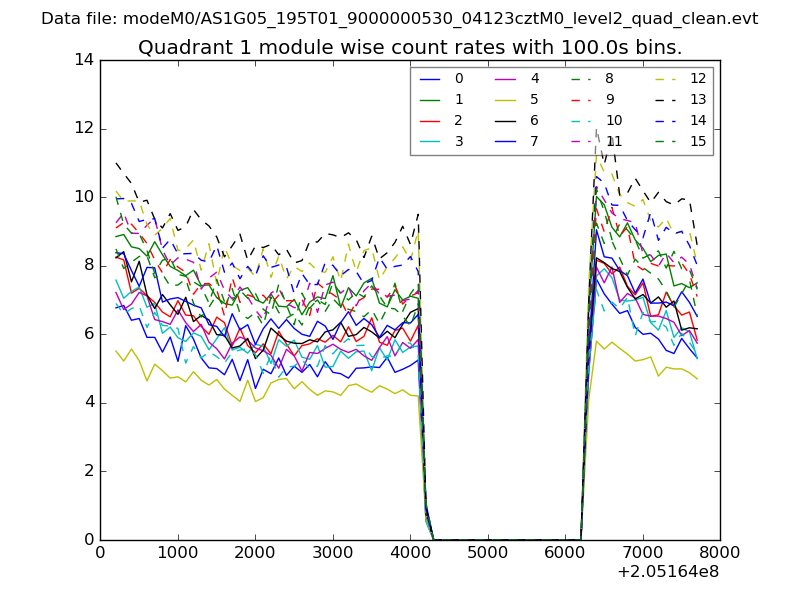 |
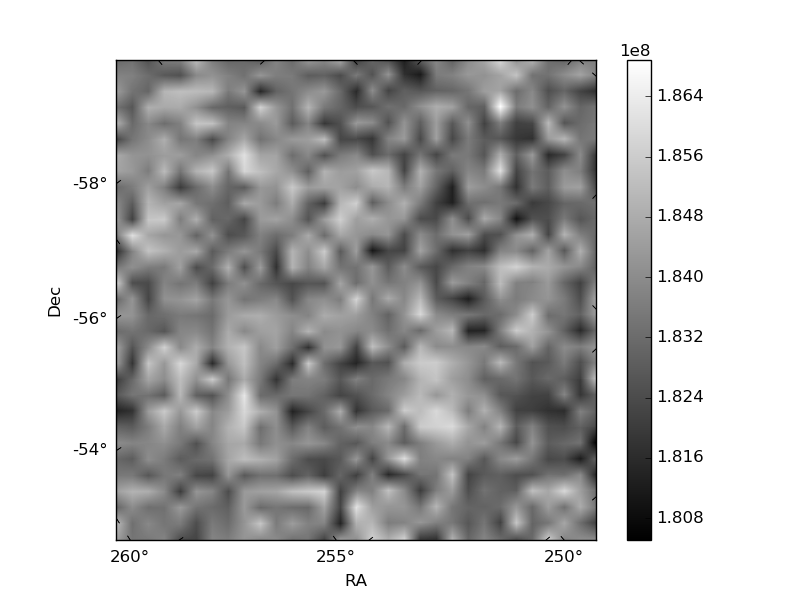 |
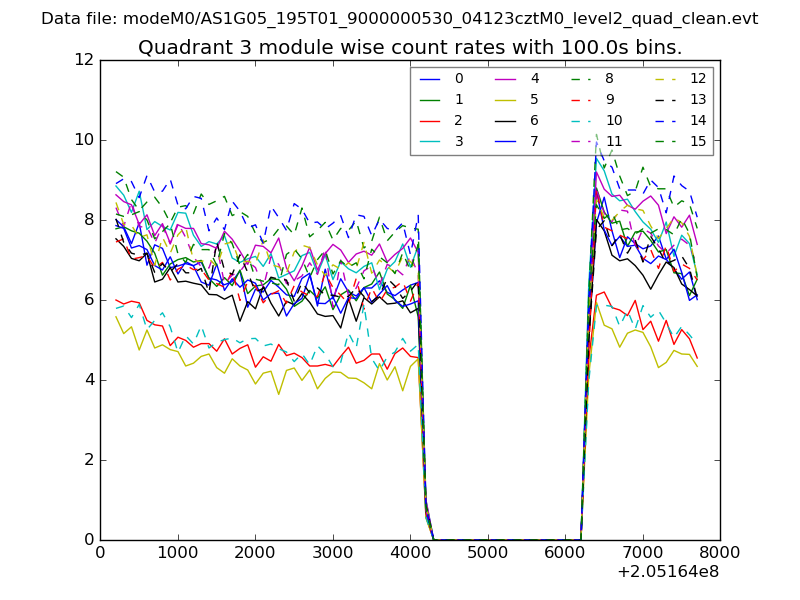
| Module-wise count rates for Quadrant C Data is divided into 100 sec bins |
 |
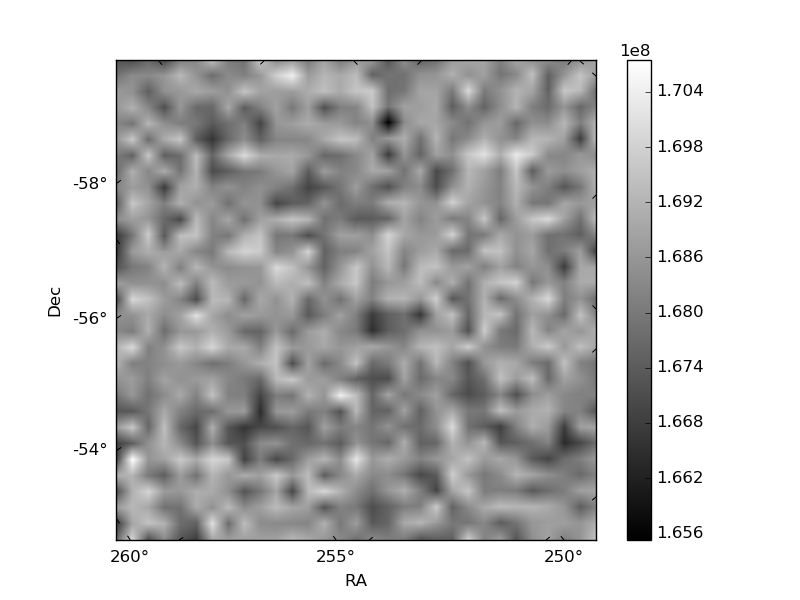 |
| Module-wise count rates for Quadrant D Data is divided into 100 sec bins |
 |
 |
| Parameter | Plot |
|---|---|
| CZT HV Monitor | 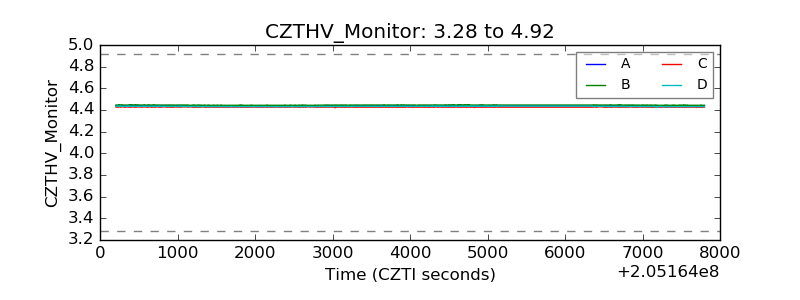 |
| D_VDD | 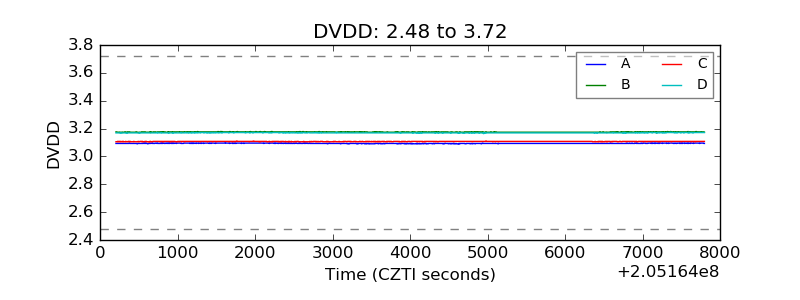 |
| Temperature 1 |  |
| Veto HV Monitor | 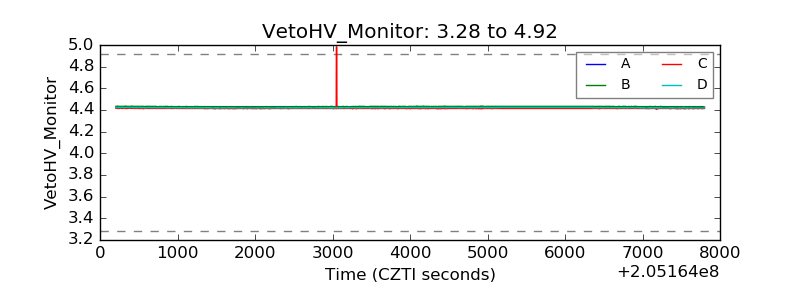 |
| Veto LLD |  |
| Alpha Counter | 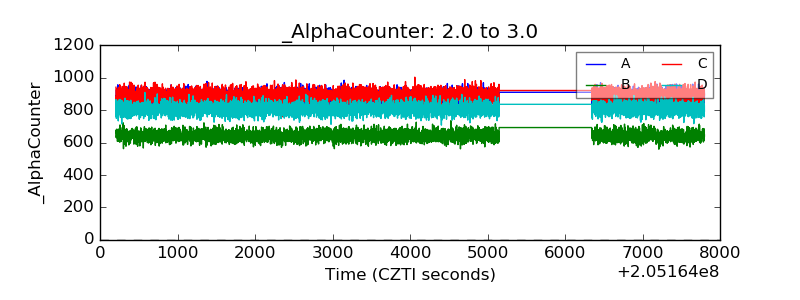 |
| _CPM_Rate | 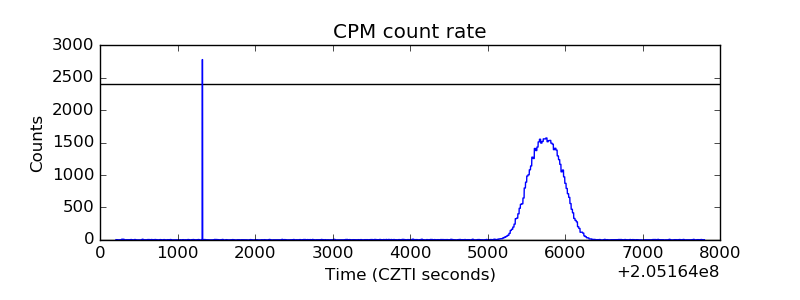 |
| CZT Counter | 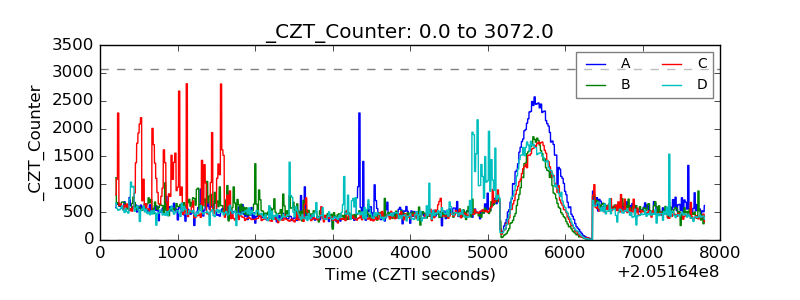 |
| +2.5 Volts monitor | 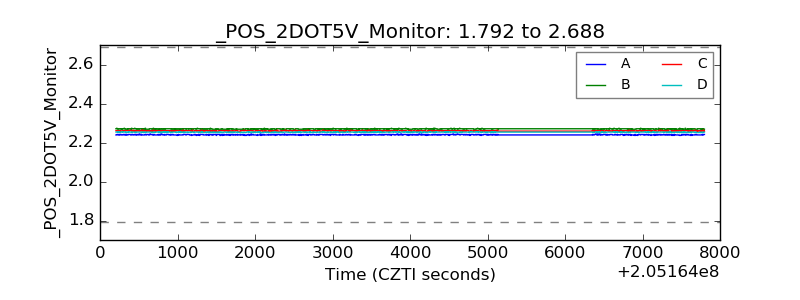 |
| +5 Volts monitor |  |
| _ROLL_ROT | 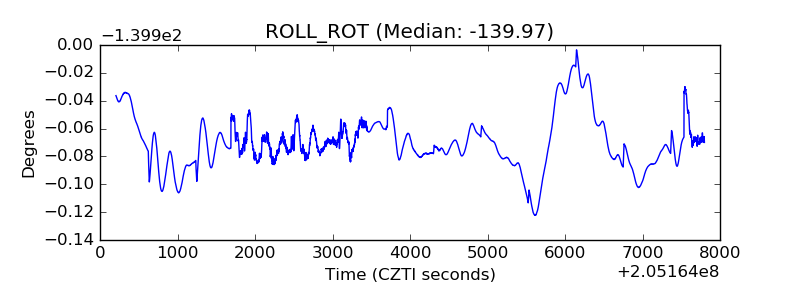 |
| _Roll_DEC | 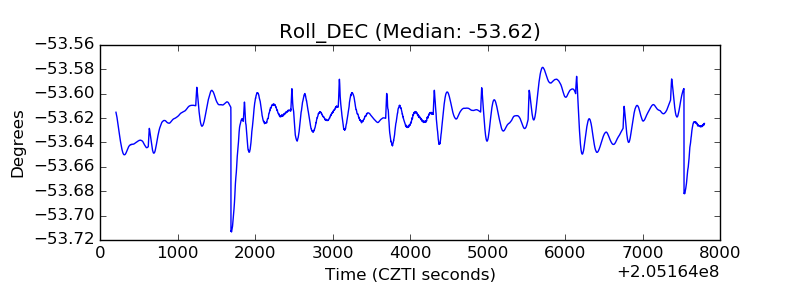 |
| _Roll_RA | 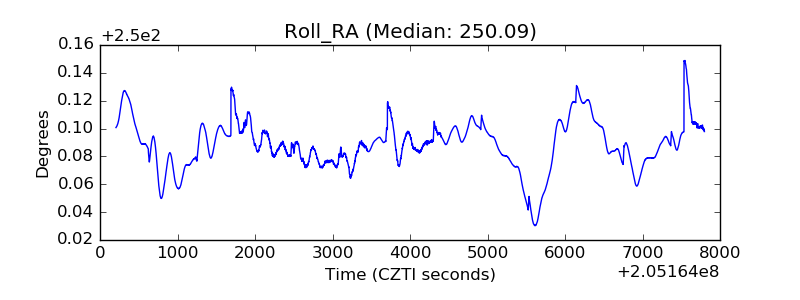 |
| Veto Counter | 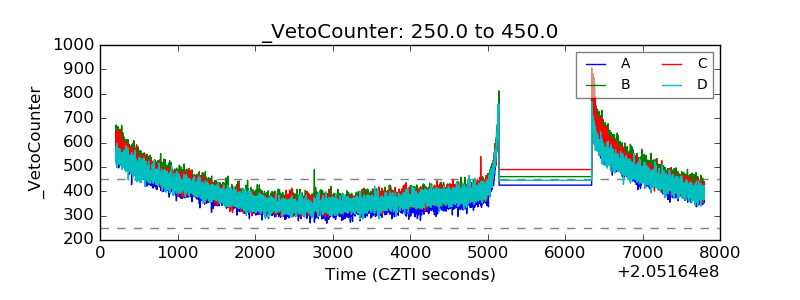 |