| Param | Original file | Final file |
|---|---|---|
| Filename | modeM0/AS1G05_195T01_9000000530_04124cztM0_level2.evt | modeM0/AS1G05_195T01_9000000530_04124cztM0_level2_quad_clean.evt |
| Size (bytes) | 447,120,000 | 90,339,840 |
| Size | 426.4 MB | 86.2 MB |
| Events in quadrant A | 3,346,314 | 587,704 |
| Events in quadrant B | 3,714,669 | 582,875 |
| Events in quadrant C | 2,892,566 | 570,232 |
| Events in quadrant D | 3,157,492 | 553,393 |
| Mode SS | |||
|---|---|---|---|
| Quadrant | BADHDUFLAG | Total packets | Discarded packets |
| A | 0 | 126 | 0 |
| B | 0 | 126 | 0 |
| C | 0 | 126 | 0 |
| D | 0 | 126 | 0 |
| Mode M0 | |||
|---|---|---|---|
| Quadrant | BADHDUFLAG | Total packets | Discarded packets |
| A | 0 | 14034 | 2 |
| B | 0 | 15172 | 1 |
| C | 0 | 13068 | 1 |
| D | 0 | 14029 | 1 |
| Mode M9 | |||
|---|---|---|---|
| Quadrant | BADHDUFLAG | Total packets | Discarded packets |
| A | 0 | 13 | 0 |
| B | 0 | 13 | 0 |
| C | 0 | 13 | 0 |
| D | 0 | 13 | 0 |
| Quadrant | Total seconds | Saturated seconds | Saturation percentage |
|---|---|---|---|
| A | 6331 | 51 | 0.805560% |
| B | 6331 | 82 | 1.295214% |
| C | 6331 | 27 | 0.426473% |
| D | 6331 | 61 | 0.963513% |
Noise dominated data is calculated using 1-second bins in cleaned event files. If a bin has >2000 counts, and if more than 50% of those come from <1% of pixels, then it is considered to be noise-dominated and hence unusable.
| Quadrant | # 1 sec bins | Bins with >0 counts | Bins with >2000 counts | High rate bins dominated by noise | Noise dominated (total time) | Noise dominated (detector-on time) | Marked lightcurve |
|---|---|---|---|---|---|---|---|
| A | 7661 | 6332 | 15 | 15 | 0.20% | 0.24% | 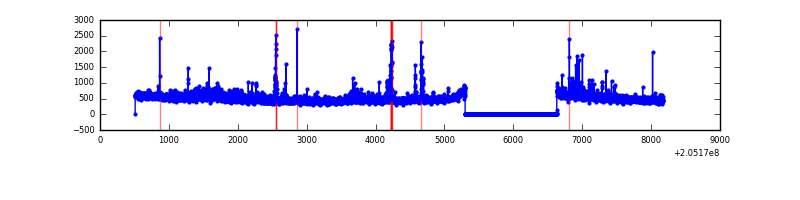 |
| B | 7661 | 6332 | 44 | 44 | 0.57% | 0.69% | 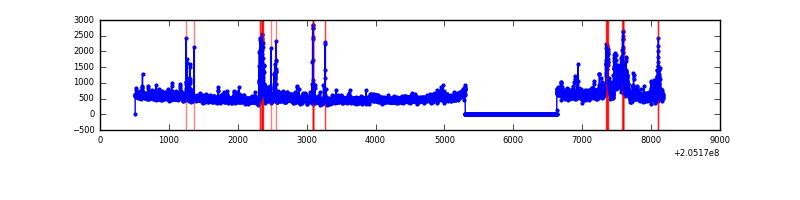 |
| C | 7661 | 6332 | 5 | 5 | 0.07% | 0.08% | 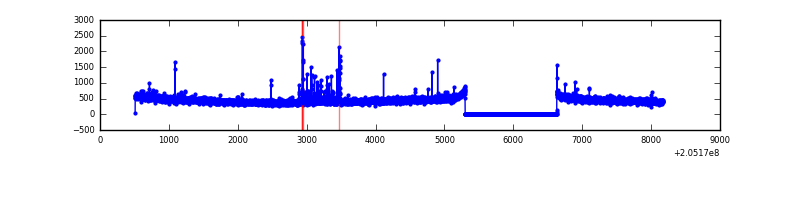 |
| D | 7661 | 6332 | 50 | 50 | 0.65% | 0.79% | 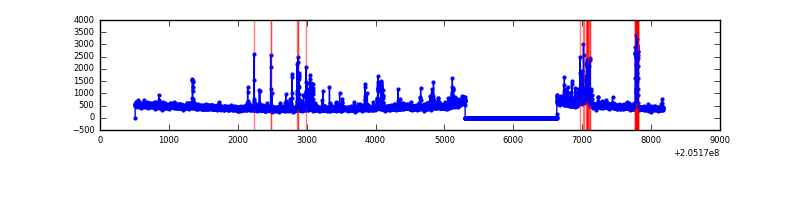 |
Top three noisy pixels from each quadrant. If the there are fewer than three noisy pixels in the level2.evt file, extra rows are filled as -1
| Pixel properties | Quadrant properties | ||||||
|---|---|---|---|---|---|---|---|
| Quadrant | DetID | PixID | Counts | Sigma | Mean | Median | Sigma |
| A | 0 | 199 | 198152 | 1281.15 | 751 | 737 | 154.1 |
| A | 0 | 50 | 75869 | 487.58 | 751 | 737 | 154.1 |
| A | 15 | 234 | 48715 | 311.36 | 751 | 737 | 154.1 |
| B | 15 | 204 | 279534 | 1932.2 | 756 | 738 | 144.3 |
| B | 8 | 3 | 145208 | 1001.25 | 756 | 738 | 144.3 |
| B | 10 | 16 | 127495 | 878.49 | 756 | 738 | 144.3 |
| C | 9 | 144 | 103288 | 620.56 | 711 | 715 | 165.3 |
| C | 13 | 61 | 6063 | 32.36 | 711 | 715 | 165.3 |
| C | 12 | 4 | 5754 | 30.49 | 711 | 715 | 165.3 |
| D | 2 | 37 | 213500 | 1242.53 | 709 | 687 | 171.3 |
| D | 14 | 52 | 76634 | 443.42 | 709 | 687 | 171.3 |
| D | 2 | 232 | 47109 | 271.04 | 709 | 687 | 171.3 |
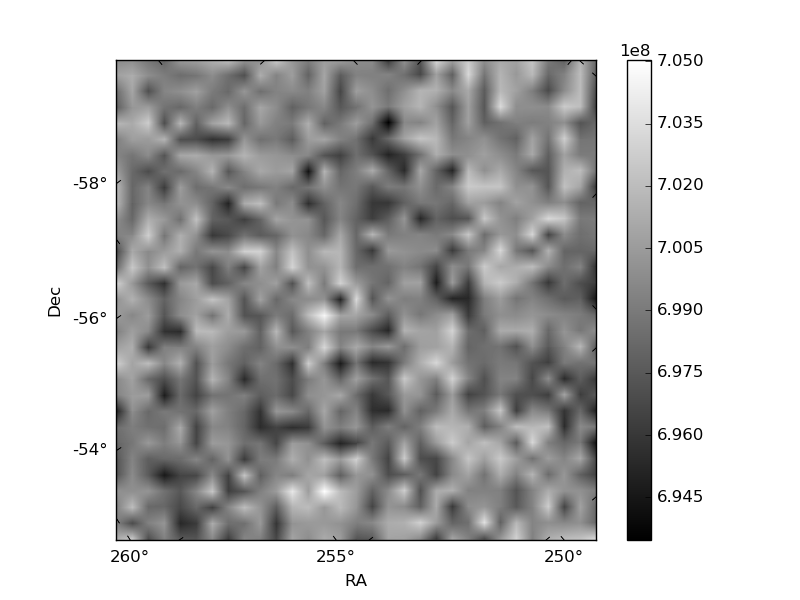
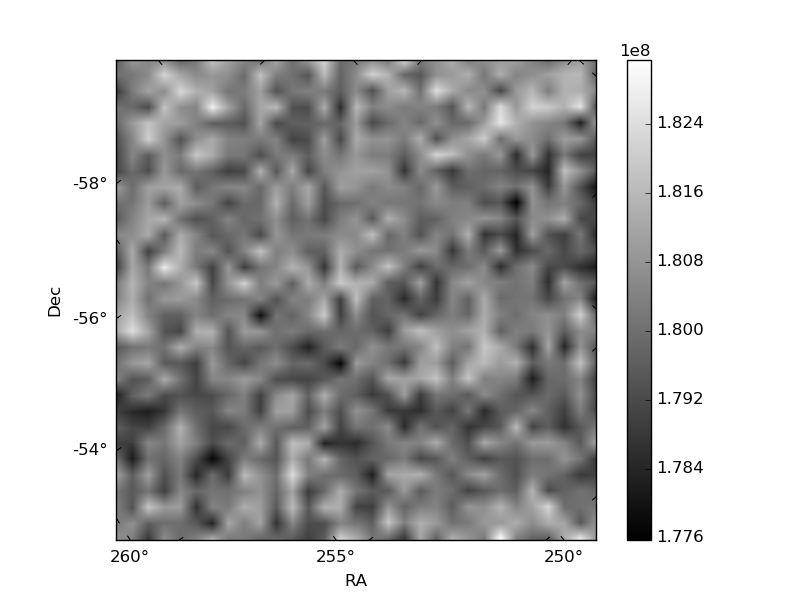
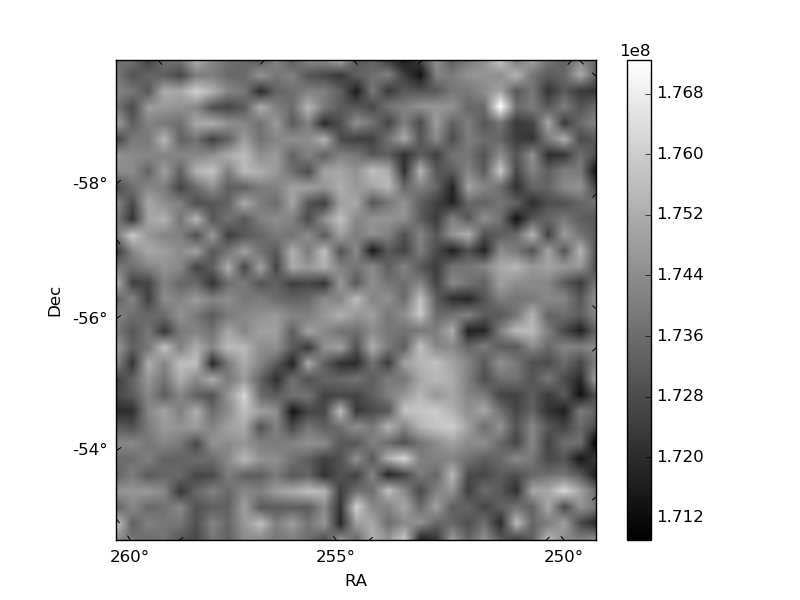
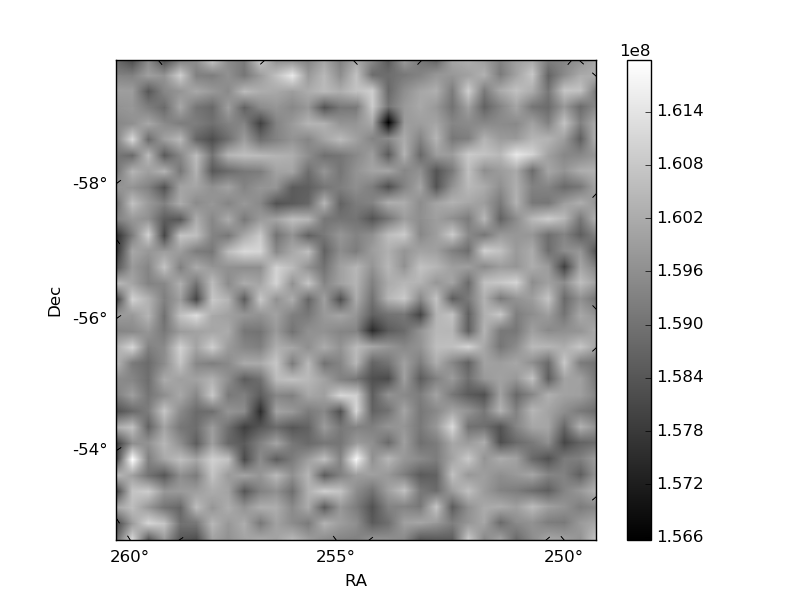
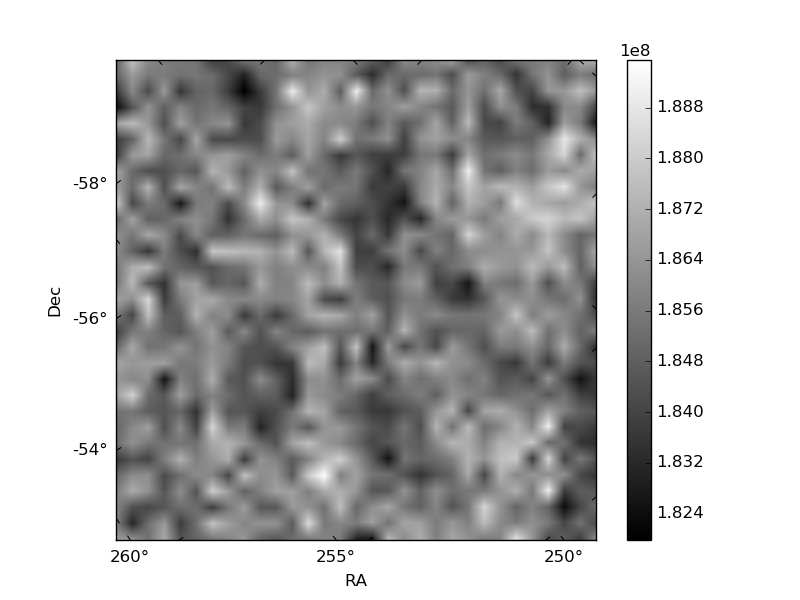
Histogram calculated using DETX and DETY for each event in the final _common_clean file
| Quadrant A | 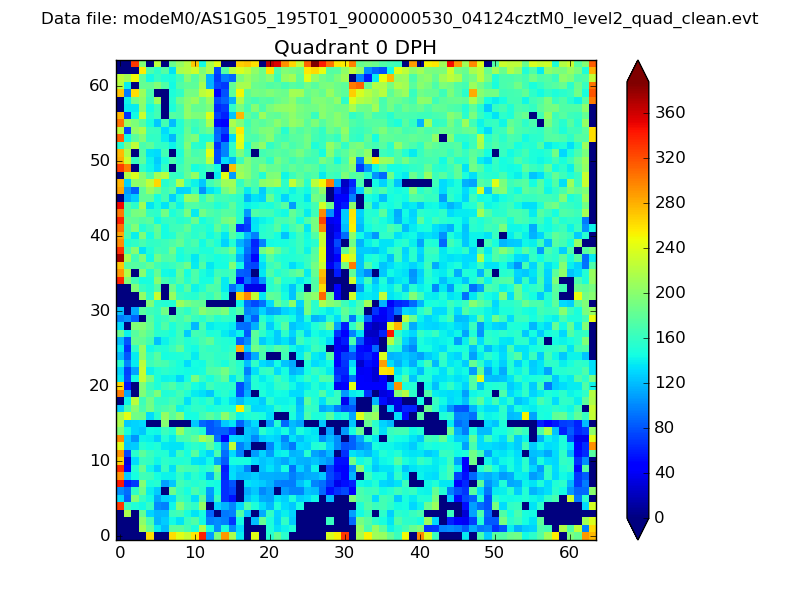 |
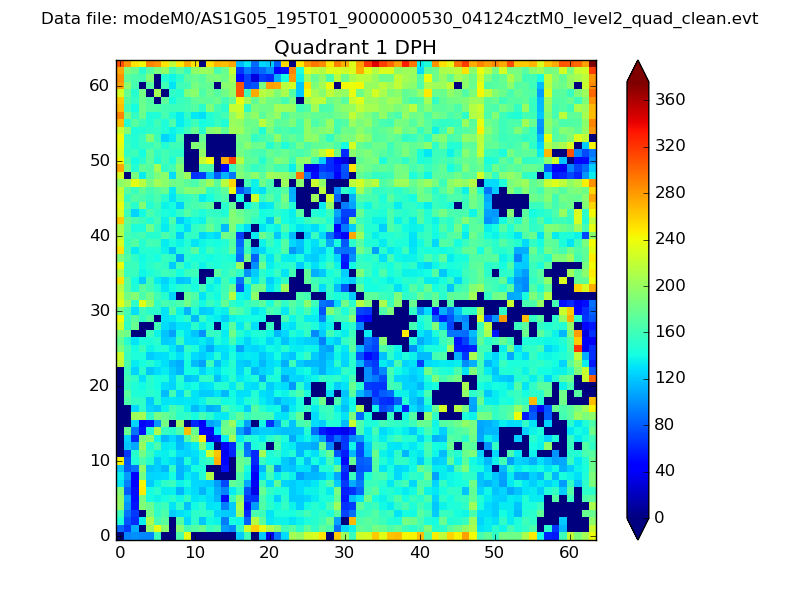 |
Quadrant B |
|---|---|---|---|
| Quadrant D | 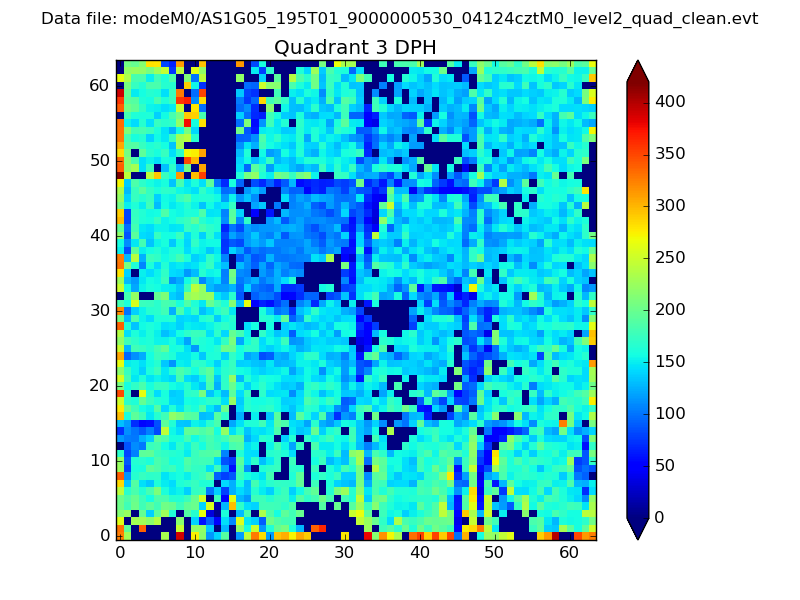 |
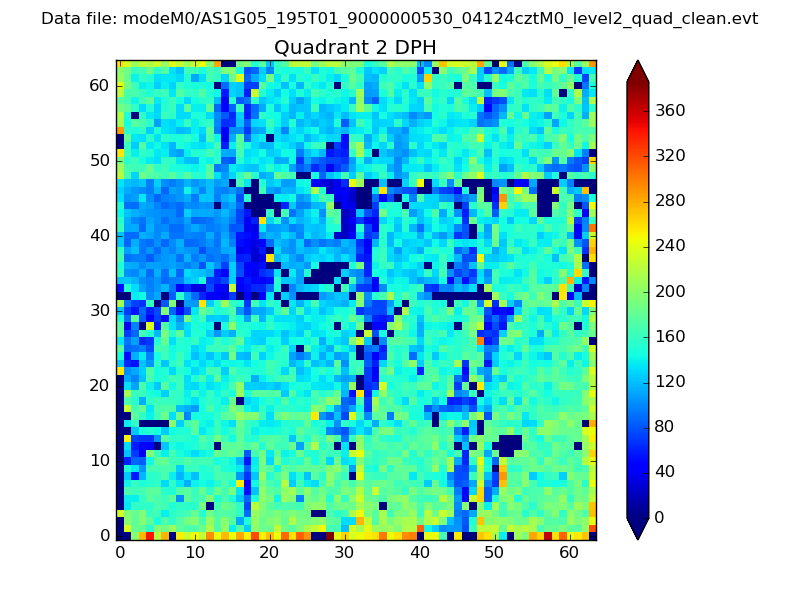 |
Quadrant C |
| Plot type | Count rate plots | Images |
|---|---|---|
| Comparison with Poisson distribution Blue bars denote a histogram of data divided into 1 sec bins. Red curve is a Poisson curve with rate = median count rate of data. |
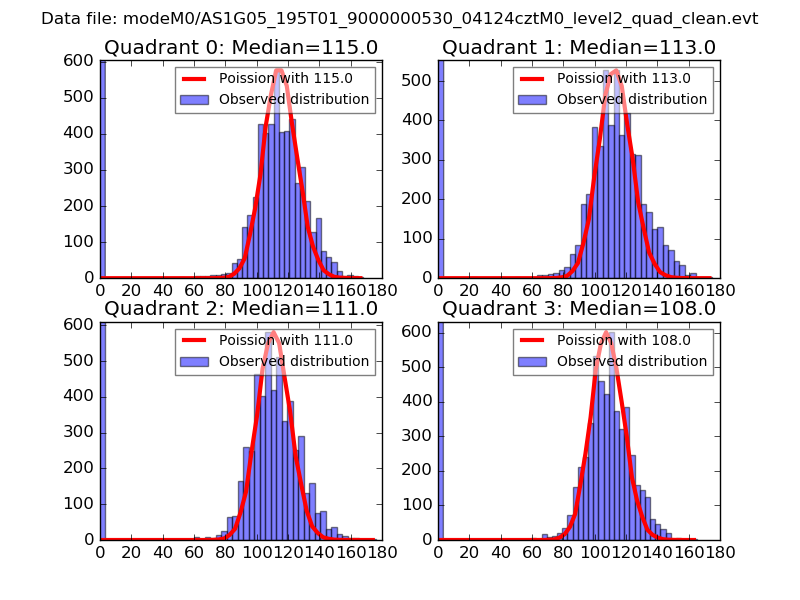 |
 |
| Quadrant-wise count rates Data is divided into 100 sec bins |
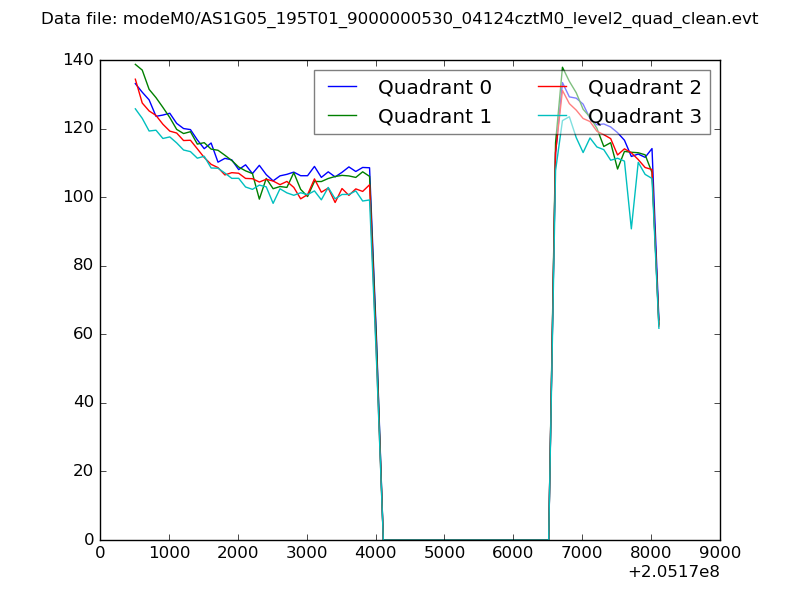 |
|
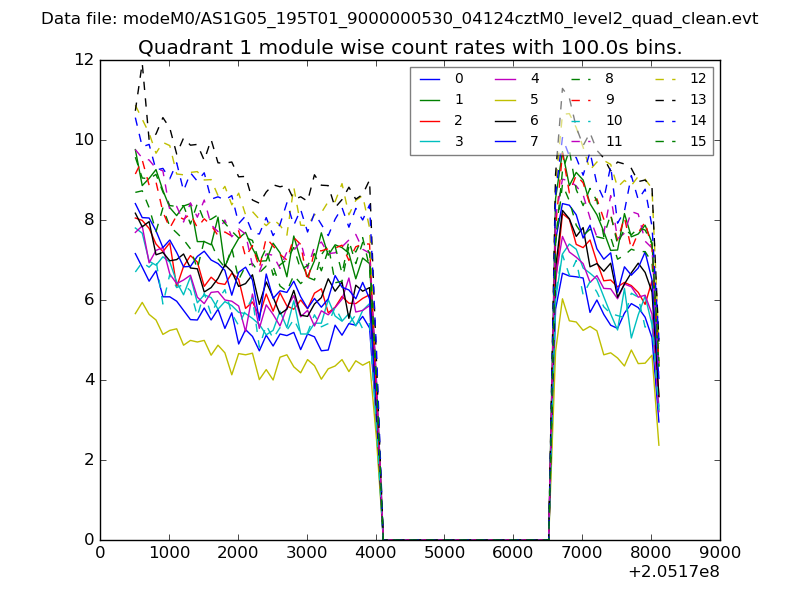
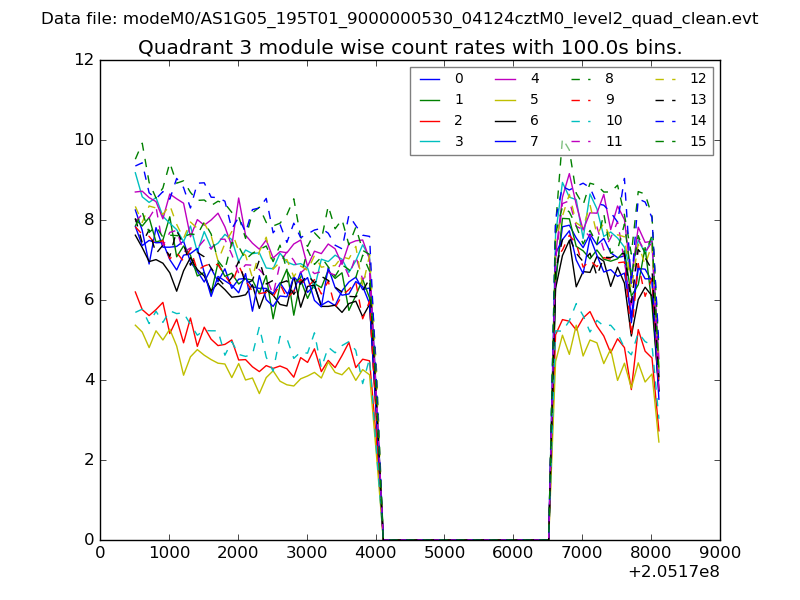
| Module-wise count rates for Quadrant A Data is divided into 100 sec bins |
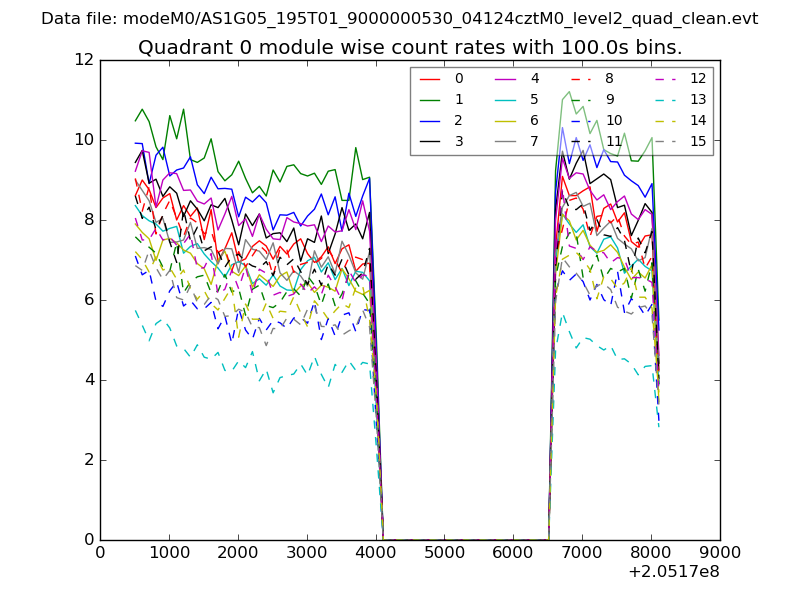 |
 |
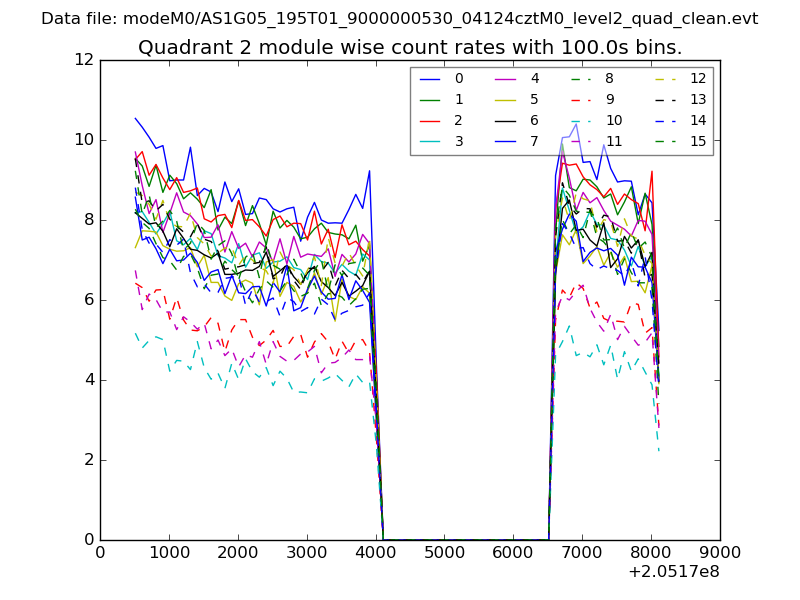
| Module-wise count rates for Quadrant B Data is divided into 100 sec bins |
 |
 |
| Module-wise count rates for Quadrant C Data is divided into 100 sec bins |
 |
 |
| Module-wise count rates for Quadrant D Data is divided into 100 sec bins |
 |
 |
| Parameter | Plot |
|---|---|
| CZT HV Monitor | 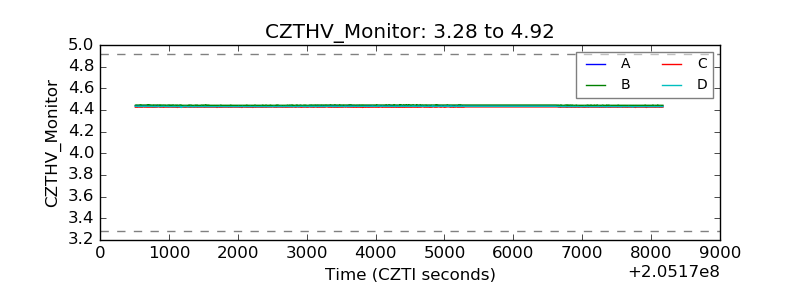 |
| D_VDD | 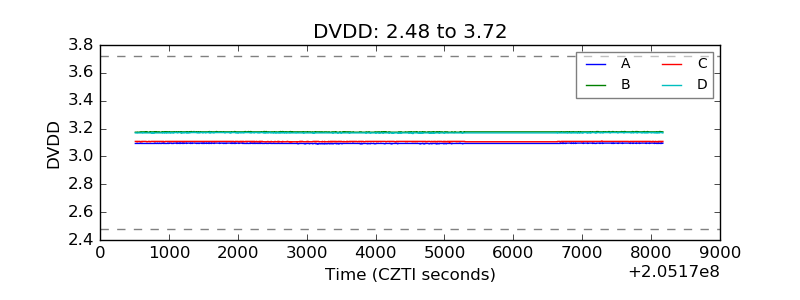 |
| Temperature 1 | 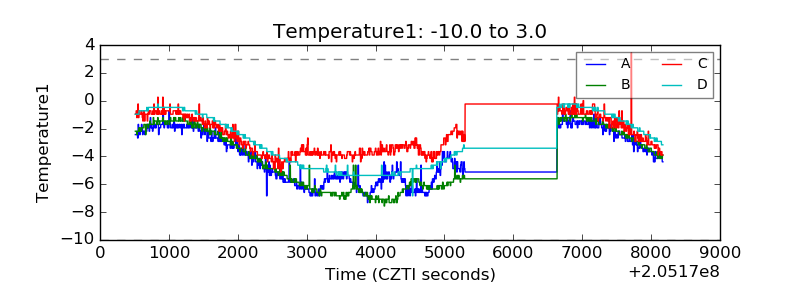 |
| Veto HV Monitor | 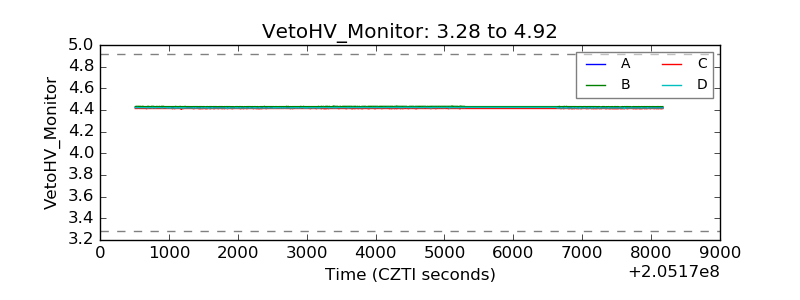 |
| Veto LLD | 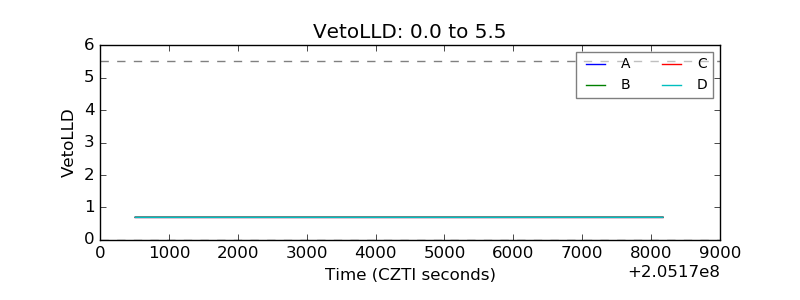 |
| Alpha Counter | 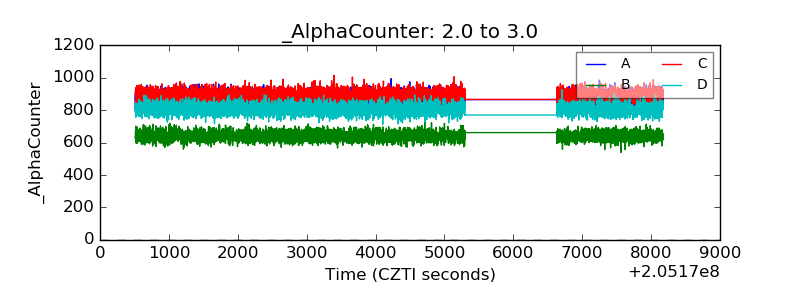 |
| _CPM_Rate | 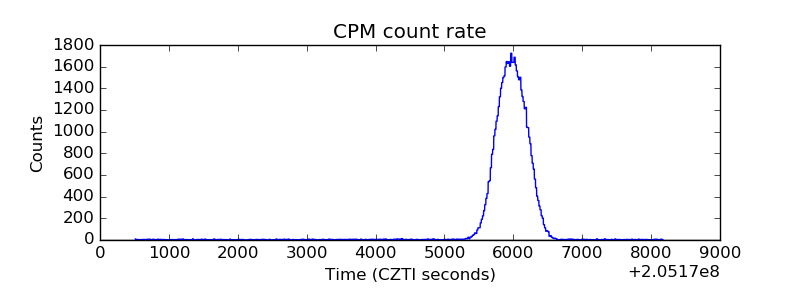 |
| CZT Counter | 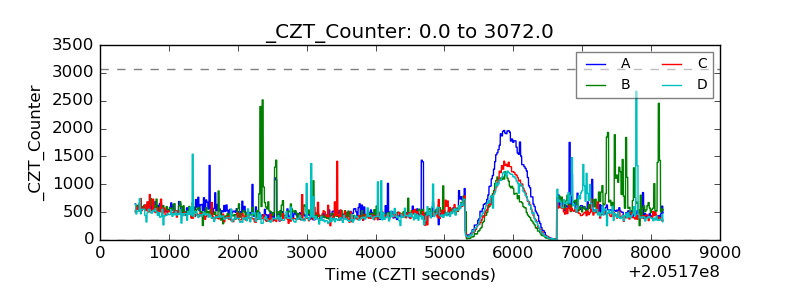 |
| +2.5 Volts monitor |  |
| +5 Volts monitor | 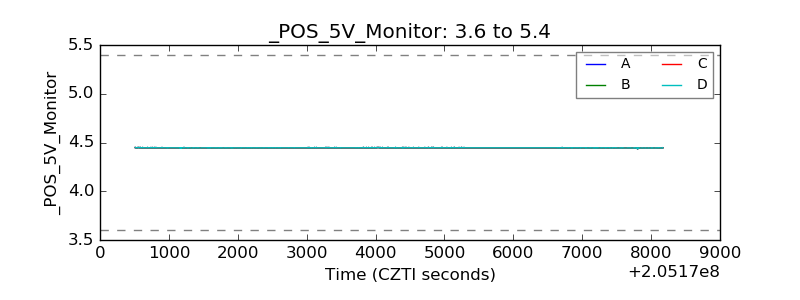 |
| _ROLL_ROT | 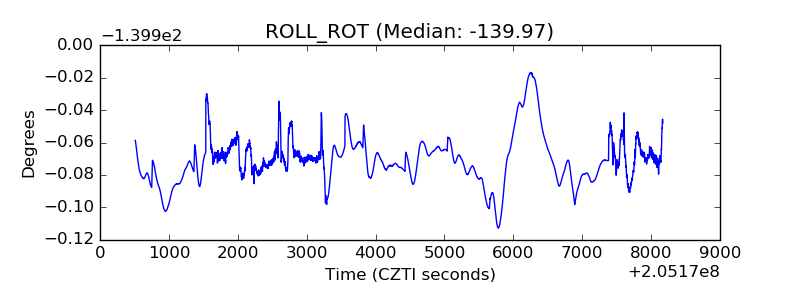 |
| _Roll_DEC | 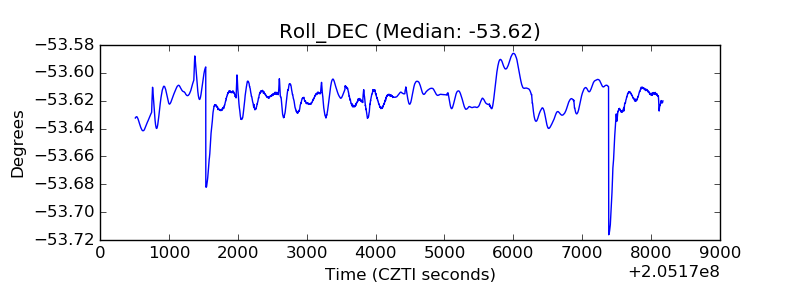 |
| _Roll_RA | 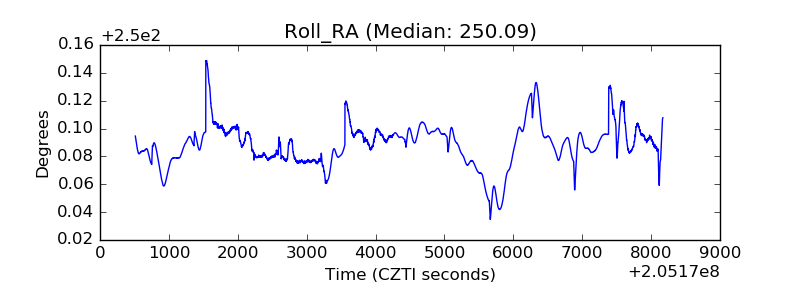 |
| Veto Counter | 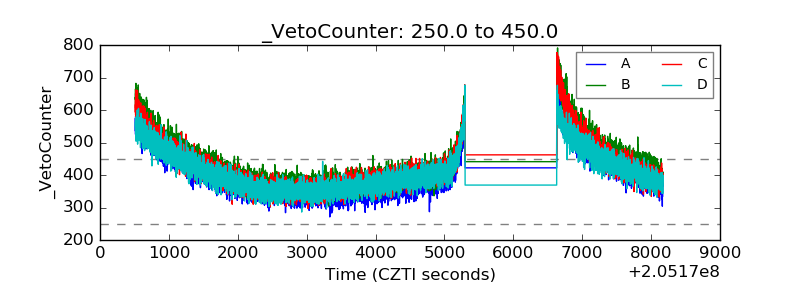 |