| Param | Original file | Final file |
|---|---|---|
| Filename | modeM0/AS1G05_195T01_9000000530_04125cztM0_level2.evt | modeM0/AS1G05_195T01_9000000530_04125cztM0_level2_quad_clean.evt |
| Size (bytes) | 613,566,720 | 81,849,600 |
| Size | 585.1 MB | 78.1 MB |
| Events in quadrant A | 3,602,792 | 532,681 |
| Events in quadrant B | 3,791,341 | 531,184 |
| Events in quadrant C | 2,838,951 | 522,220 |
| Events in quadrant D | 7,919,835 | 450,263 |
| Mode SS | |||
|---|---|---|---|
| Quadrant | BADHDUFLAG | Total packets | Discarded packets |
| A | 0 | 128 | 0 |
| B | 0 | 128 | 0 |
| C | 0 | 128 | 0 |
| D | 0 | 128 | 0 |
| Mode M0 | |||
|---|---|---|---|
| Quadrant | BADHDUFLAG | Total packets | Discarded packets |
| A | 0 | 14984 | 3 |
| B | 0 | 15593 | 2 |
| C | 0 | 12994 | 2 |
| D | 0 | 27964 | 2 |
| Mode M9 | |||
|---|---|---|---|
| Quadrant | BADHDUFLAG | Total packets | Discarded packets |
| A | 0 | 18 | 0 |
| B | 0 | 18 | 0 |
| C | 0 | 18 | 0 |
| D | 0 | 19 | 0 |
| Quadrant | Total seconds | Saturated seconds | Saturation percentage |
|---|---|---|---|
| A | 6328 | 98 | 1.548673% |
| B | 6328 | 105 | 1.659292% |
| C | 6328 | 22 | 0.347661% |
| D | 6328 | 2287 | 36.140961% |
Noise dominated data is calculated using 1-second bins in cleaned event files. If a bin has >2000 counts, and if more than 50% of those come from <1% of pixels, then it is considered to be noise-dominated and hence unusable.
| Quadrant | # 1 sec bins | Bins with >0 counts | Bins with >2000 counts | High rate bins dominated by noise | Noise dominated (total time) | Noise dominated (detector-on time) | Marked lightcurve |
|---|---|---|---|---|---|---|---|
| A | 7618 | 6329 | 46 | 46 | 0.60% | 0.73% | 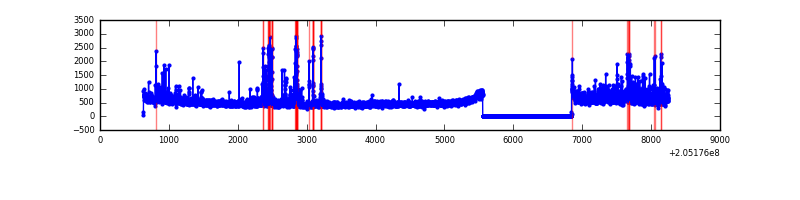 |
| B | 7618 | 6329 | 28 | 28 | 0.37% | 0.44% | 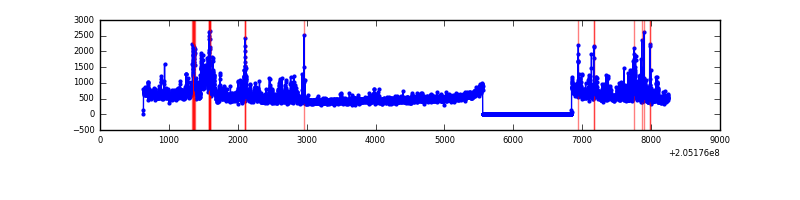 |
| C | 7618 | 6329 | 1 | 1 | 0.01% | 0.02% | 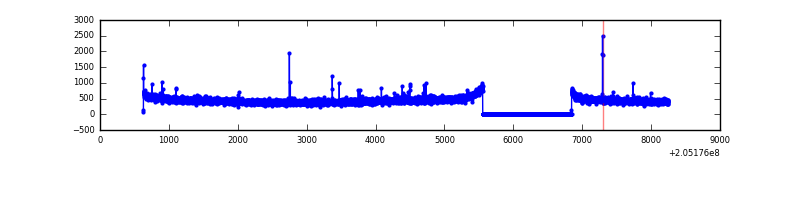 |
| D | 7618 | 6329 | 2169 | 2169 | 28.47% | 34.27% | 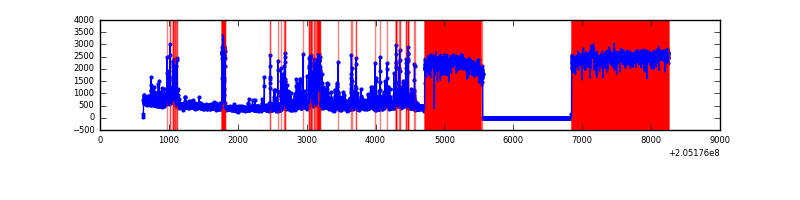 |
Top three noisy pixels from each quadrant. If the there are fewer than three noisy pixels in the level2.evt file, extra rows are filled as -1
| Pixel properties | Quadrant properties | ||||||
|---|---|---|---|---|---|---|---|
| Quadrant | DetID | PixID | Counts | Sigma | Mean | Median | Sigma |
| A | 0 | 199 | 382517 | 2500.38 | 749 | 736 | 152.7 |
| A | 0 | 50 | 191759 | 1251.06 | 749 | 736 | 152.7 |
| A | 0 | 226 | 44487 | 286.54 | 749 | 736 | 152.7 |
| B | 15 | 204 | 276016 | 1915.82 | 755 | 737 | 143.7 |
| B | 14 | 167 | 187782 | 1301.75 | 755 | 737 | 143.7 |
| B | 8 | 3 | 135055 | 934.79 | 755 | 737 | 143.7 |
| C | 9 | 144 | 37500 | 224.1 | 713 | 716 | 164.1 |
| C | 12 | 4 | 11283 | 64.38 | 713 | 716 | 164.1 |
| C | 13 | 61 | 5951 | 31.89 | 713 | 716 | 164.1 |
| D | 2 | 37 | 4441016 | 28842.18 | 635 | 618 | 154.0 |
| D | 2 | 63 | 432447 | 2804.9 | 635 | 618 | 154.0 |
| D | 12 | 233 | 353902 | 2294.72 | 635 | 618 | 154.0 |
Histogram calculated using DETX and DETY for each event in the final _common_clean file
| Quadrant A | 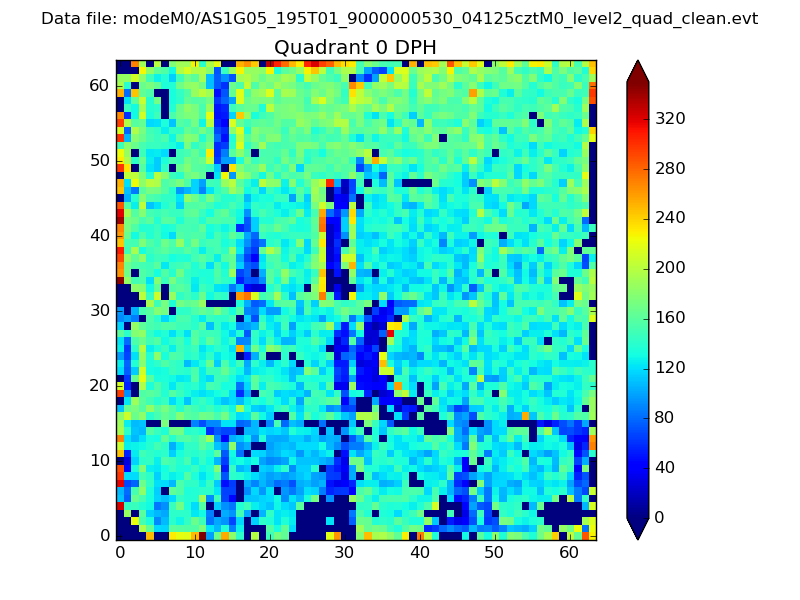 |
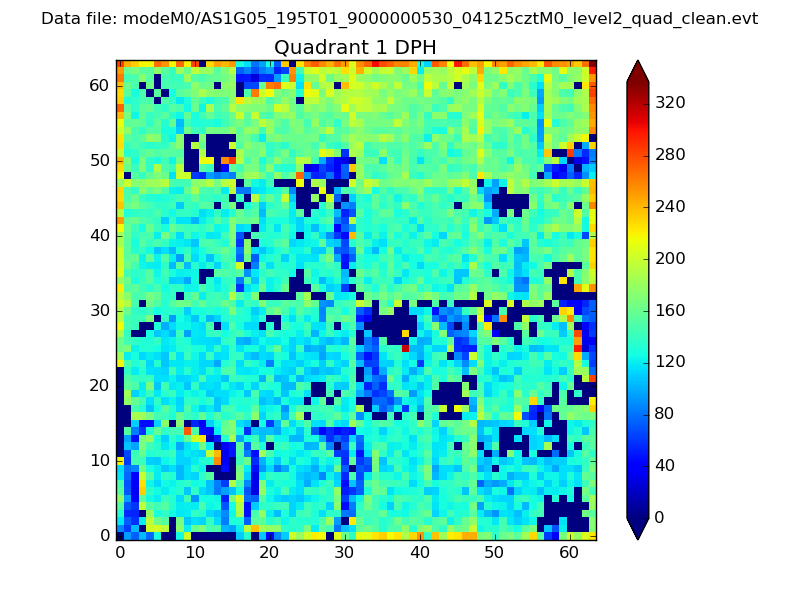 |
Quadrant B |
|---|---|---|---|
| Quadrant D | 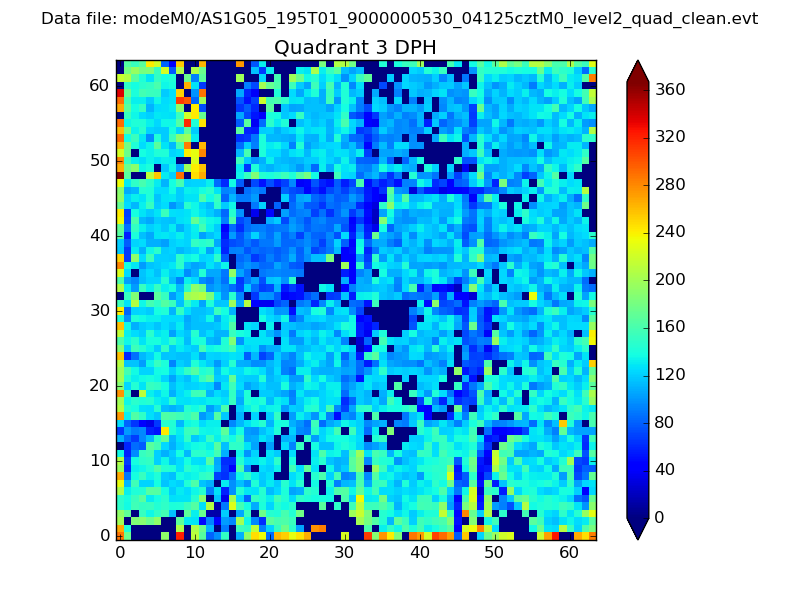 |
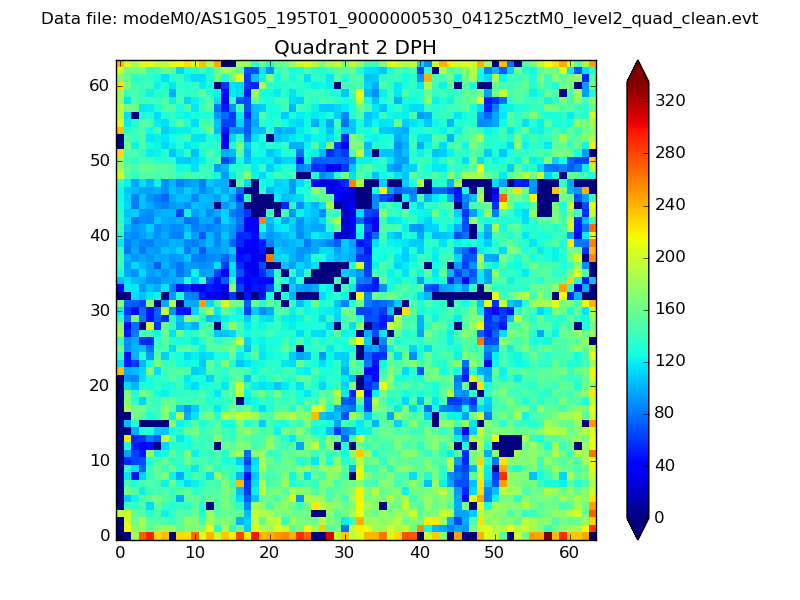 |
Quadrant C |
| Plot type | Count rate plots | Images |
|---|---|---|
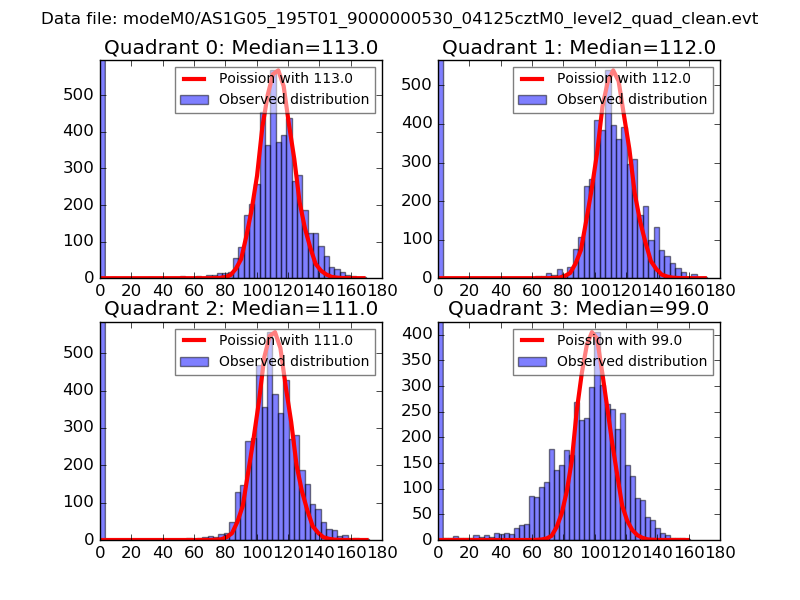
| Comparison with Poisson distribution Blue bars denote a histogram of data divided into 1 sec bins. Red curve is a Poisson curve with rate = median count rate of data. |
 |
 |
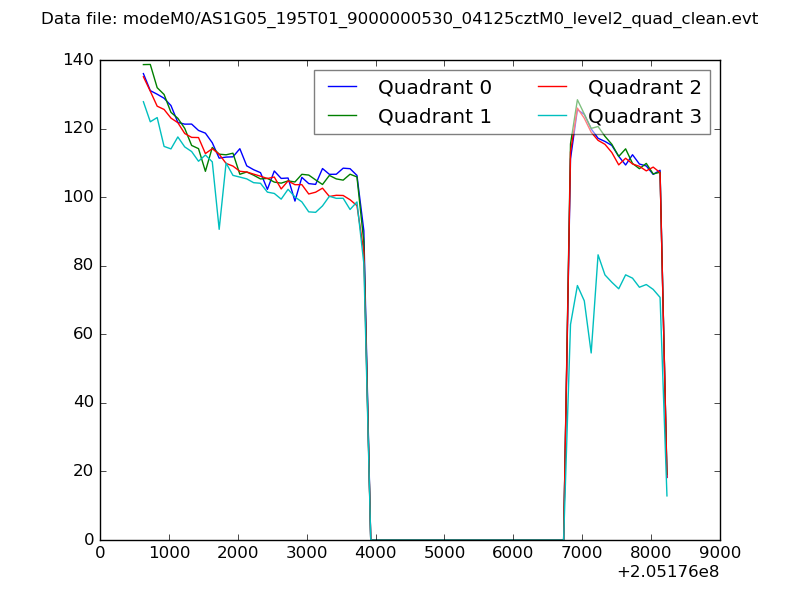
| Quadrant-wise count rates Data is divided into 100 sec bins |
 |
|
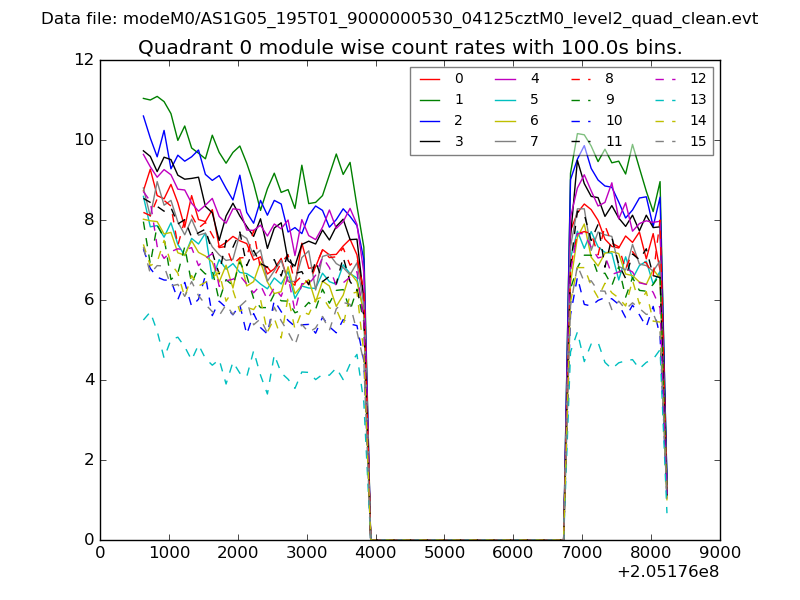
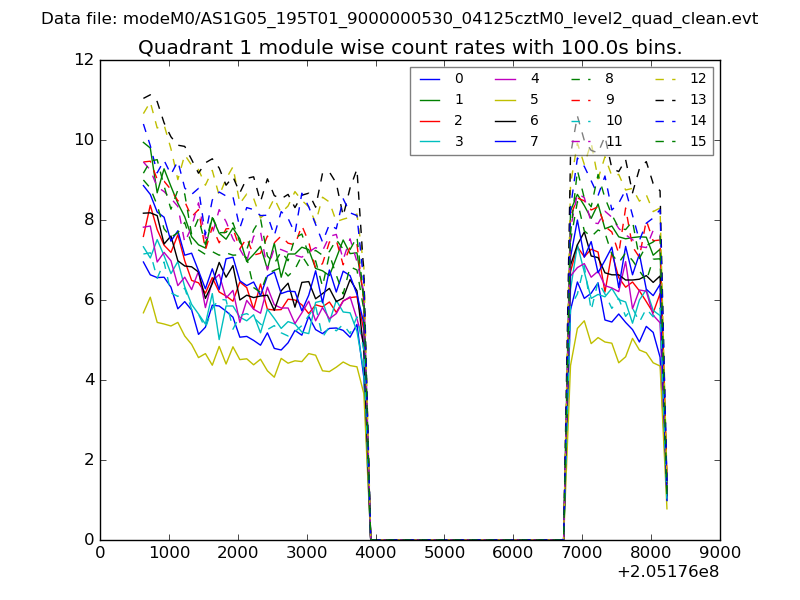
| Module-wise count rates for Quadrant A Data is divided into 100 sec bins |
 |
 |
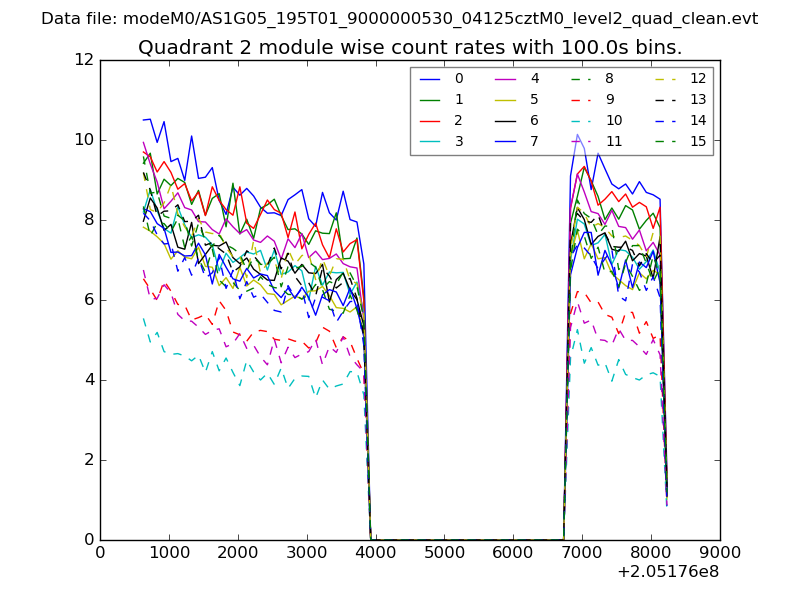
| Module-wise count rates for Quadrant B Data is divided into 100 sec bins |
 |
 |
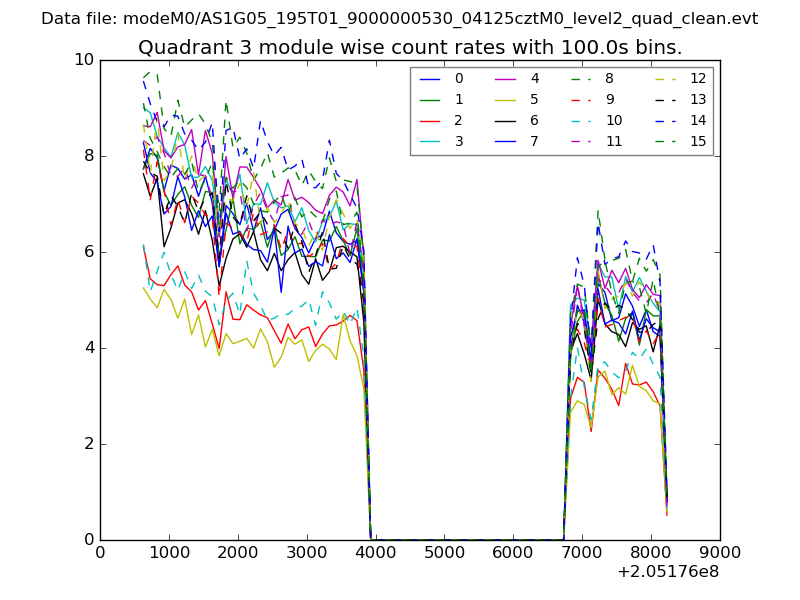
| Module-wise count rates for Quadrant C Data is divided into 100 sec bins |
 |
 |
| Module-wise count rates for Quadrant D Data is divided into 100 sec bins |
 |
 |
| Parameter | Plot |
|---|---|
| CZT HV Monitor | 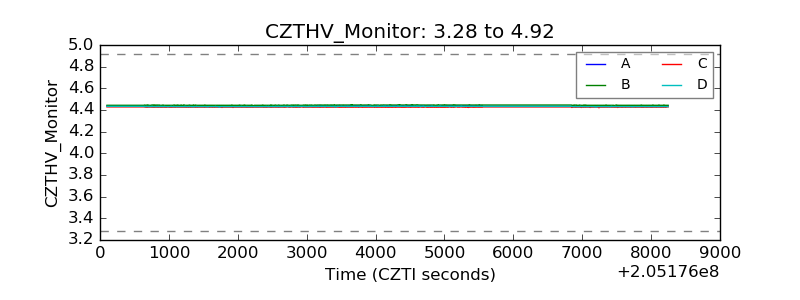 |
| D_VDD | 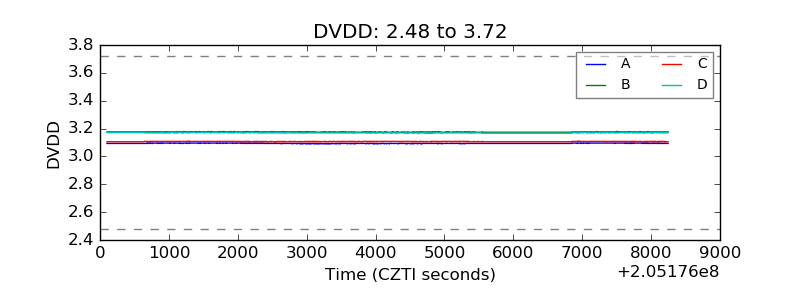 |
| Temperature 1 | 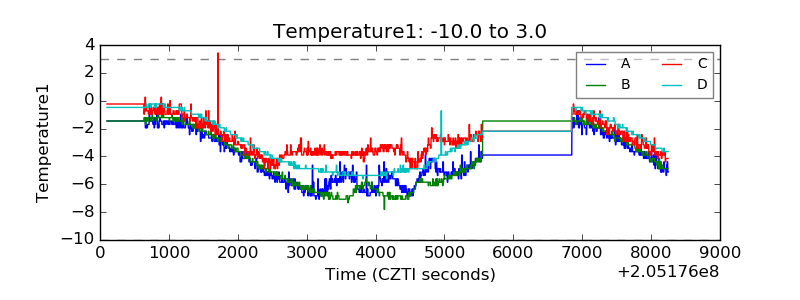 |
| Veto HV Monitor | 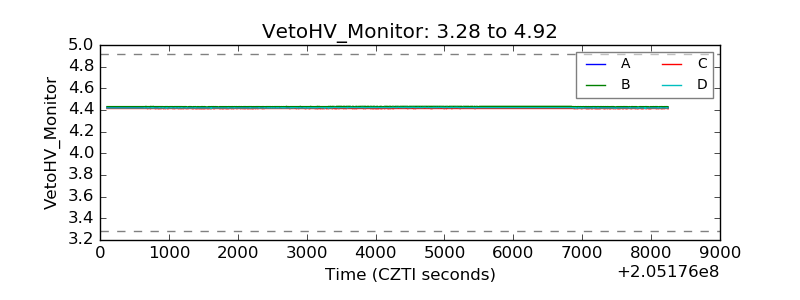 |
| Veto LLD | 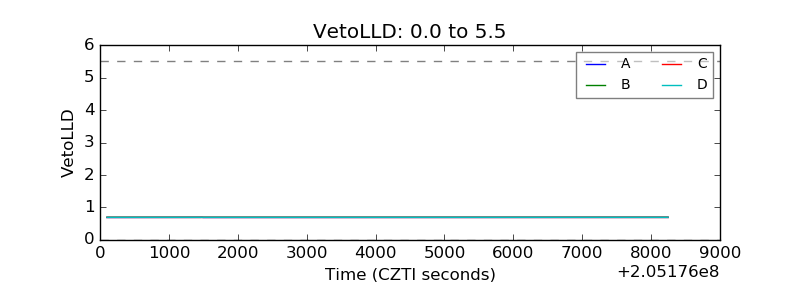 |
| Alpha Counter | 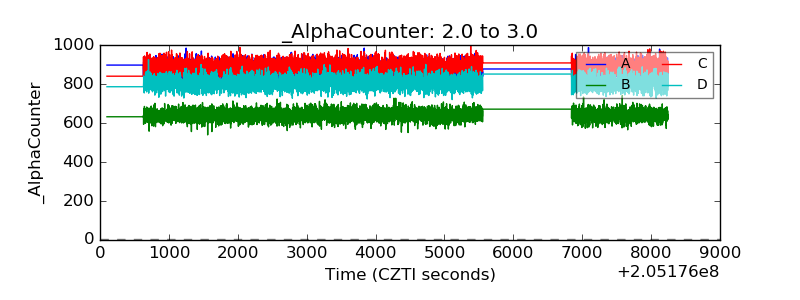 |
| _CPM_Rate | 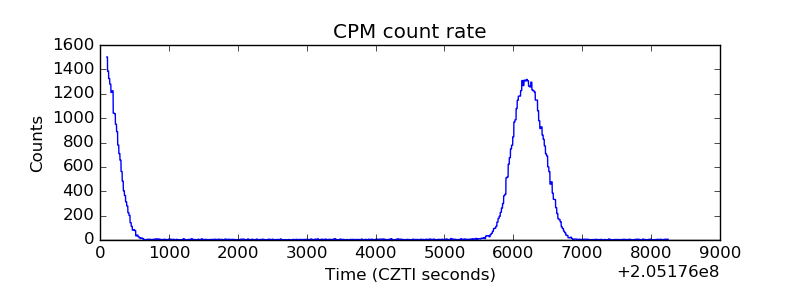 |
| CZT Counter | 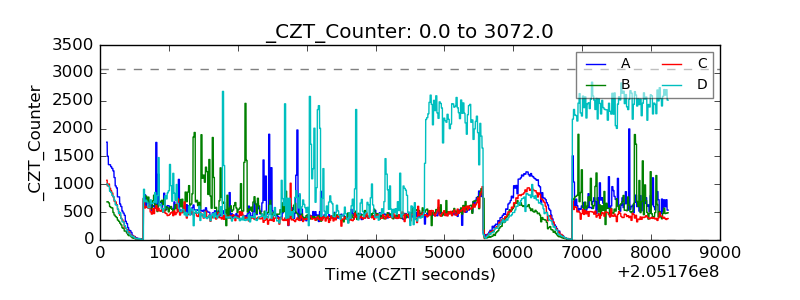 |
| +2.5 Volts monitor |  |
| +5 Volts monitor |  |
| _ROLL_ROT | 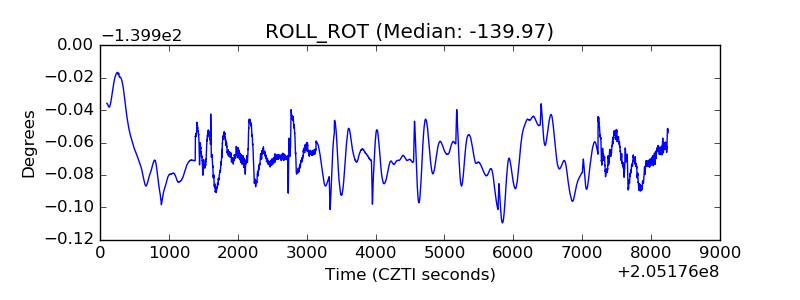 |
| _Roll_DEC | 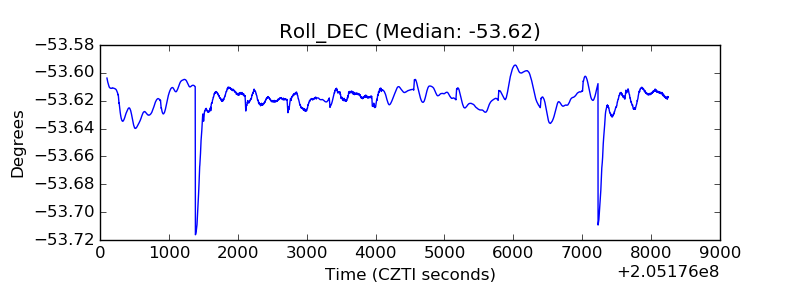 |
| _Roll_RA | 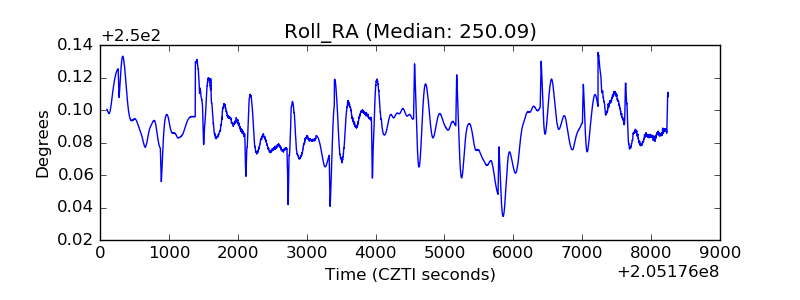 |
| Veto Counter | 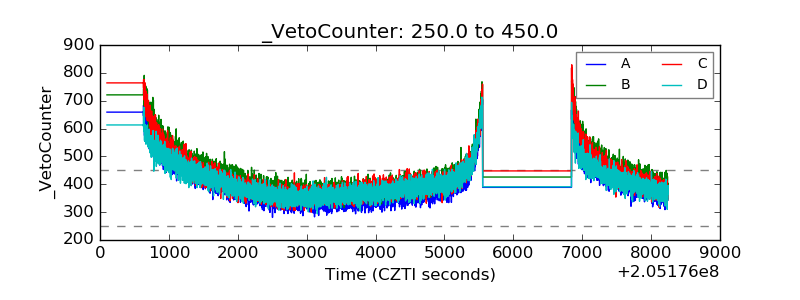 |