| Param | Original file | Final file |
|---|---|---|
| Filename | modeM0/AS1G05_195T01_9000000530_04126cztM0_level2.evt | modeM0/AS1G05_195T01_9000000530_04126cztM0_level2_quad_clean.evt |
| Size (bytes) | 838,866,240 | 76,380,480 |
| Size | 800.0 MB | 72.8 MB |
| Events in quadrant A | 4,618,363 | 500,260 |
| Events in quadrant B | 3,477,006 | 512,077 |
| Events in quadrant C | 3,028,807 | 502,975 |
| Events in quadrant D | 13,854,529 | 355,800 |
| Mode SS | |||
|---|---|---|---|
| Quadrant | BADHDUFLAG | Total packets | Discarded packets |
| A | 0 | 128 | 0 |
| B | 0 | 128 | 0 |
| C | 0 | 128 | 0 |
| D | 0 | 128 | 0 |
| Mode M0 | |||
|---|---|---|---|
| Quadrant | BADHDUFLAG | Total packets | Discarded packets |
| A | 0 | 18048 | 3 |
| B | 0 | 14624 | 2 |
| C | 0 | 13633 | 2 |
| D | 0 | 45492 | 2 |
| Mode M9 | |||
|---|---|---|---|
| Quadrant | BADHDUFLAG | Total packets | Discarded packets |
| A | 0 | 17 | 0 |
| B | 0 | 17 | 0 |
| C | 0 | 17 | 0 |
| D | 0 | 18 | 0 |
| Quadrant | Total seconds | Saturated seconds | Saturation percentage |
|---|---|---|---|
| A | 6299 | 516 | 8.191776% |
| B | 6299 | 82 | 1.301794% |
| C | 6299 | 39 | 0.619146% |
| D | 6299 | 5437 | 86.315288% |
Noise dominated data is calculated using 1-second bins in cleaned event files. If a bin has >2000 counts, and if more than 50% of those come from <1% of pixels, then it is considered to be noise-dominated and hence unusable.
| Quadrant | # 1 sec bins | Bins with >0 counts | Bins with >2000 counts | High rate bins dominated by noise | Noise dominated (total time) | Noise dominated (detector-on time) | Marked lightcurve |
|---|---|---|---|---|---|---|---|
| A | 7524 | 6300 | 184 | 184 | 2.45% | 2.92% | 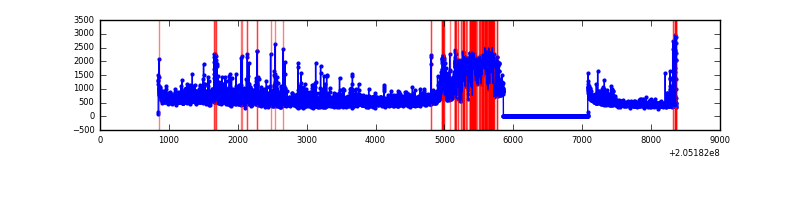 |
| B | 7524 | 6300 | 32 | 32 | 0.43% | 0.51% | 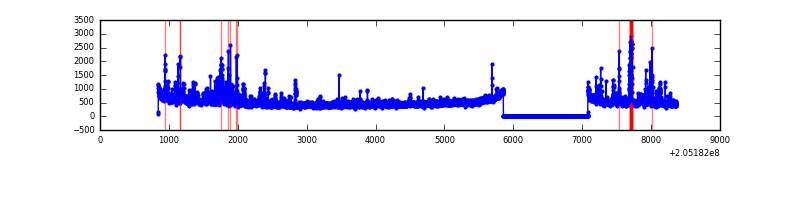 |
| C | 7524 | 6300 | 4 | 4 | 0.05% | 0.06% | 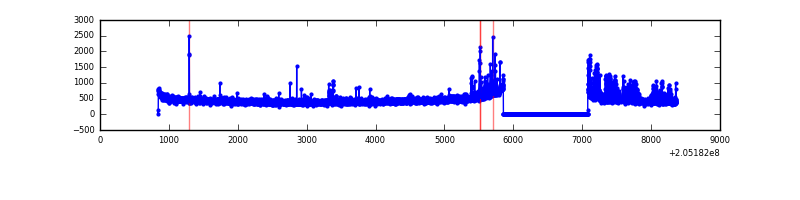 |
| D | 7524 | 6300 | 5346 | 5346 | 71.05% | 84.86% | 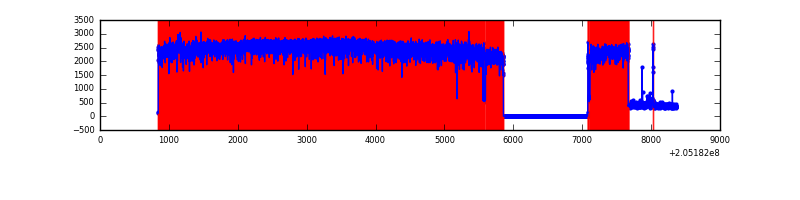 |
Top three noisy pixels from each quadrant. If the there are fewer than three noisy pixels in the level2.evt file, extra rows are filled as -1
| Pixel properties | Quadrant properties | ||||||
|---|---|---|---|---|---|---|---|
| Quadrant | DetID | PixID | Counts | Sigma | Mean | Median | Sigma |
| A | 0 | 50 | 937152 | 6476.05 | 707 | 693 | 144.6 |
| A | 0 | 199 | 813581 | 5621.5 | 707 | 693 | 144.6 |
| A | 0 | 226 | 81666 | 559.97 | 707 | 693 | 144.6 |
| B | 15 | 204 | 228208 | 1614.83 | 737 | 721 | 140.9 |
| B | 5 | 184 | 129253 | 912.39 | 737 | 721 | 140.9 |
| B | 4 | 48 | 121085 | 854.41 | 737 | 721 | 140.9 |
| C | 9 | 144 | 279111 | 1715.02 | 697 | 700 | 162.3 |
| C | 10 | 65 | 16857 | 99.53 | 697 | 700 | 162.3 |
| C | 12 | 4 | 9237 | 52.59 | 697 | 700 | 162.3 |
| D | 2 | 37 | 11432610 | 89223.5 | 532 | 518 | 128.1 |
| D | 12 | 233 | 168270 | 1309.25 | 532 | 518 | 128.1 |
| D | 10 | 40 | 88303 | 685.13 | 532 | 518 | 128.1 |
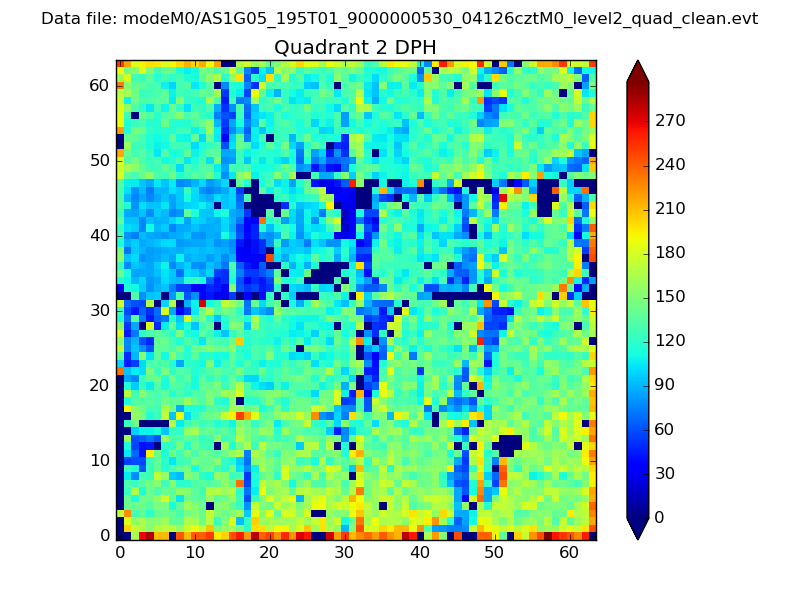
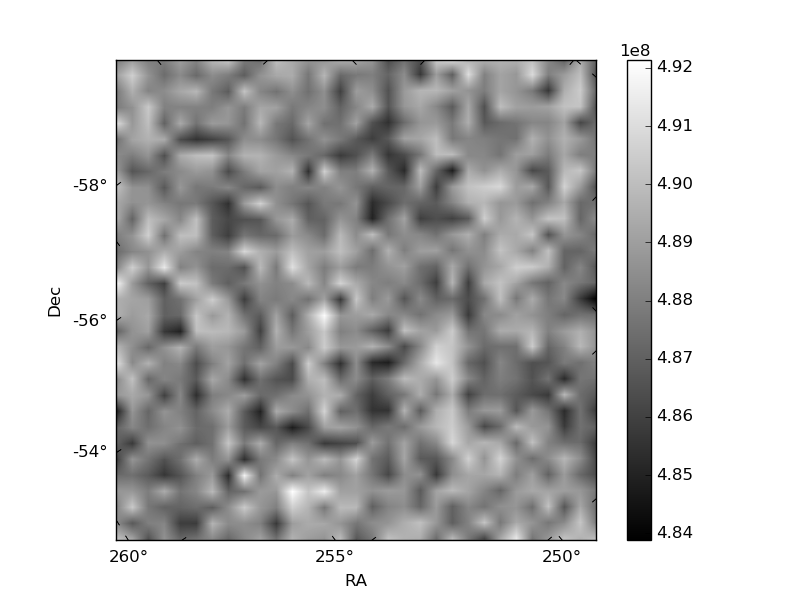
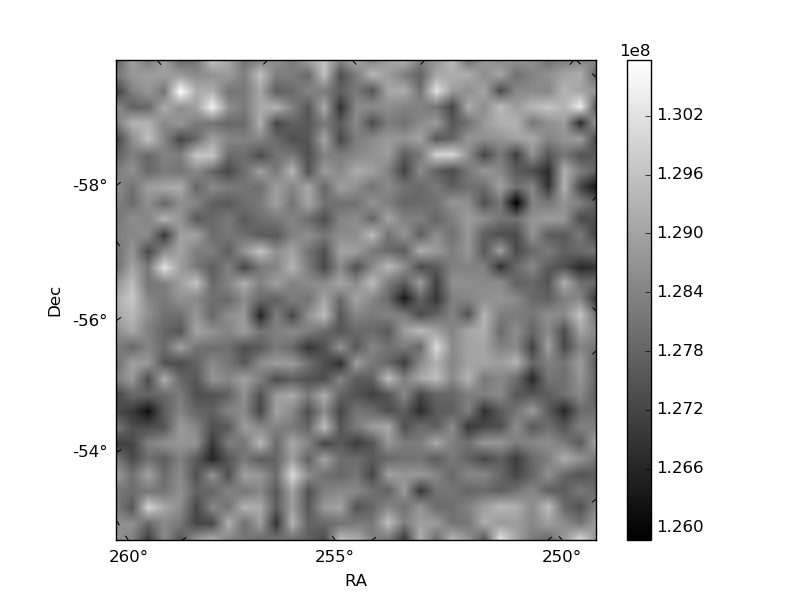
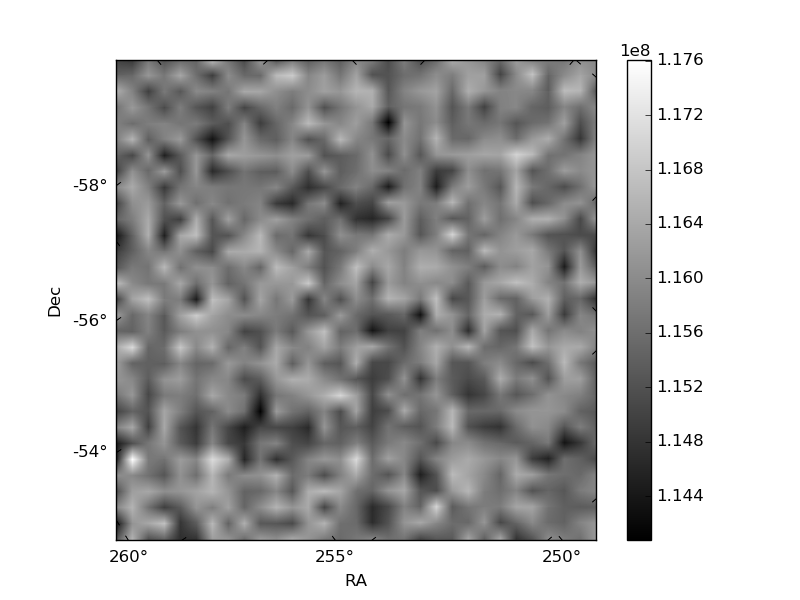
Histogram calculated using DETX and DETY for each event in the final _common_clean file
| Quadrant A | 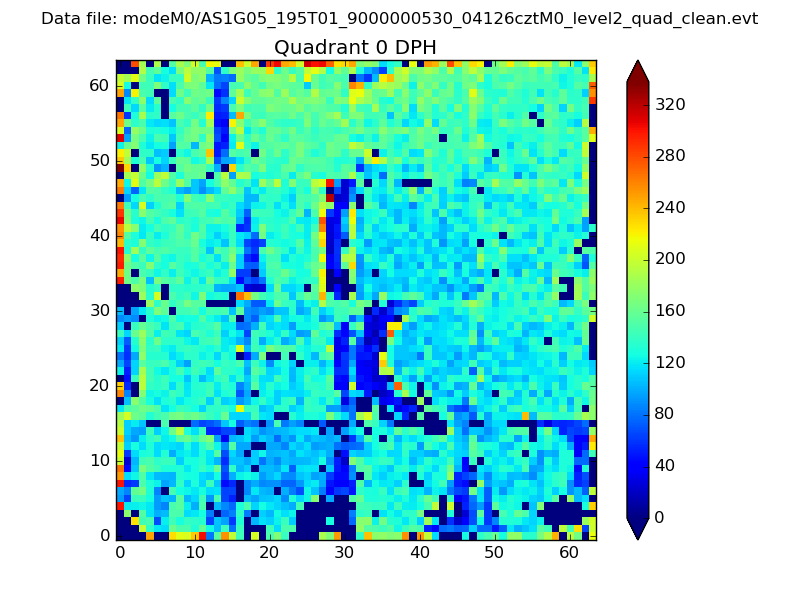 |
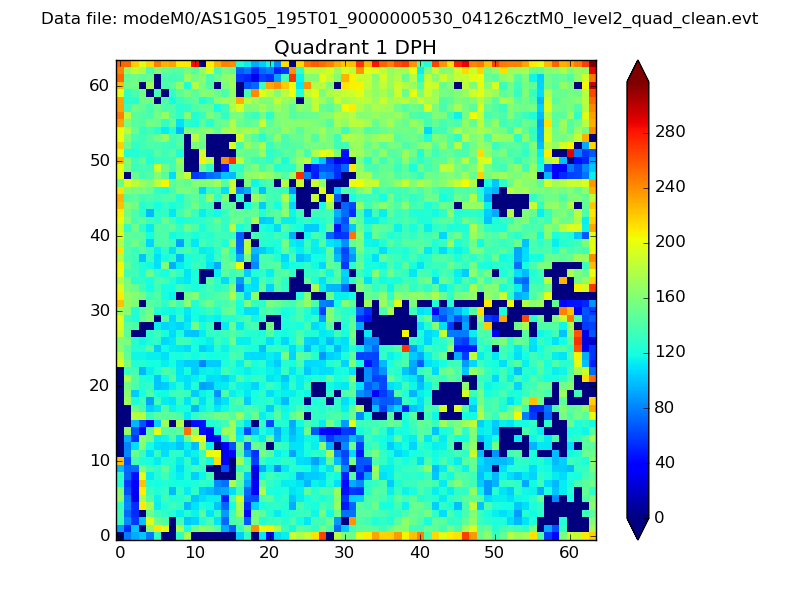 |
Quadrant B |
|---|---|---|---|
| Quadrant D | 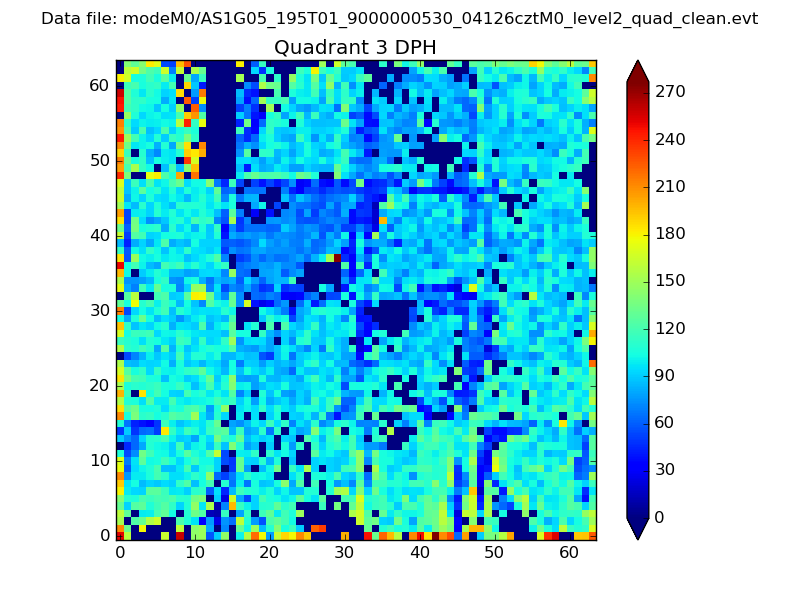 |
 |
Quadrant C |
| Plot type | Count rate plots | Images |
|---|---|---|
| Comparison with Poisson distribution Blue bars denote a histogram of data divided into 1 sec bins. Red curve is a Poisson curve with rate = median count rate of data. |
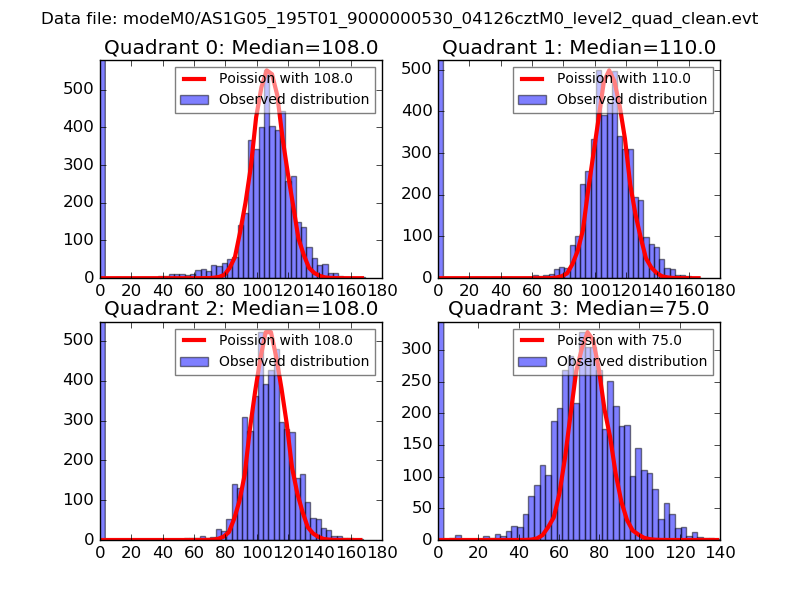 |
 |
| Quadrant-wise count rates Data is divided into 100 sec bins |
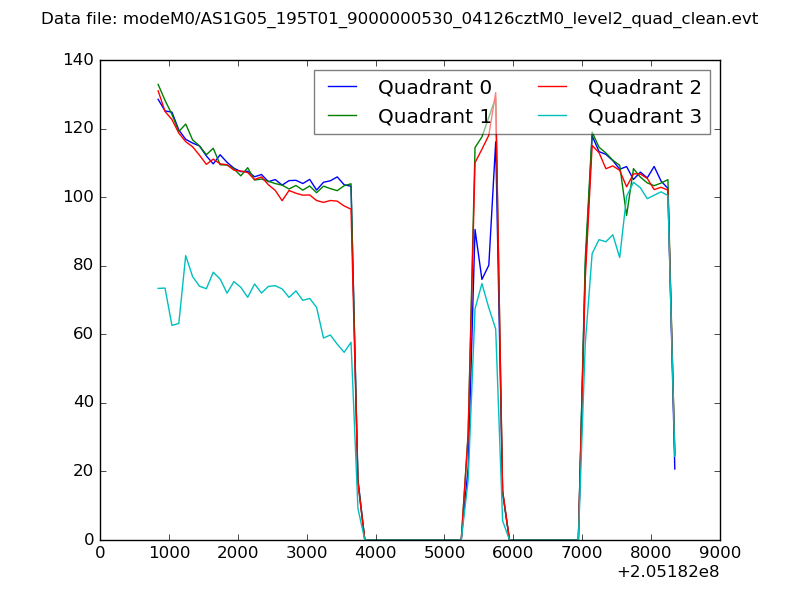 |
|
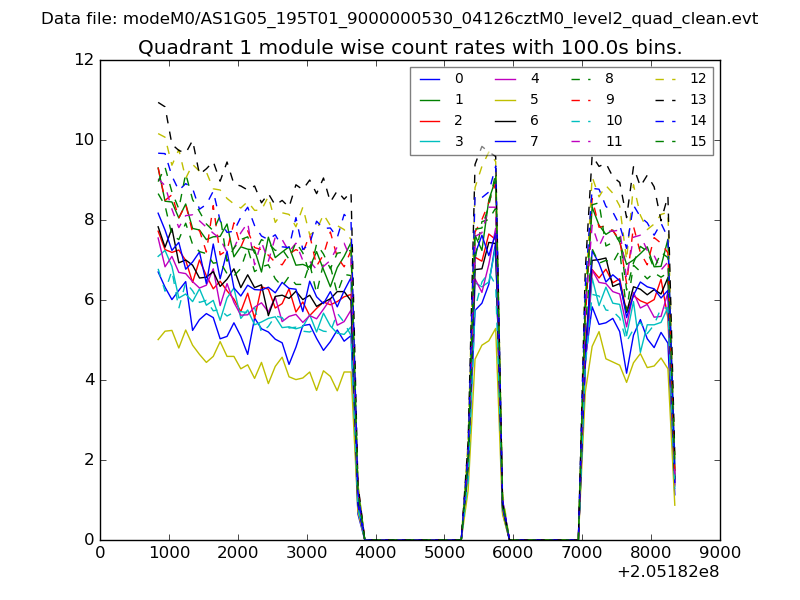
| Module-wise count rates for Quadrant A Data is divided into 100 sec bins |
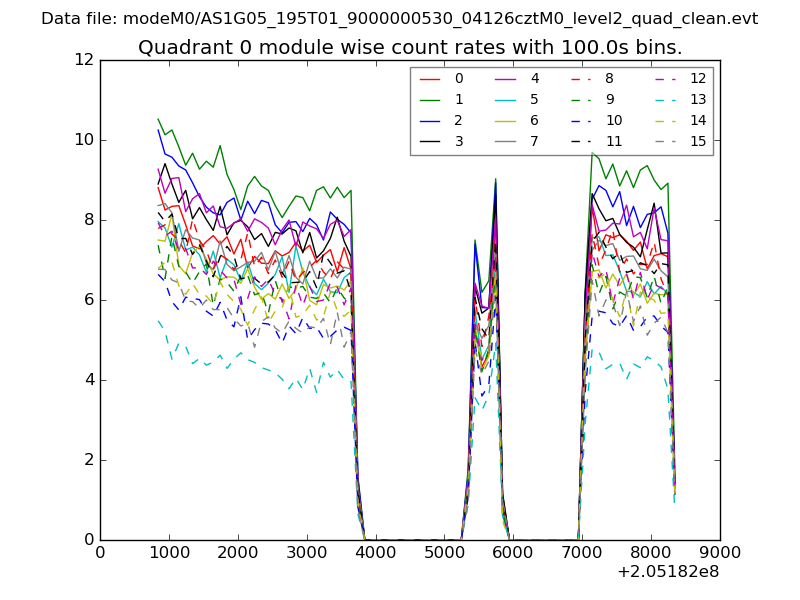 |
 |
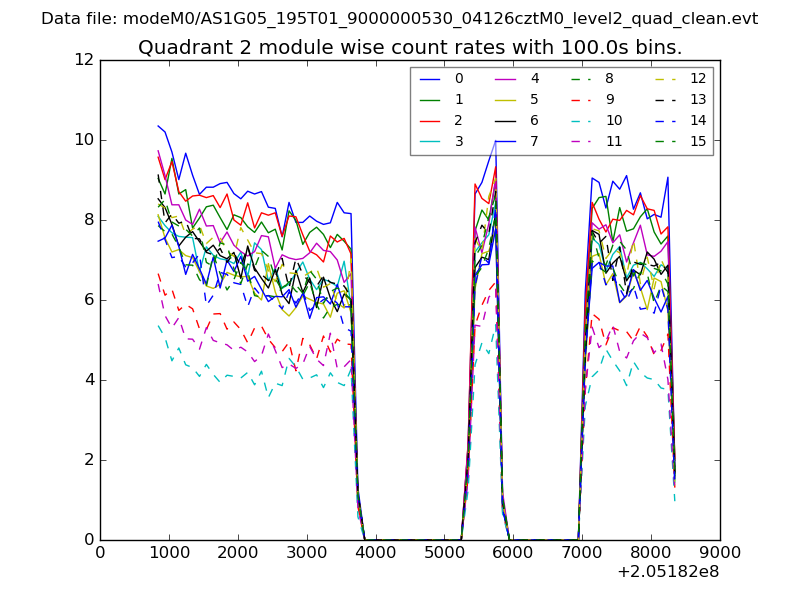
| Module-wise count rates for Quadrant B Data is divided into 100 sec bins |
 |
 |
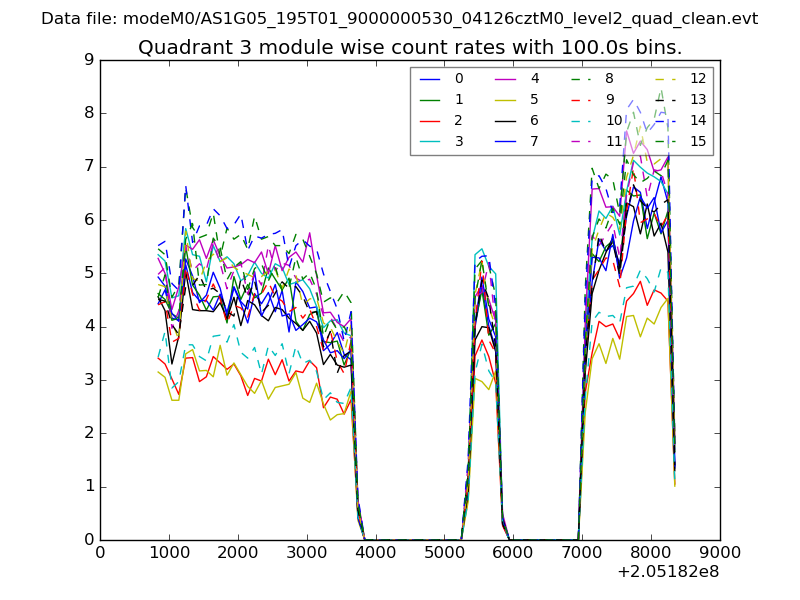
| Module-wise count rates for Quadrant C Data is divided into 100 sec bins |
 |
 |
| Module-wise count rates for Quadrant D Data is divided into 100 sec bins |
 |
 |
| Parameter | Plot |
|---|---|
| CZT HV Monitor | 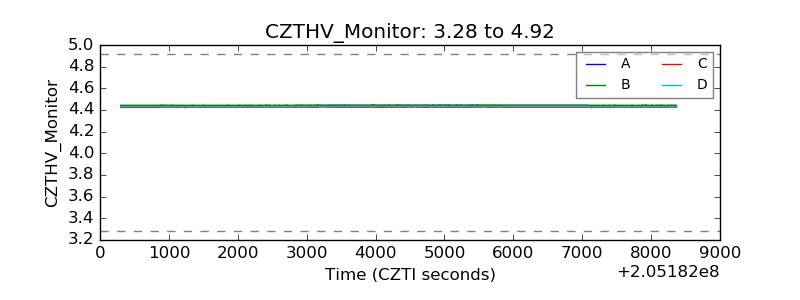 |
| D_VDD | 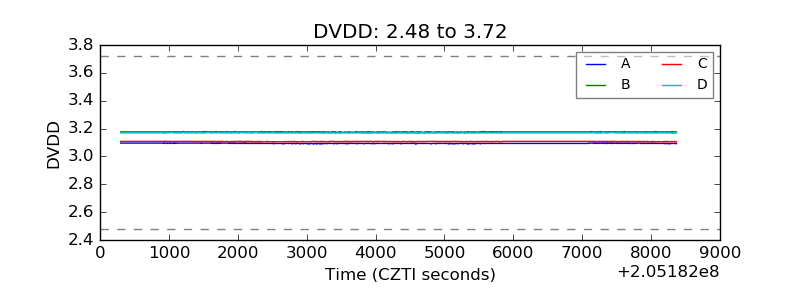 |
| Temperature 1 | 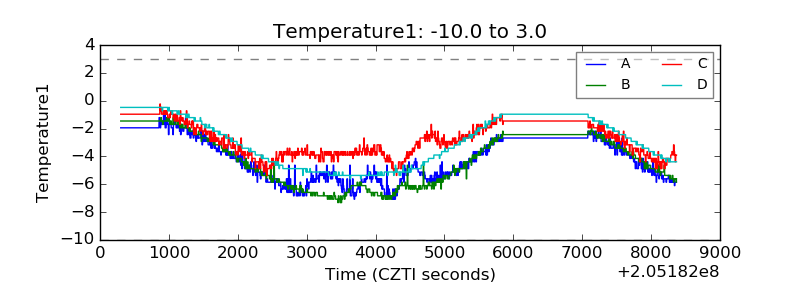 |
| Veto HV Monitor | 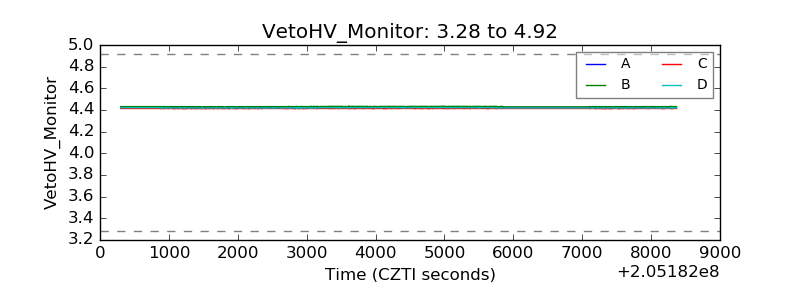 |
| Veto LLD | 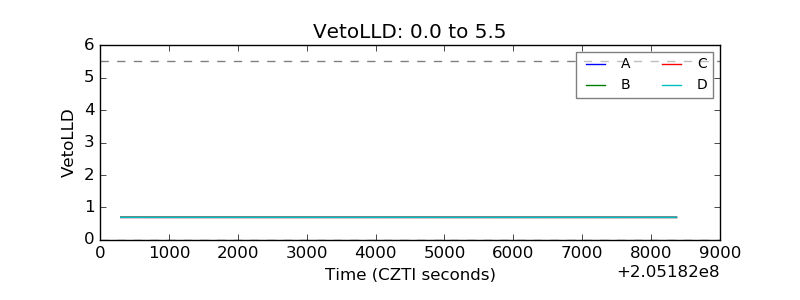 |
| Alpha Counter | 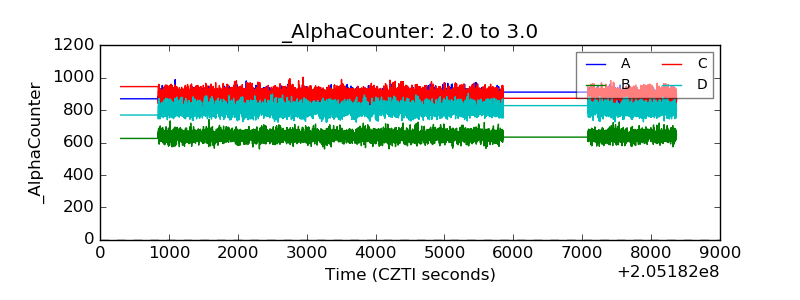 |
| _CPM_Rate | 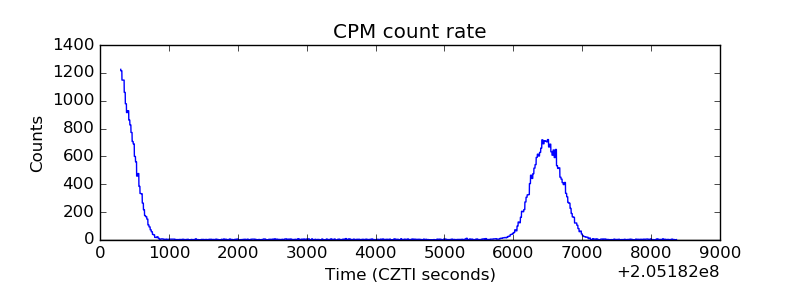 |
| CZT Counter | 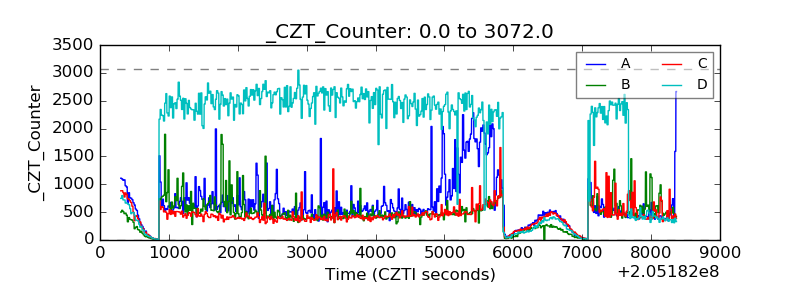 |
| +2.5 Volts monitor |  |
| +5 Volts monitor |  |
| _ROLL_ROT | 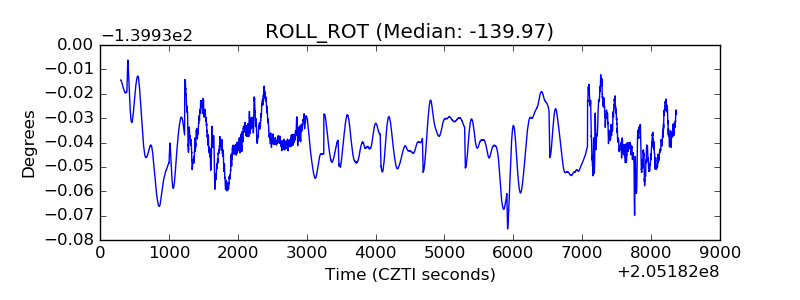 |
| _Roll_DEC | 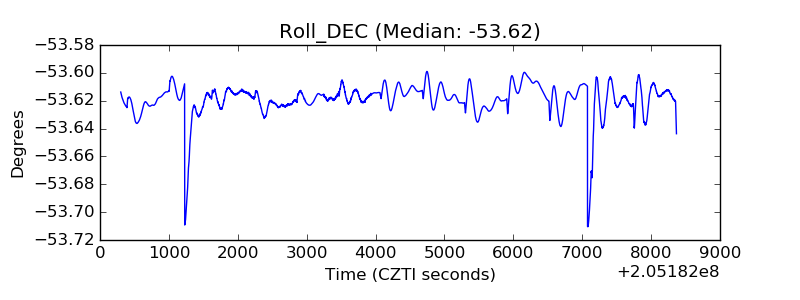 |
| _Roll_RA | 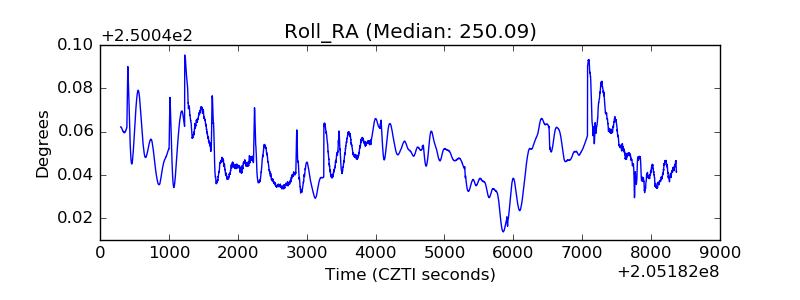 |
| Veto Counter | 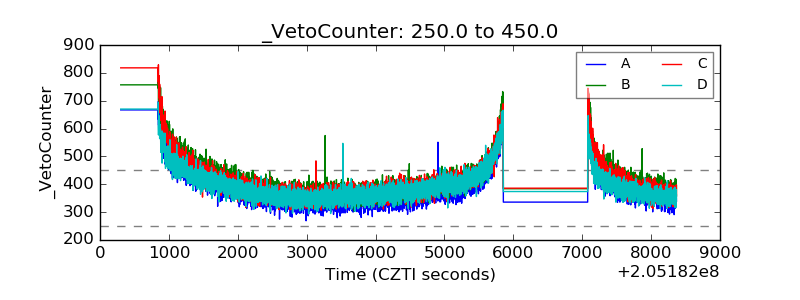 |