| Param | Original file | Final file |
|---|---|---|
| Filename | modeM0/AS1G05_195T01_9000000530_04128cztM0_level2.evt | modeM0/AS1G05_195T01_9000000530_04128cztM0_level2_quad_clean.evt |
| Size (bytes) | 536,739,840 | 92,563,200 |
| Size | 511.9 MB | 88.3 MB |
| Events in quadrant A | 3,807,501 | 585,904 |
| Events in quadrant B | 4,576,640 | 574,097 |
| Events in quadrant C | 3,259,883 | 577,002 |
| Events in quadrant D | 4,114,578 | 556,679 |
| Mode SS | |||
|---|---|---|---|
| Quadrant | BADHDUFLAG | Total packets | Discarded packets |
| A | 0 | 148 | 0 |
| B | 0 | 148 | 0 |
| C | 0 | 148 | 0 |
| D | 0 | 148 | 0 |
| Mode M0 | |||
|---|---|---|---|
| Quadrant | BADHDUFLAG | Total packets | Discarded packets |
| A | 0 | 16534 | 3 |
| B | 0 | 18617 | 2 |
| C | 0 | 15070 | 2 |
| D | 0 | 17733 | 2 |
| Mode M9 | |||
|---|---|---|---|
| Quadrant | BADHDUFLAG | Total packets | Discarded packets |
| A | 0 | 13 | 0 |
| B | 0 | 13 | 0 |
| C | 0 | 13 | 0 |
| D | 0 | 14 | 0 |
| Quadrant | Total seconds | Saturated seconds | Saturation percentage |
|---|---|---|---|
| A | 7310 | 124 | 1.696306% |
| B | 7310 | 328 | 4.487004% |
| C | 7310 | 16 | 0.218878% |
| D | 7310 | 199 | 2.722298% |
Noise dominated data is calculated using 1-second bins in cleaned event files. If a bin has >2000 counts, and if more than 50% of those come from <1% of pixels, then it is considered to be noise-dominated and hence unusable.
| Quadrant | # 1 sec bins | Bins with >0 counts | Bins with >2000 counts | High rate bins dominated by noise | Noise dominated (total time) | Noise dominated (detector-on time) | Marked lightcurve |
|---|---|---|---|---|---|---|---|
| A | 7975 | 7311 | 91 | 91 | 1.14% | 1.24% | 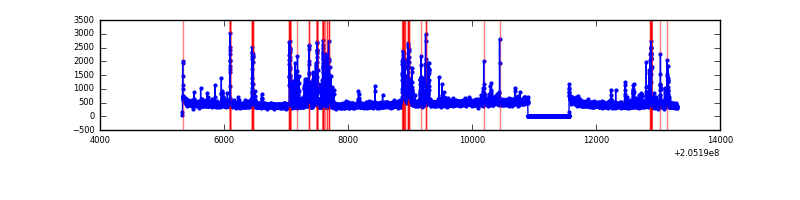 |
| B | 7975 | 7311 | 276 | 276 | 3.46% | 3.78% | 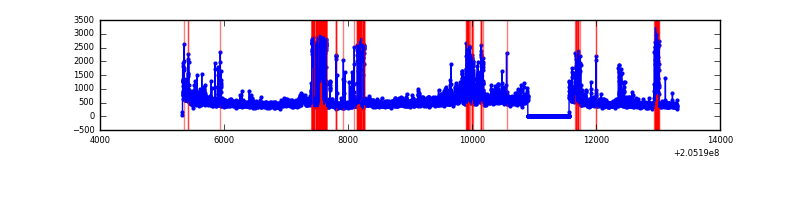 |
| C | 7975 | 7311 | 1 | 1 | 0.01% | 0.01% | 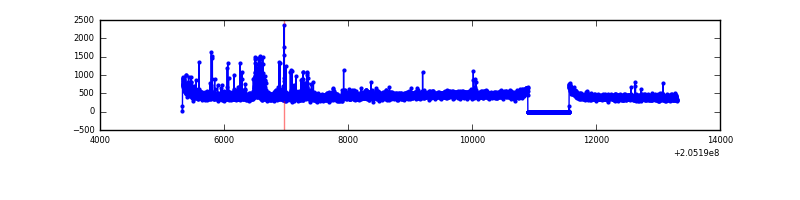 |
| D | 7975 | 7311 | 225 | 225 | 2.82% | 3.08% | 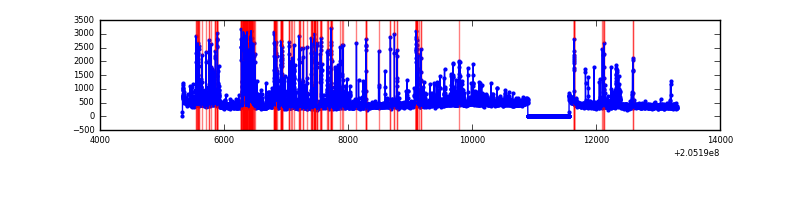 |
Top three noisy pixels from each quadrant. If the there are fewer than three noisy pixels in the level2.evt file, extra rows are filled as -1
| Pixel properties | Quadrant properties | ||||||
|---|---|---|---|---|---|---|---|
| Quadrant | DetID | PixID | Counts | Sigma | Mean | Median | Sigma |
| A | 0 | 50 | 620100 | 3793.9 | 800 | 782 | 163.2 |
| A | 0 | 199 | 25794 | 153.22 | 800 | 782 | 163.2 |
| A | 0 | 118 | 22415 | 132.52 | 800 | 782 | 163.2 |
| B | 10 | 16 | 806445 | 5257.88 | 802 | 783 | 153.2 |
| B | 15 | 204 | 307541 | 2001.95 | 802 | 783 | 153.2 |
| B | 4 | 48 | 138144 | 896.44 | 802 | 783 | 153.2 |
| C | 9 | 144 | 205272 | 1118.2 | 779 | 781 | 182.9 |
| C | 10 | 65 | 8576 | 42.62 | 779 | 781 | 182.9 |
| C | 13 | 61 | 6724 | 32.5 | 779 | 781 | 182.9 |
| D | 12 | 212 | 400283 | 2162.96 | 762 | 737 | 184.7 |
| D | 4 | 95 | 387291 | 2092.63 | 762 | 737 | 184.7 |
| D | 12 | 227 | 184693 | 995.85 | 762 | 737 | 184.7 |
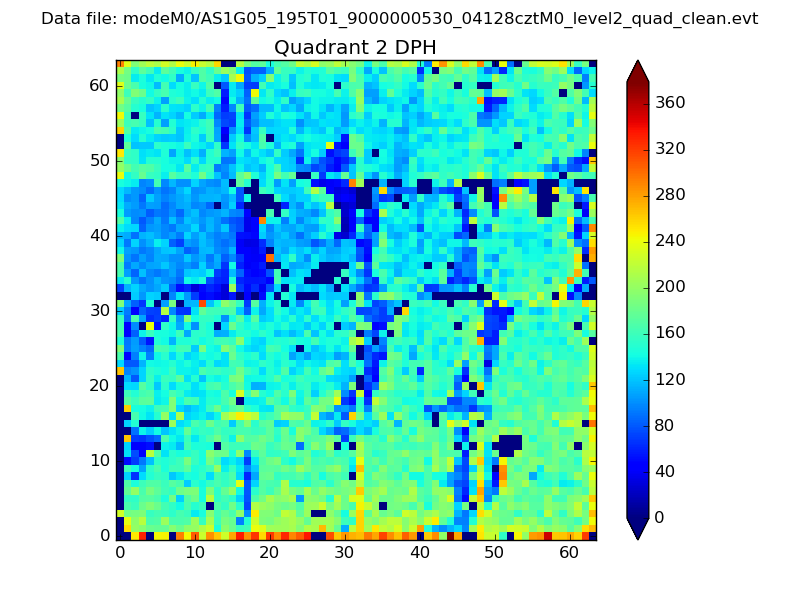
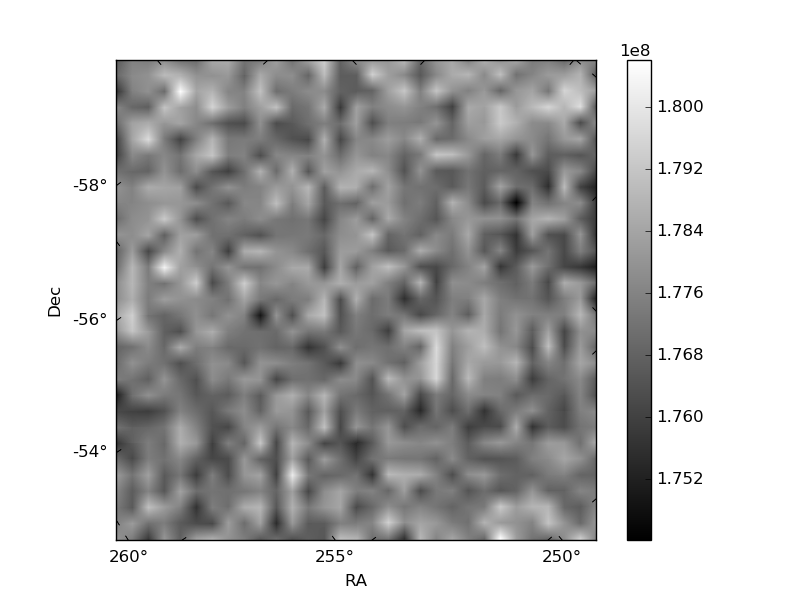
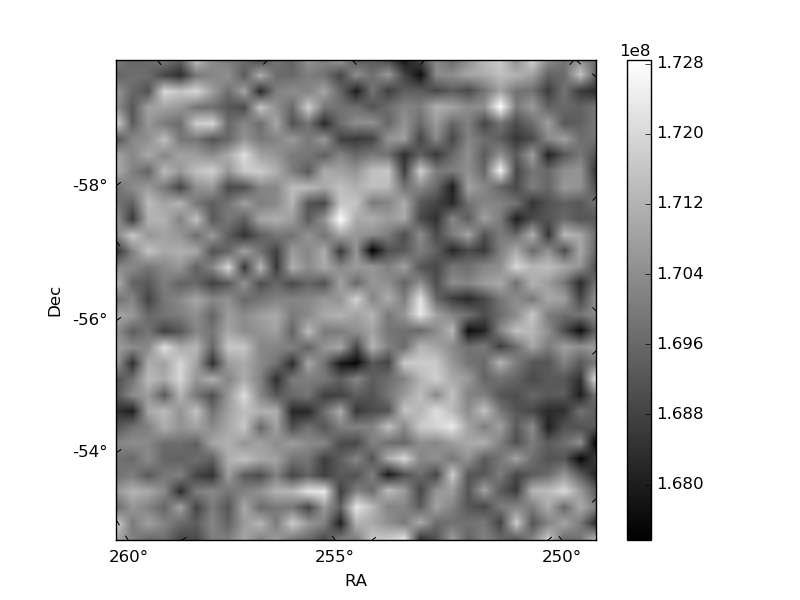
Histogram calculated using DETX and DETY for each event in the final _common_clean file
| Quadrant A | 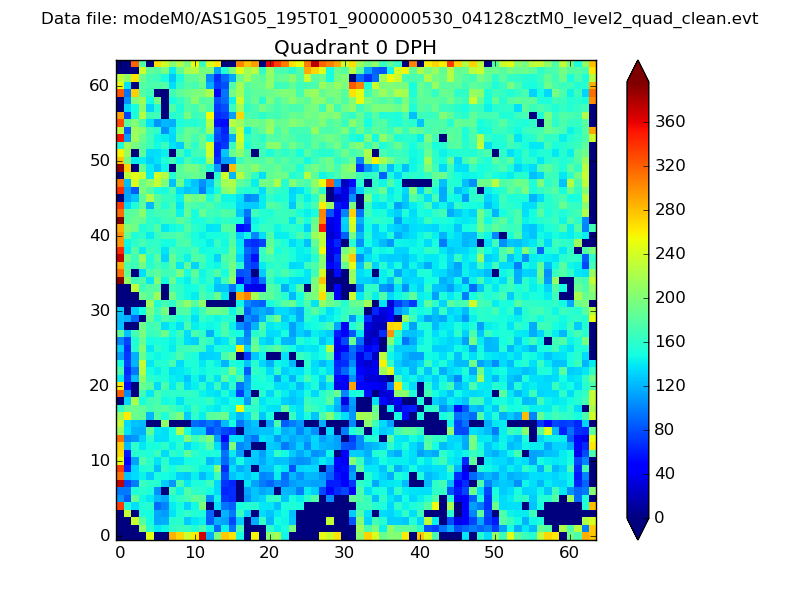 |
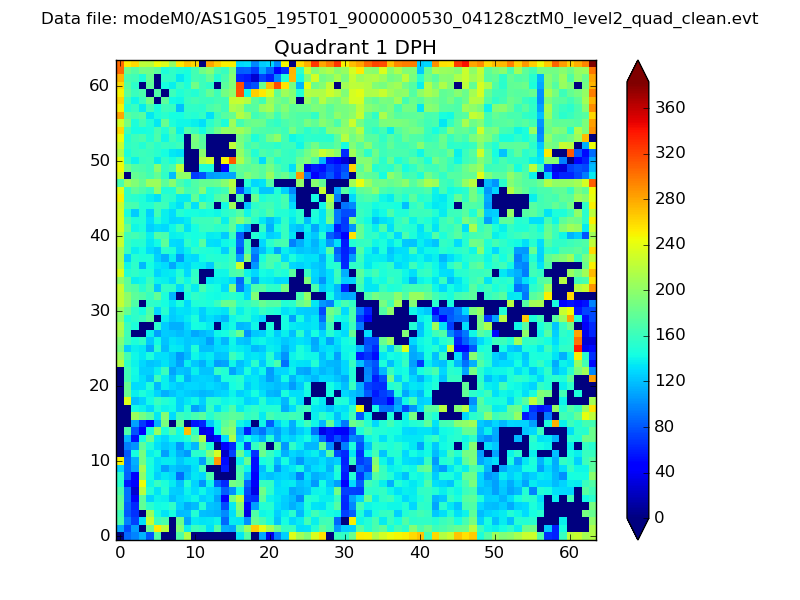 |
Quadrant B |
|---|---|---|---|
| Quadrant D | 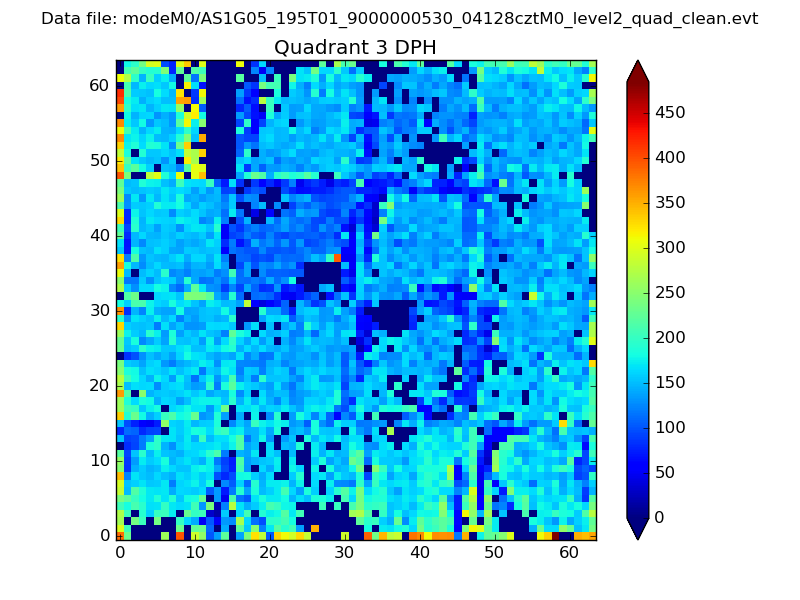 |
 |
Quadrant C |
| Plot type | Count rate plots | Images |
|---|---|---|
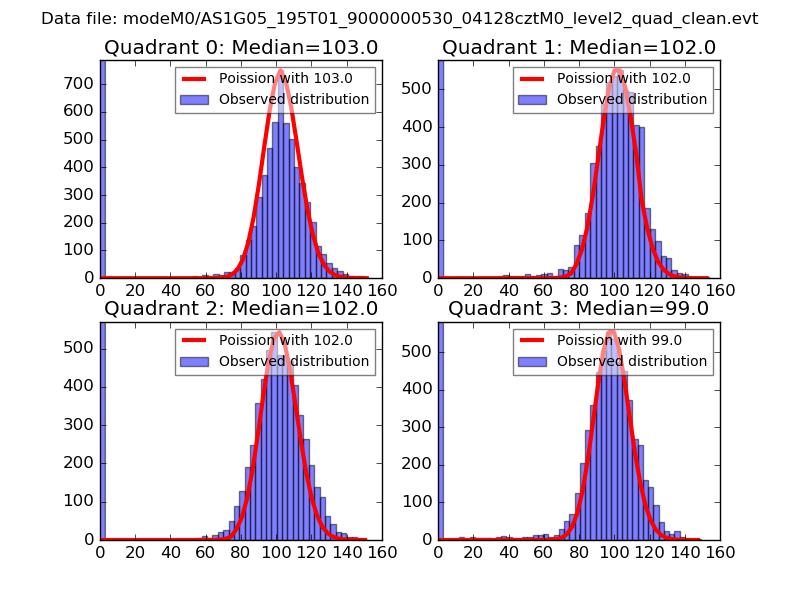
| Comparison with Poisson distribution Blue bars denote a histogram of data divided into 1 sec bins. Red curve is a Poisson curve with rate = median count rate of data. |
 |
 |
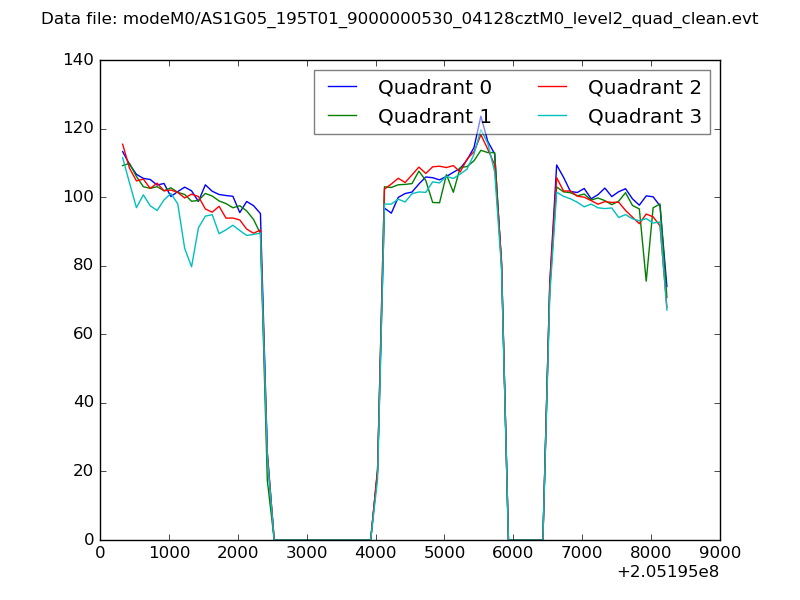
| Quadrant-wise count rates Data is divided into 100 sec bins |
 |
|
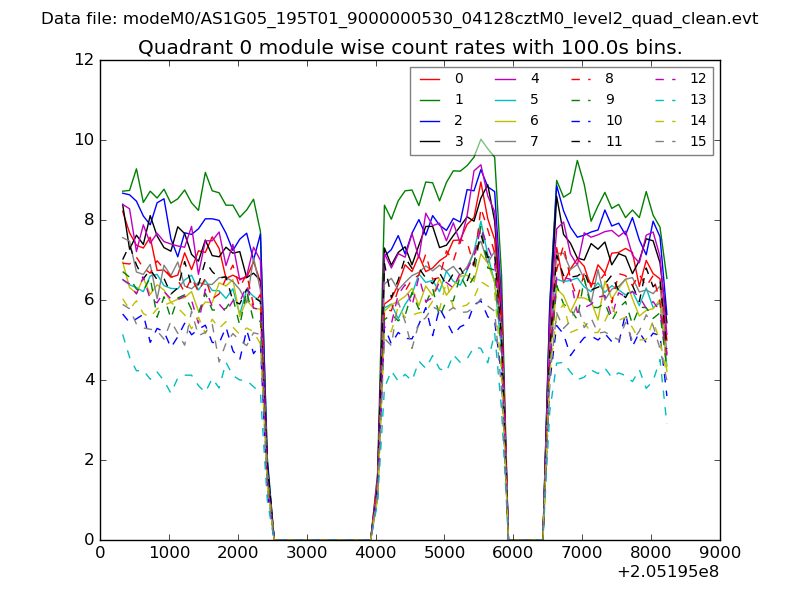
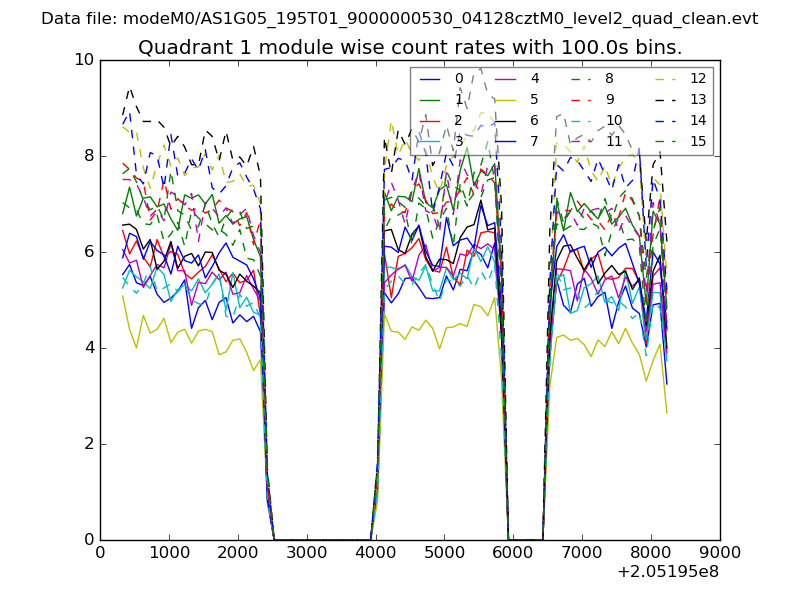
| Module-wise count rates for Quadrant A Data is divided into 100 sec bins |
 |
 |
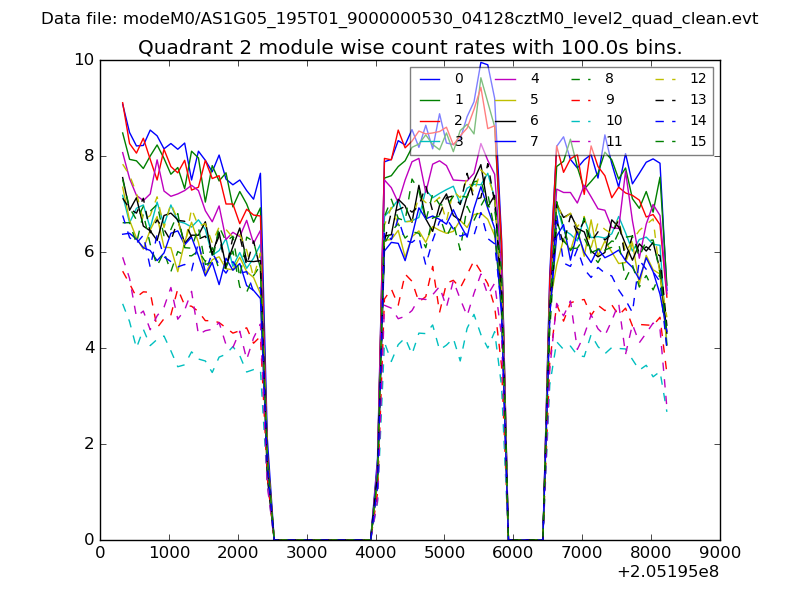
| Module-wise count rates for Quadrant B Data is divided into 100 sec bins |
 |
 |
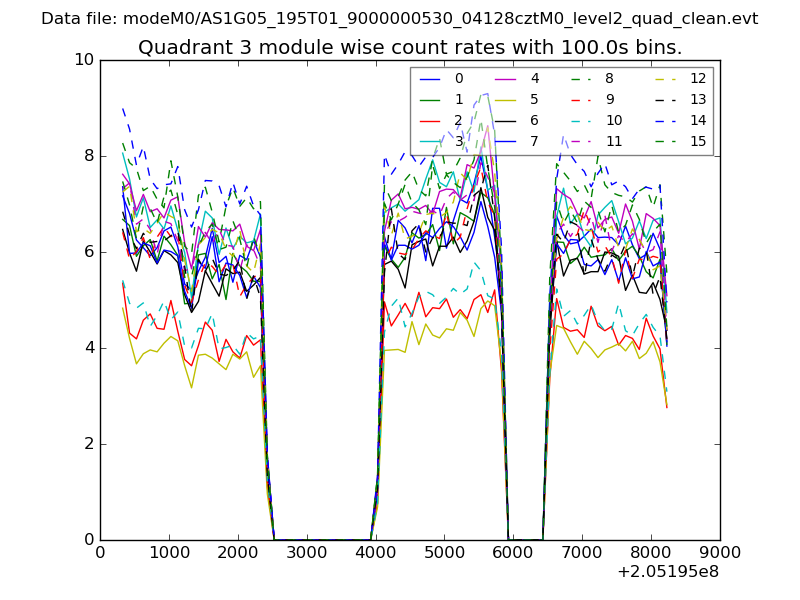
| Module-wise count rates for Quadrant C Data is divided into 100 sec bins |
 |
 |
| Module-wise count rates for Quadrant D Data is divided into 100 sec bins |
 |
 |
| Parameter | Plot |
|---|---|
| CZT HV Monitor | 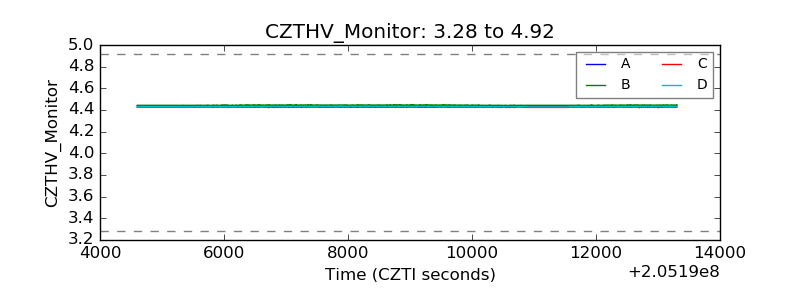 |
| D_VDD | 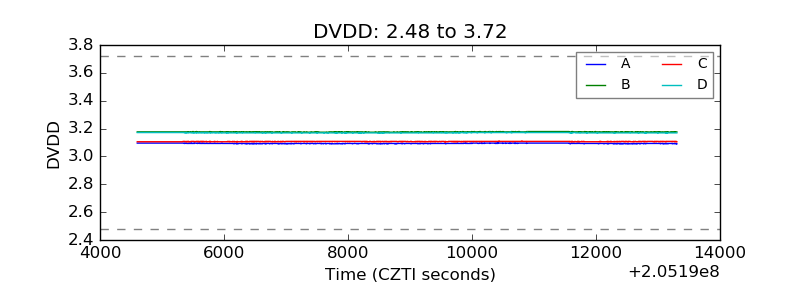 |
| Temperature 1 | 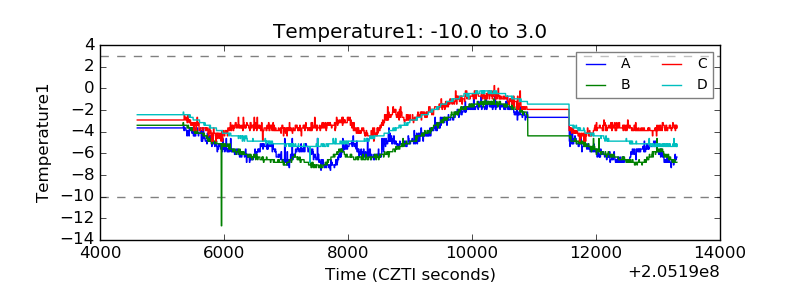 |
| Veto HV Monitor | 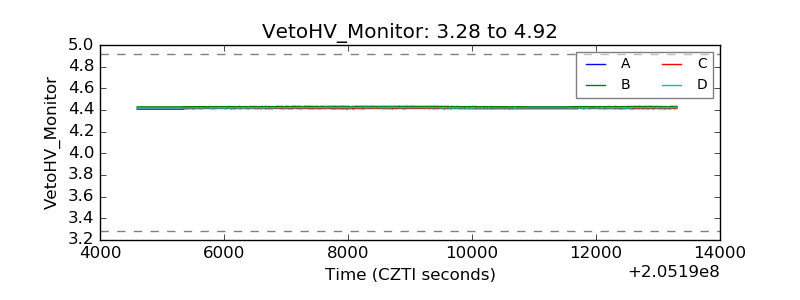 |
| Veto LLD | 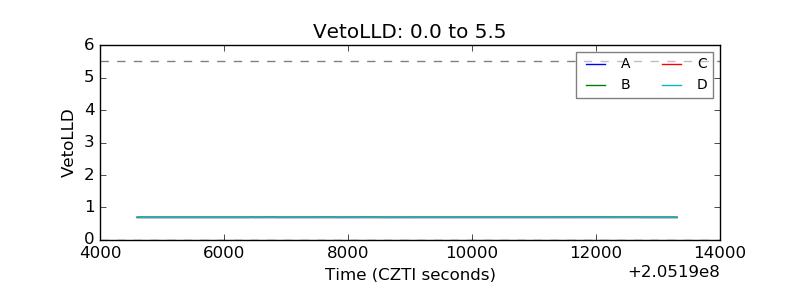 |
| Alpha Counter | 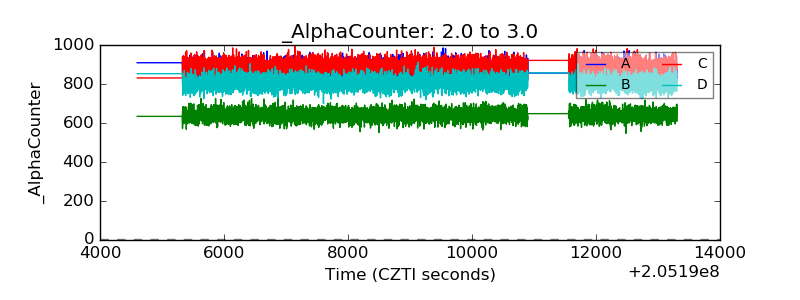 |
| _CPM_Rate | 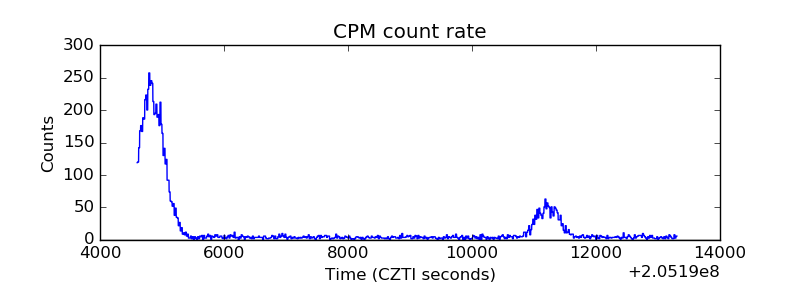 |
| CZT Counter | 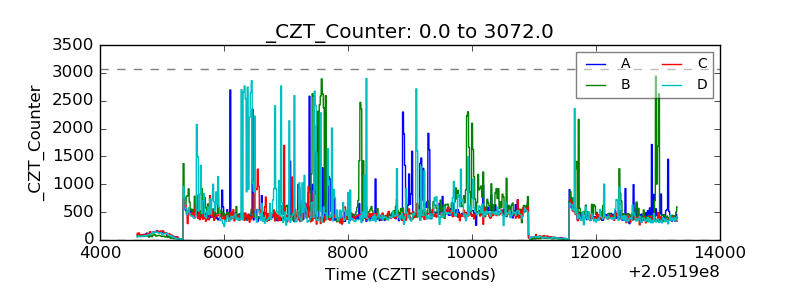 |
| +2.5 Volts monitor |  |
| +5 Volts monitor |  |
| _ROLL_ROT | 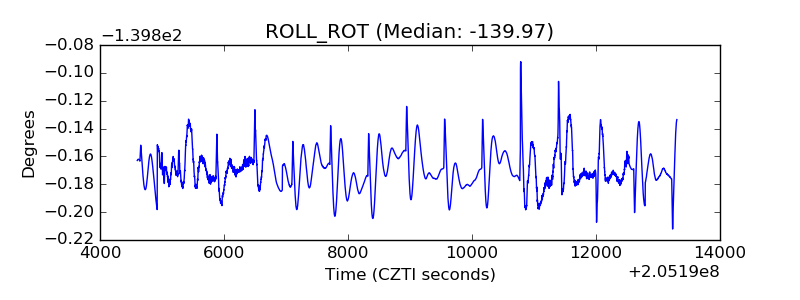 |
| _Roll_DEC | 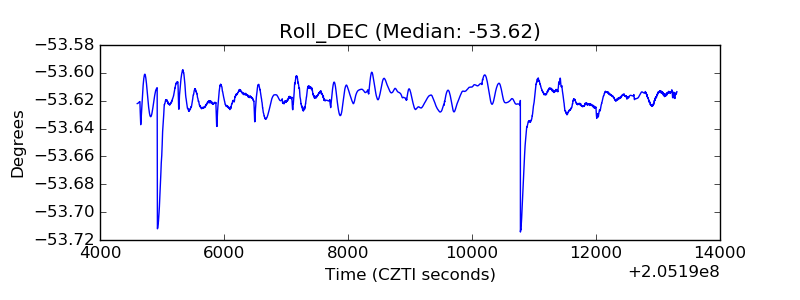 |
| _Roll_RA | 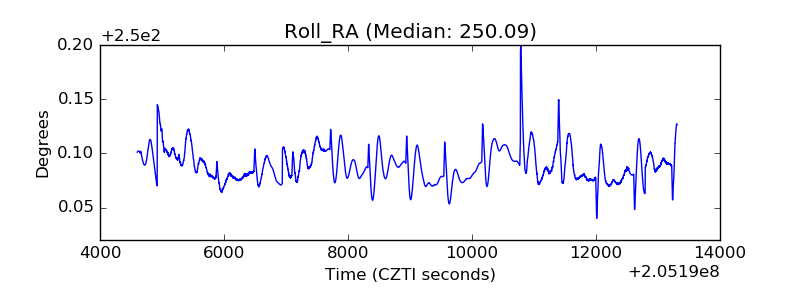 |
| Veto Counter | 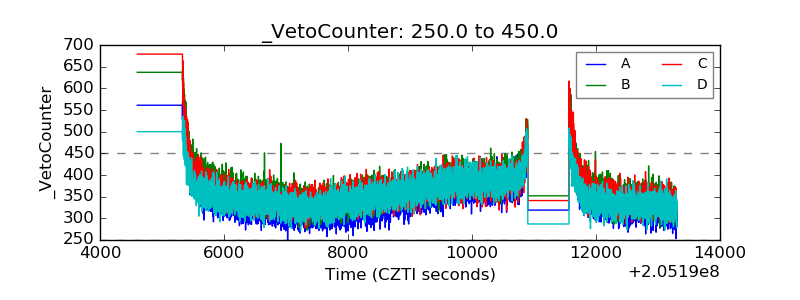 |