| Param | Original file | Final file |
|---|---|---|
| Filename | modeM0/AS1G05_195T01_9000000530_04129cztM0_level2.evt | modeM0/AS1G05_195T01_9000000530_04129cztM0_level2_quad_clean.evt |
| Size (bytes) | 494,328,960 | 92,891,520 |
| Size | 471.4 MB | 88.6 MB |
| Events in quadrant A | 3,919,952 | 581,940 |
| Events in quadrant B | 4,007,438 | 569,984 |
| Events in quadrant C | 3,223,853 | 570,938 |
| Events in quadrant D | 3,302,480 | 560,673 |
| Mode SS | |||
|---|---|---|---|
| Quadrant | BADHDUFLAG | Total packets | Discarded packets |
| A | 0 | 154 | 0 |
| B | 0 | 154 | 0 |
| C | 0 | 154 | 0 |
| D | 0 | 154 | 0 |
| Mode M0 | |||
|---|---|---|---|
| Quadrant | BADHDUFLAG | Total packets | Discarded packets |
| A | 0 | 17193 | 4 |
| B | 0 | 17255 | 3 |
| C | 0 | 15484 | 3 |
| D | 0 | 15878 | 3 |
| Mode M9 | |||
|---|---|---|---|
| Quadrant | BADHDUFLAG | Total packets | Discarded packets |
| A | 0 | 7 | 0 |
| B | 0 | 7 | 0 |
| C | 0 | 7 | 0 |
| D | 0 | 8 | 0 |
| Quadrant | Total seconds | Saturated seconds | Saturation percentage |
|---|---|---|---|
| A | 7610 | 94 | 1.235217% |
| B | 7610 | 157 | 2.063075% |
| C | 7610 | 40 | 0.525624% |
| D | 7610 | 40 | 0.525624% |
Noise dominated data is calculated using 1-second bins in cleaned event files. If a bin has >2000 counts, and if more than 50% of those come from <1% of pixels, then it is considered to be noise-dominated and hence unusable.
| Quadrant | # 1 sec bins | Bins with >0 counts | Bins with >2000 counts | High rate bins dominated by noise | Noise dominated (total time) | Noise dominated (detector-on time) | Marked lightcurve |
|---|---|---|---|---|---|---|---|
| A | 7915 | 7612 | 48 | 48 | 0.61% | 0.63% | 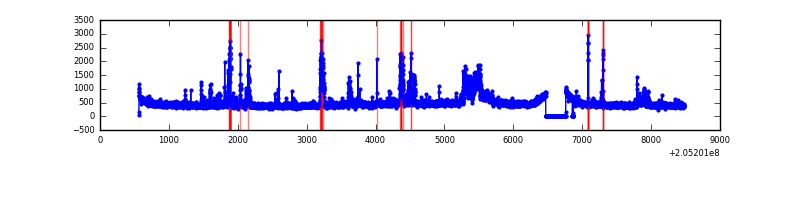 |
| B | 7915 | 7612 | 72 | 72 | 0.91% | 0.95% | 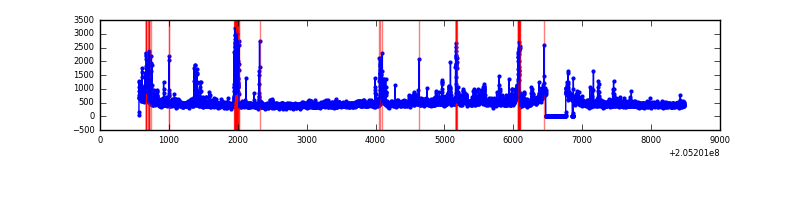 |
| C | 7915 | 7612 | 0 | 0 | 0.00% | 0.00% | 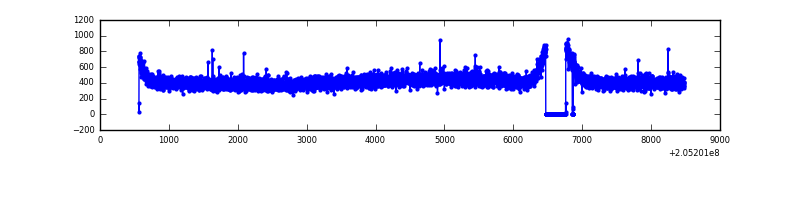 |
| D | 7915 | 7612 | 17 | 17 | 0.21% | 0.22% | 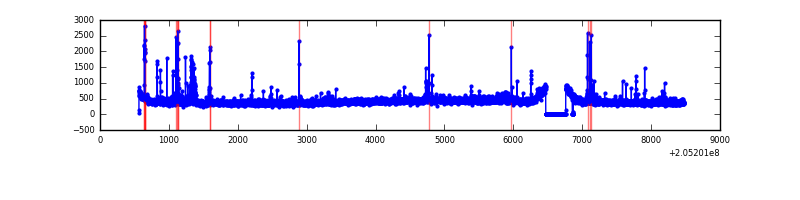 |
Top three noisy pixels from each quadrant. If the there are fewer than three noisy pixels in the level2.evt file, extra rows are filled as -1
| Pixel properties | Quadrant properties | ||||||
|---|---|---|---|---|---|---|---|
| Quadrant | DetID | PixID | Counts | Sigma | Mean | Median | Sigma |
| A | 0 | 50 | 324497 | 1866.09 | 845 | 825 | 173.4 |
| A | 0 | 199 | 232137 | 1333.6 | 845 | 825 | 173.4 |
| A | 15 | 234 | 35796 | 201.62 | 845 | 825 | 173.4 |
| B | 10 | 16 | 242564 | 1477.49 | 852 | 831 | 163.6 |
| B | 15 | 204 | 169961 | 1033.73 | 852 | 831 | 163.6 |
| B | 4 | 48 | 100580 | 609.67 | 852 | 831 | 163.6 |
| C | 9 | 144 | 8732 | 41.52 | 820 | 820 | 190.5 |
| C | 13 | 61 | 6924 | 32.03 | 820 | 820 | 190.5 |
| C | 12 | 4 | 4846 | 21.13 | 820 | 820 | 190.5 |
| D | 12 | 233 | 55366 | 275.71 | 815 | 789 | 197.9 |
| D | 13 | 239 | 34383 | 169.71 | 815 | 789 | 197.9 |
| D | 2 | 14 | 21215 | 103.19 | 815 | 789 | 197.9 |
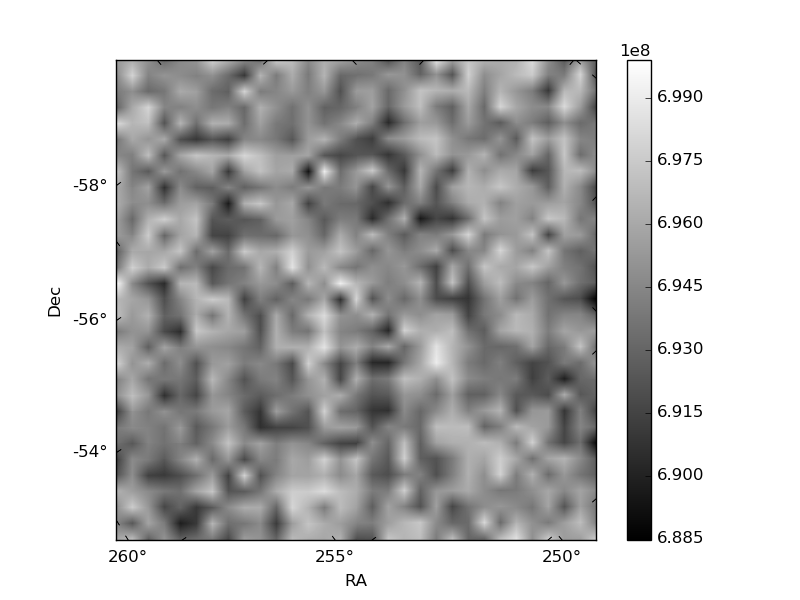
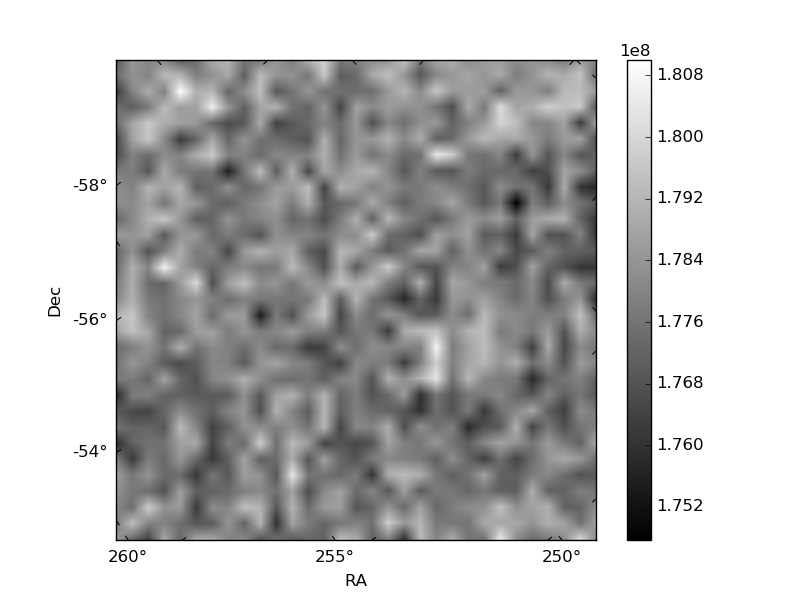
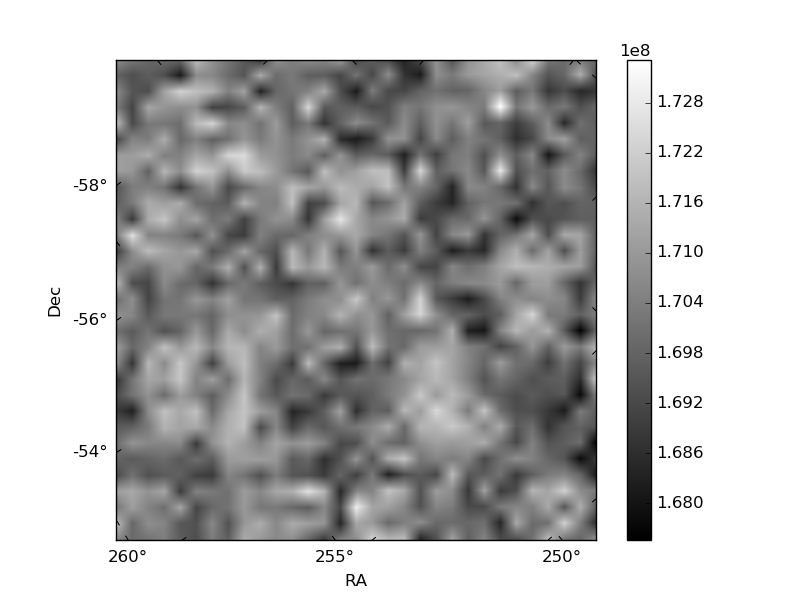
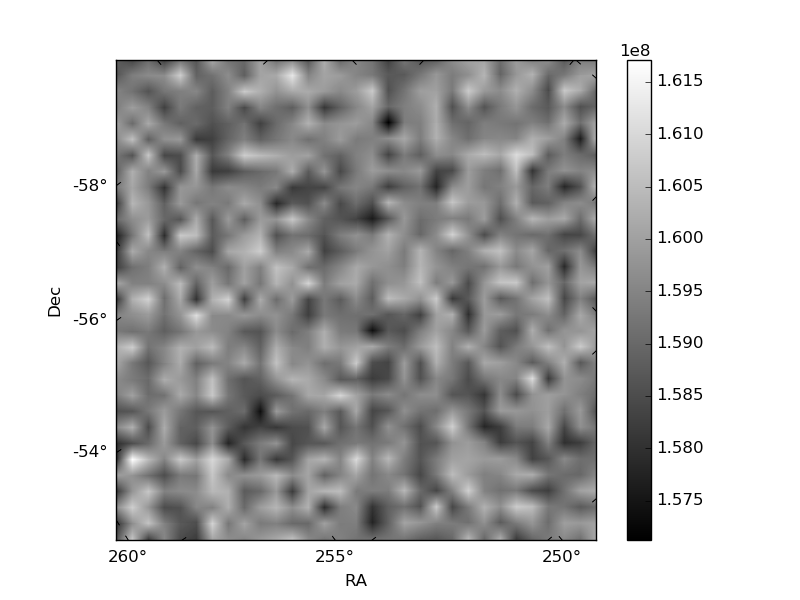
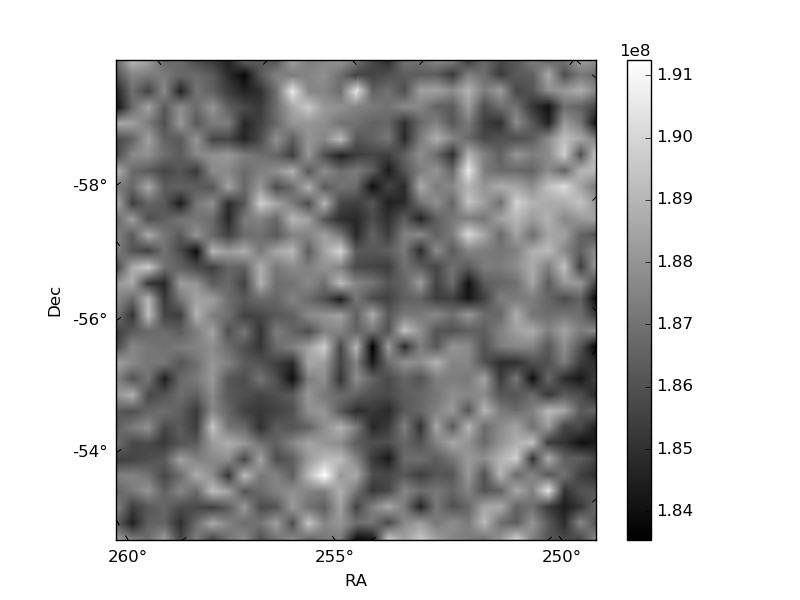
Histogram calculated using DETX and DETY for each event in the final _common_clean file
| Quadrant A | 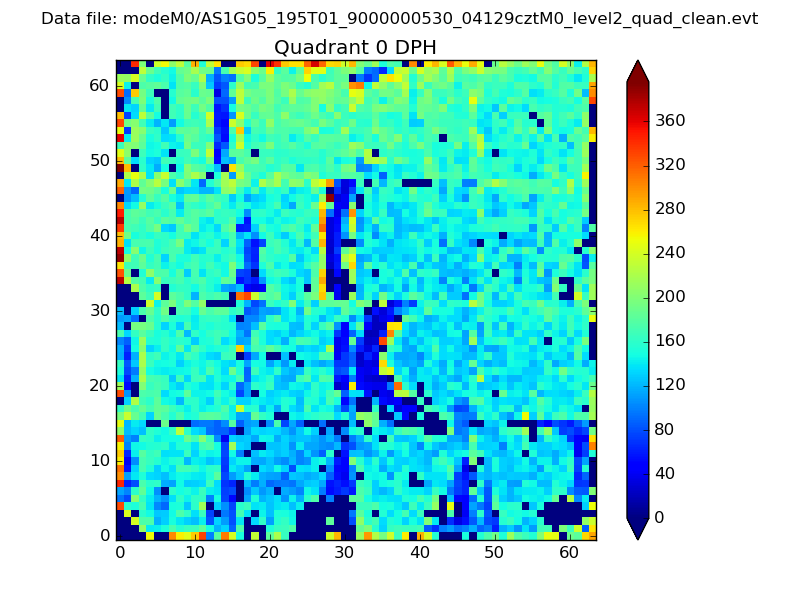 |
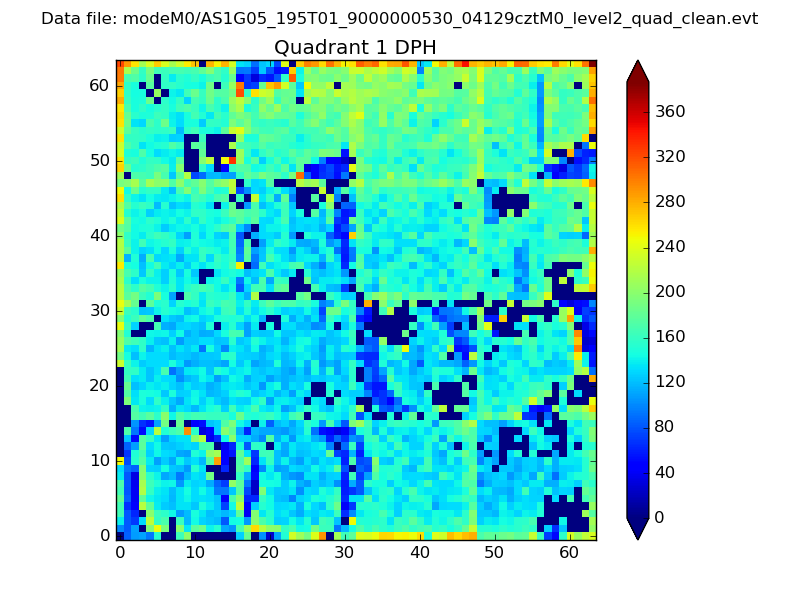 |
Quadrant B |
|---|---|---|---|
| Quadrant D | 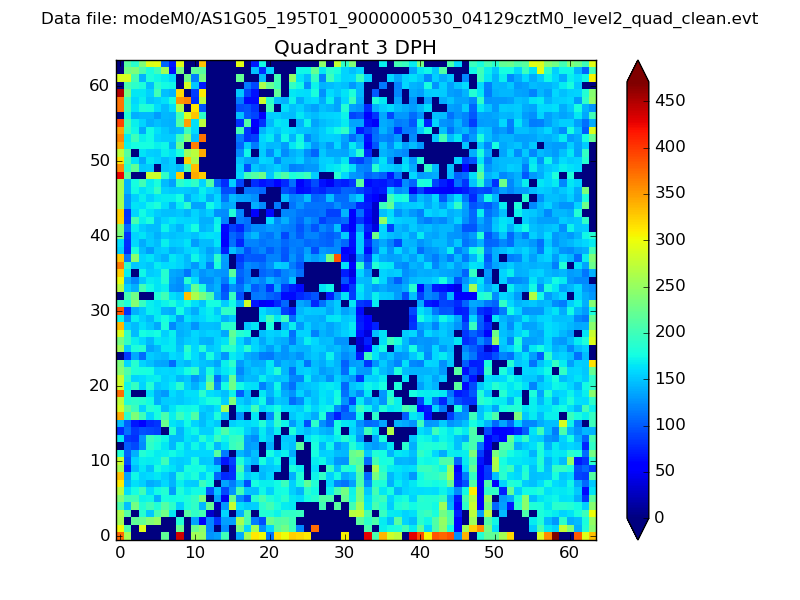 |
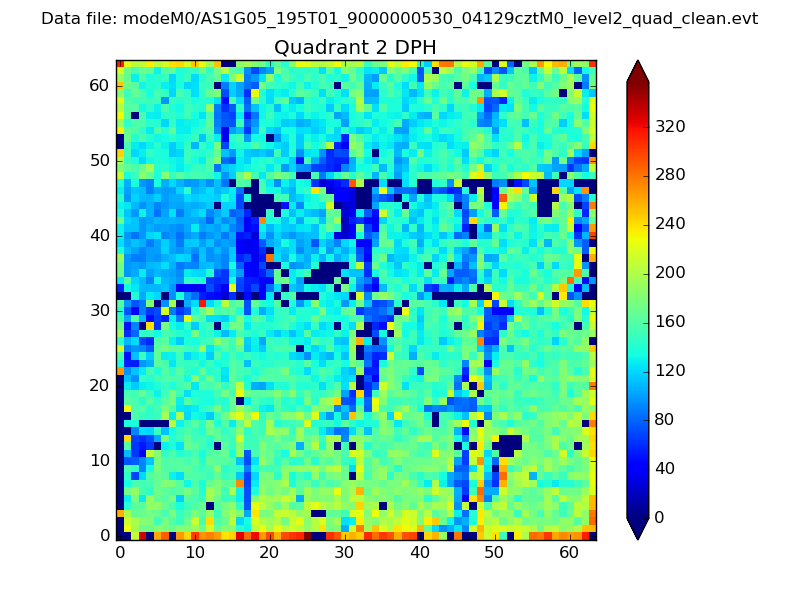 |
Quadrant C |
| Plot type | Count rate plots | Images |
|---|---|---|
| Comparison with Poisson distribution Blue bars denote a histogram of data divided into 1 sec bins. Red curve is a Poisson curve with rate = median count rate of data. |
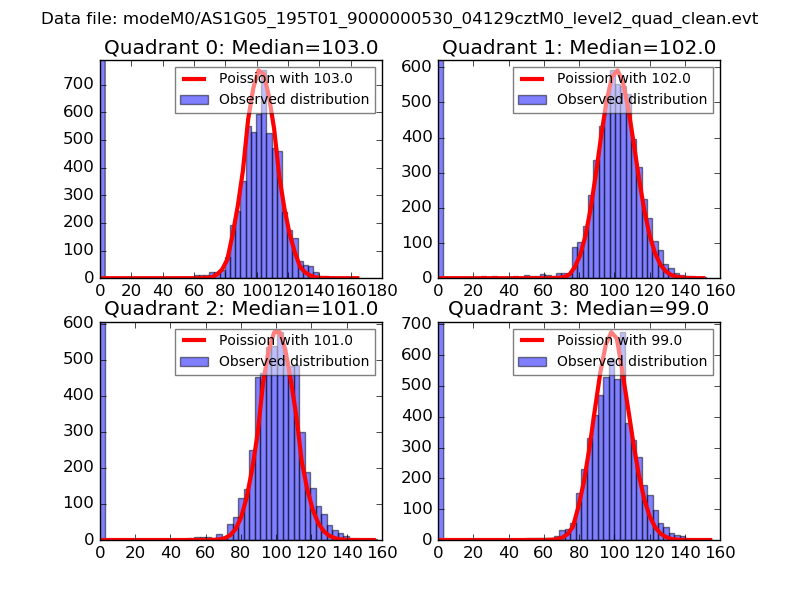 |
 |
| Quadrant-wise count rates Data is divided into 100 sec bins |
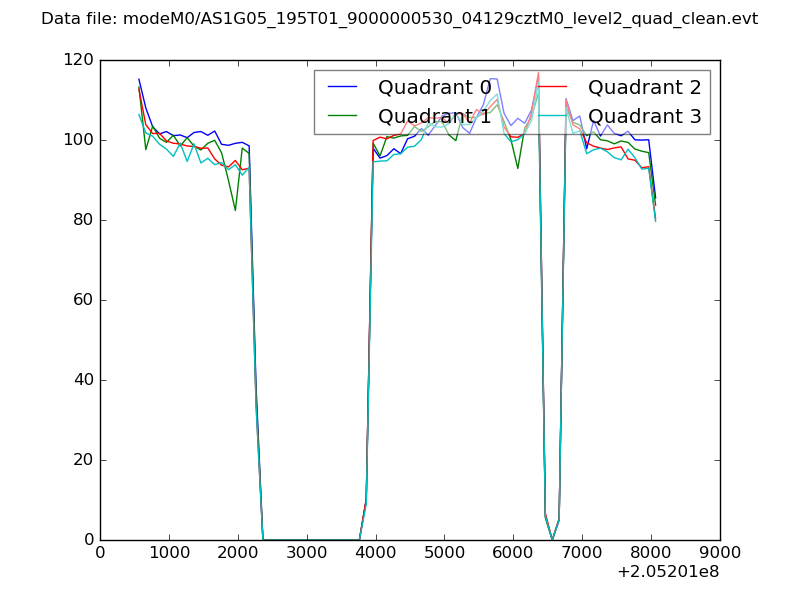 |
|
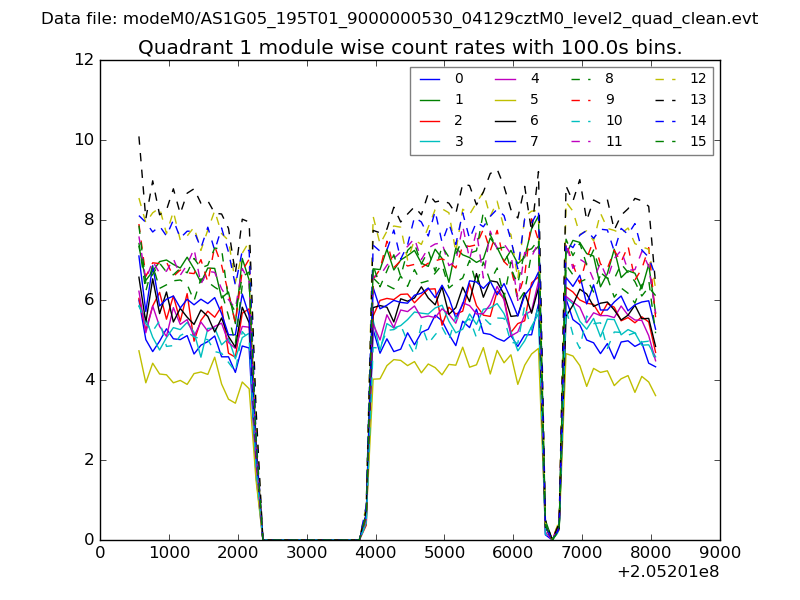
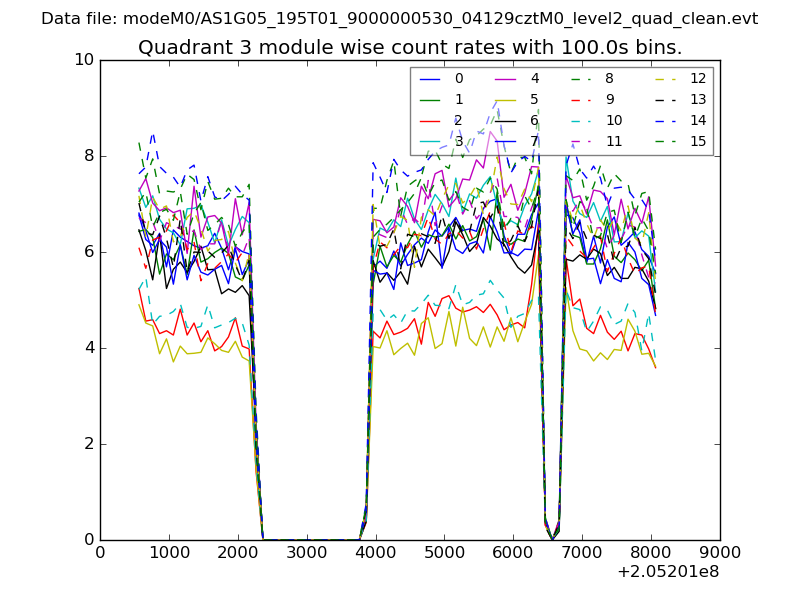
| Module-wise count rates for Quadrant A Data is divided into 100 sec bins |
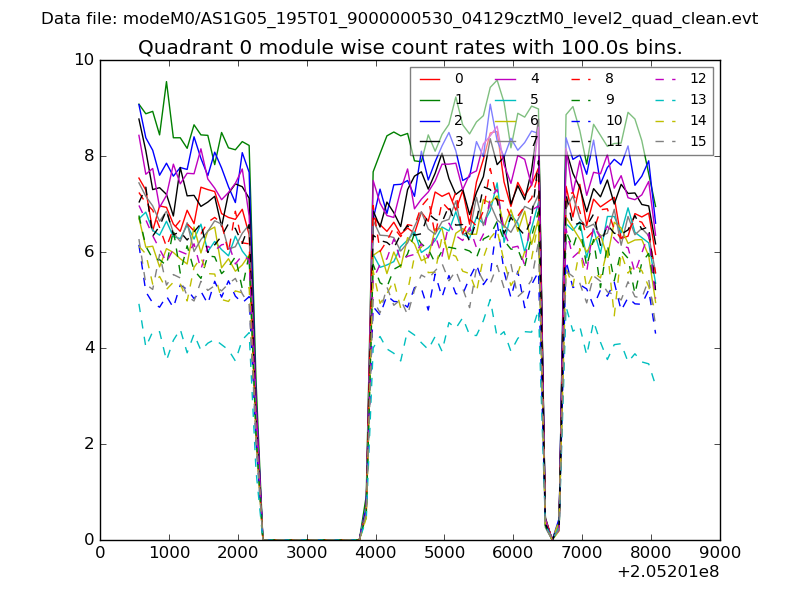 |
 |
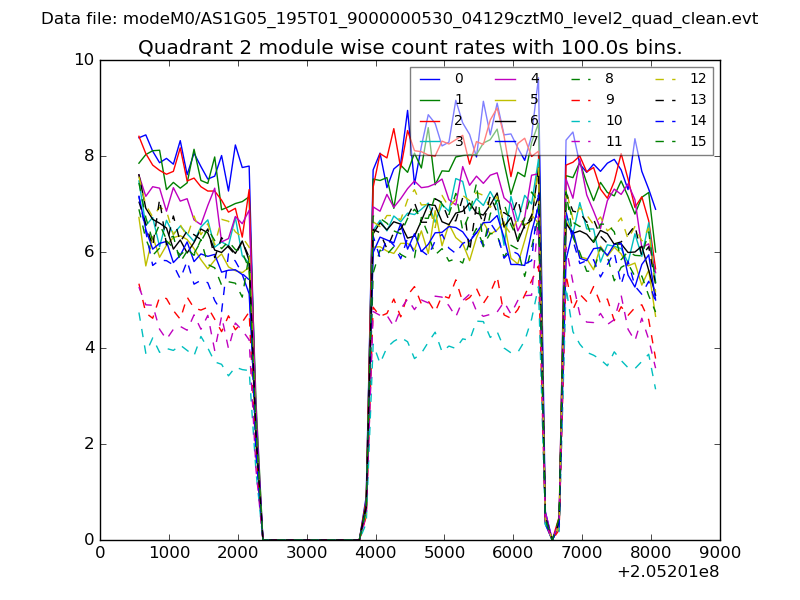
| Module-wise count rates for Quadrant B Data is divided into 100 sec bins |
 |
 |
| Module-wise count rates for Quadrant C Data is divided into 100 sec bins |
 |
 |
| Module-wise count rates for Quadrant D Data is divided into 100 sec bins |
 |
 |
| Parameter | Plot |
|---|---|
| CZT HV Monitor | 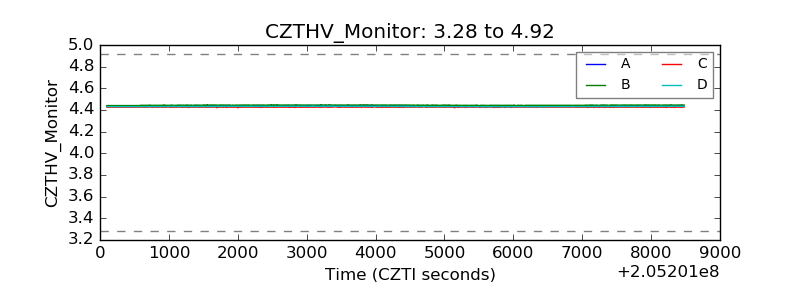 |
| D_VDD | 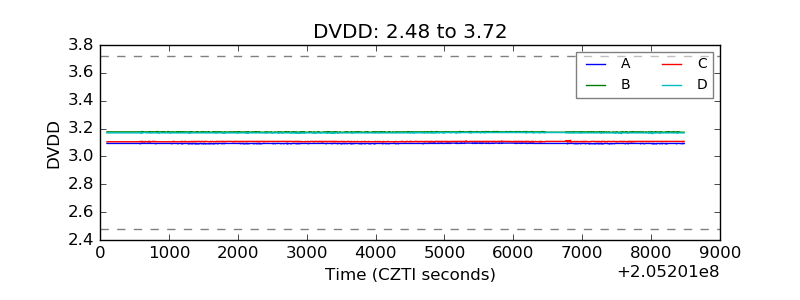 |
| Temperature 1 | 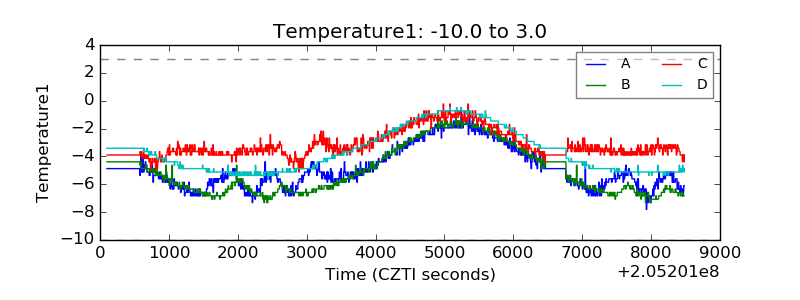 |
| Veto HV Monitor | 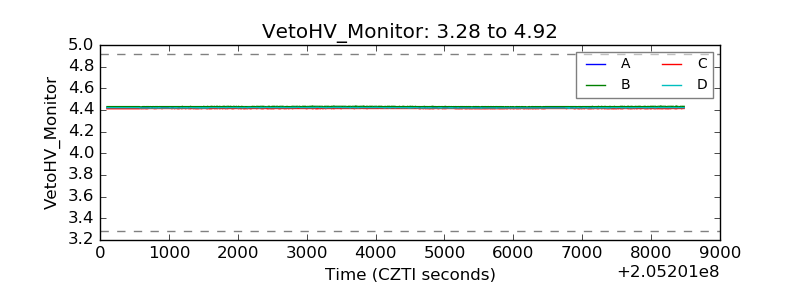 |
| Veto LLD | 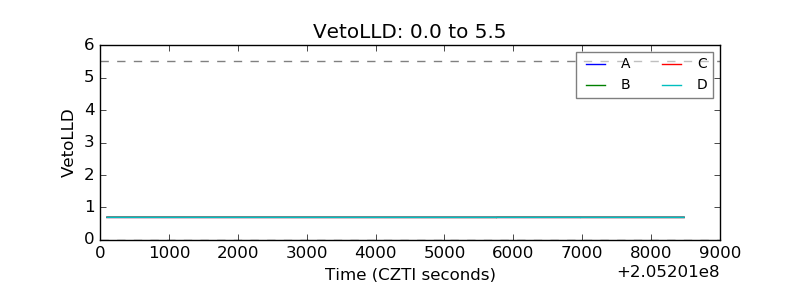 |
| Alpha Counter |  |
| _CPM_Rate |  |
| CZT Counter | 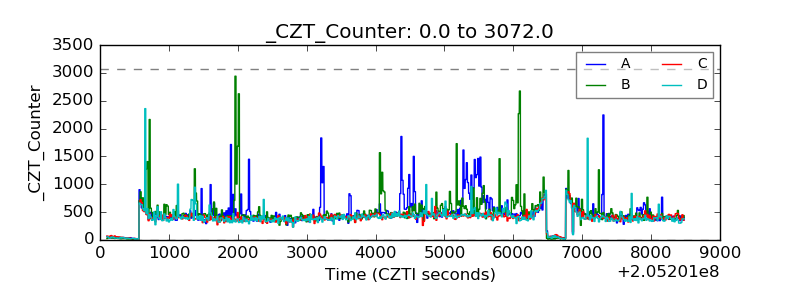 |
| +2.5 Volts monitor |  |
| +5 Volts monitor |  |
| _ROLL_ROT | 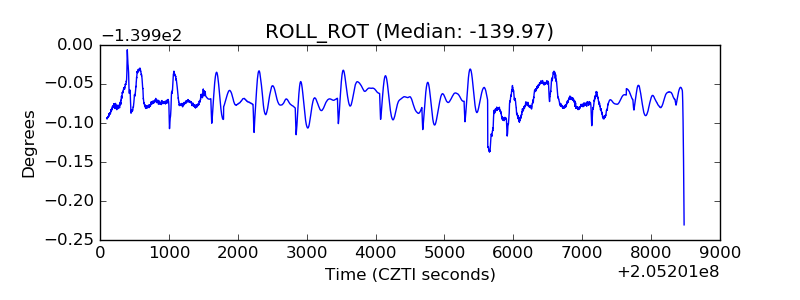 |
| _Roll_DEC | 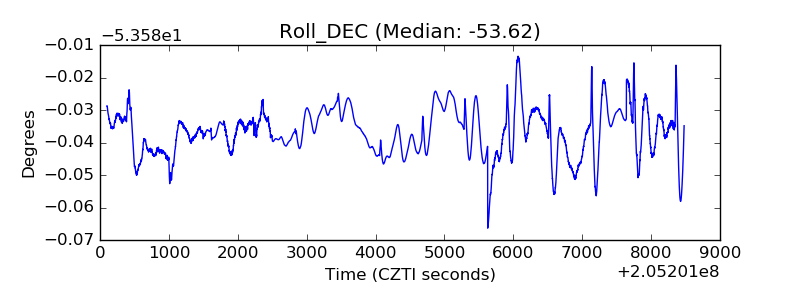 |
| _Roll_RA | 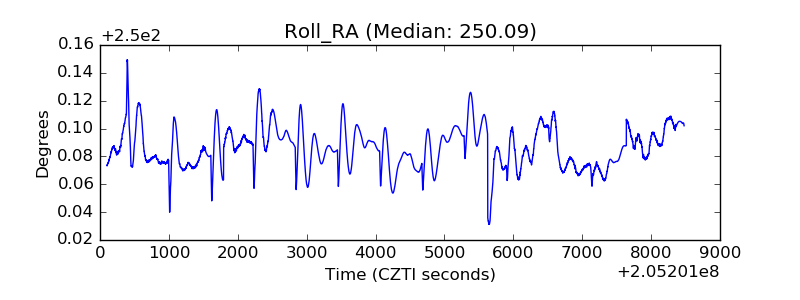 |
| Veto Counter | 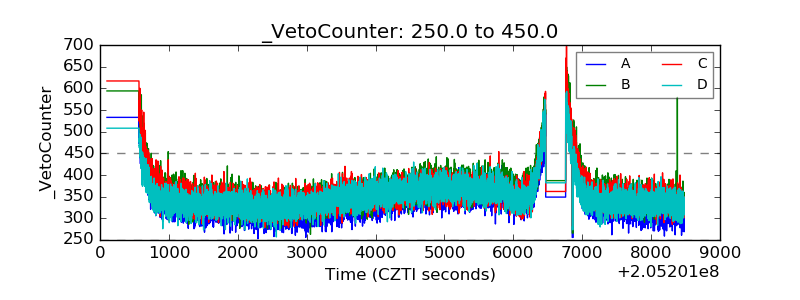 |