| Param | Original file | Final file |
|---|---|---|
| Filename | modeM0/AS1G05_195T01_9000000530_04131cztM0_level2.evt | modeM0/AS1G05_195T01_9000000530_04131cztM0_level2_quad_clean.evt |
| Size (bytes) | 157,420,800 | 17,637,120 |
| Size | 150.1 MB | 16.8 MB |
| Events in quadrant A | 1,226,590 | 82,762 |
| Events in quadrant B | 1,231,528 | 90,202 |
| Events in quadrant C | 1,053,700 | 88,796 |
| Events in quadrant D | 1,078,243 | 86,927 |
| Mode SS | |||
|---|---|---|---|
| Quadrant | BADHDUFLAG | Total packets | Discarded packets |
| A | 0 | 52 | 0 |
| B | 0 | 52 | 0 |
| C | 0 | 52 | 0 |
| D | 0 | 52 | 0 |
| Mode M0 | |||
|---|---|---|---|
| Quadrant | BADHDUFLAG | Total packets | Discarded packets |
| A | 0 | 5680 | 1 |
| B | 0 | 5443 | 0 |
| C | 0 | 5141 | 0 |
| D | 0 | 5303 | 0 |
| Quadrant | Total seconds | Saturated seconds | Saturation percentage |
|---|---|---|---|
| A | 2570 | 90 | 3.501946% |
| B | 2570 | 11 | 0.428016% |
| C | 2570 | 2 | 0.077821% |
| D | 2570 | 7 | 0.272374% |
Noise dominated data is calculated using 1-second bins in cleaned event files. If a bin has >2000 counts, and if more than 50% of those come from <1% of pixels, then it is considered to be noise-dominated and hence unusable.
| Quadrant | # 1 sec bins | Bins with >0 counts | Bins with >2000 counts | High rate bins dominated by noise | Noise dominated (total time) | Noise dominated (detector-on time) | Marked lightcurve |
|---|---|---|---|---|---|---|---|
| A | 2570 | 2570 | 73 | 73 | 2.84% | 2.84% | 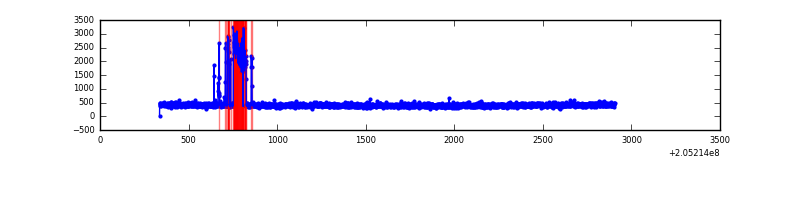 |
| B | 2570 | 2570 | 11 | 11 | 0.43% | 0.43% | 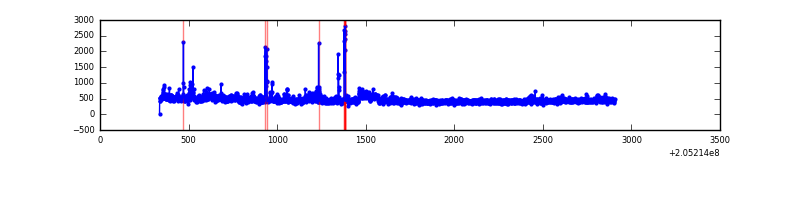 |
| C | 2570 | 2570 | 0 | 0 | 0.00% | 0.00% | 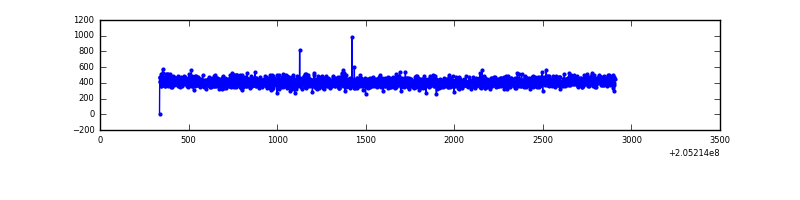 |
| D | 2570 | 2570 | 9 | 9 | 0.35% | 0.35% | 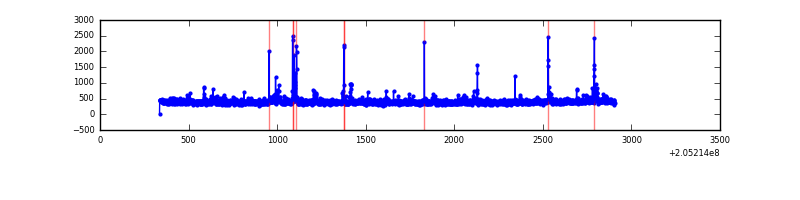 |
Top three noisy pixels from each quadrant. If the there are fewer than three noisy pixels in the level2.evt file, extra rows are filled as -1
| Pixel properties | Quadrant properties | ||||||
|---|---|---|---|---|---|---|---|
| Quadrant | DetID | PixID | Counts | Sigma | Mean | Median | Sigma |
| A | 15 | 234 | 214861 | 3906.68 | 260 | 254 | 54.9 |
| A | 13 | 14 | 6157 | 107.46 | 260 | 254 | 54.9 |
| A | 12 | 194 | 2665 | 43.89 | 260 | 254 | 54.9 |
| B | 15 | 204 | 94899 | 1758.97 | 274 | 268 | 53.8 |
| B | 10 | 16 | 34470 | 635.74 | 274 | 268 | 53.8 |
| B | 4 | 81 | 17566 | 321.53 | 274 | 268 | 53.8 |
| C | 13 | 61 | 2212 | 30.25 | 269 | 270 | 64.2 |
| C | 10 | 65 | 1148 | 13.68 | 269 | 270 | 64.2 |
| C | 14 | 67 | 714 | 6.92 | 269 | 270 | 64.2 |
| D | 4 | 95 | 21912 | 328.66 | 261 | 253 | 65.9 |
| D | 10 | 172 | 15689 | 234.23 | 261 | 253 | 65.9 |
| D | 13 | 223 | 12906 | 192.0 | 261 | 253 | 65.9 |
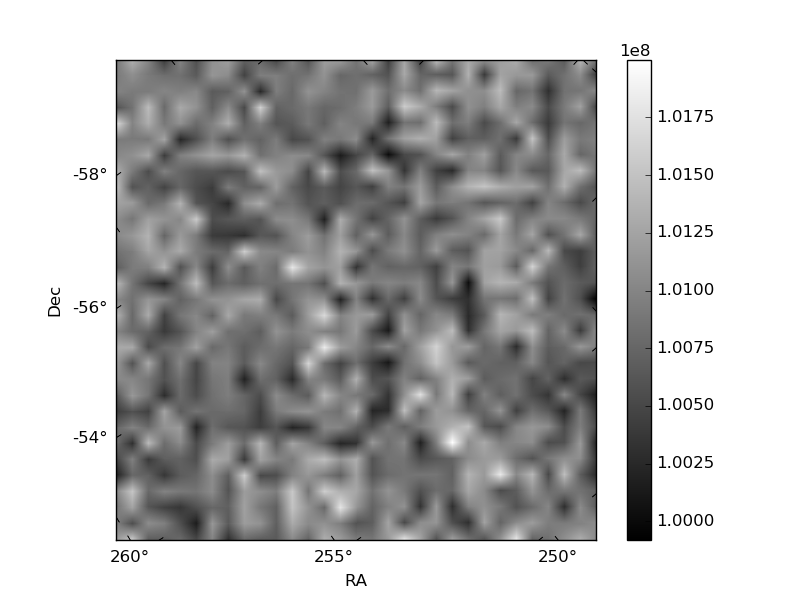
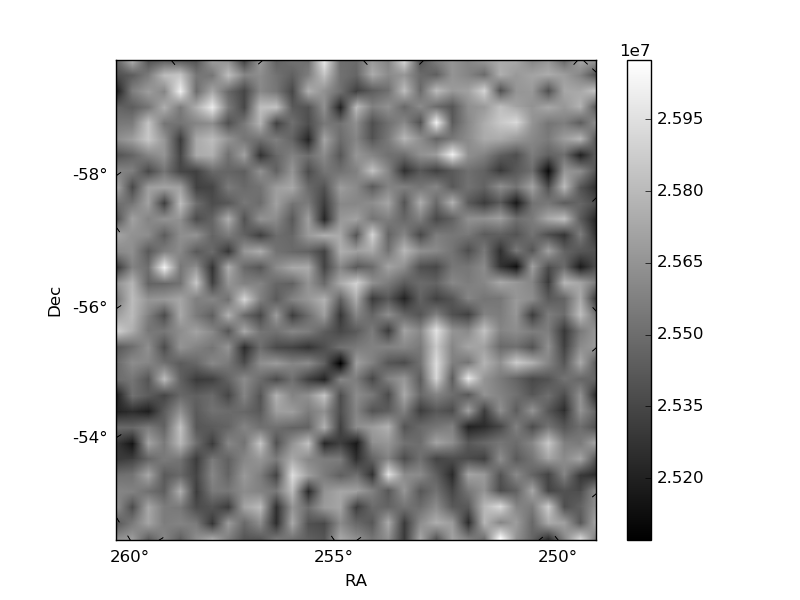
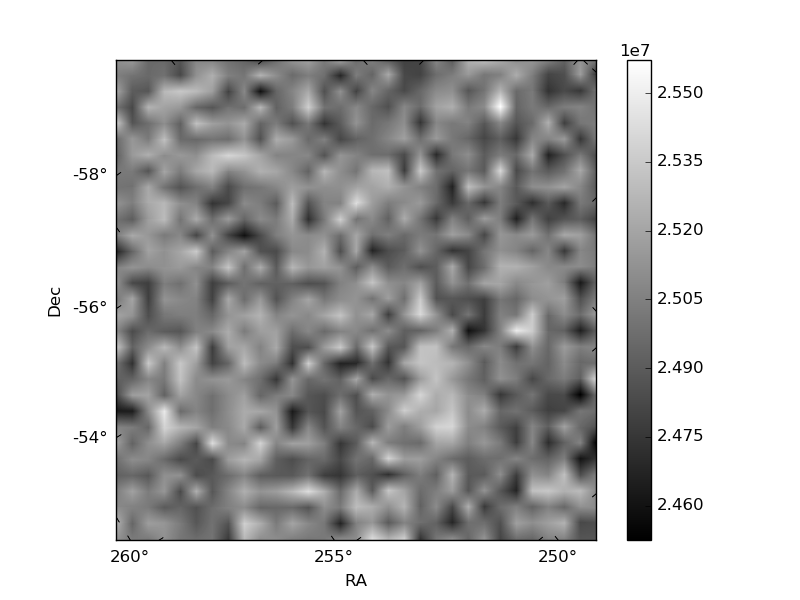
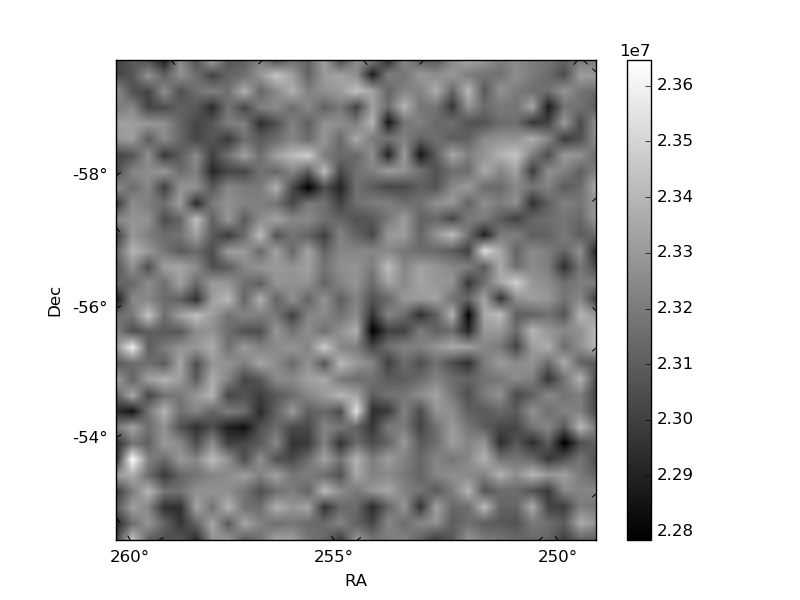
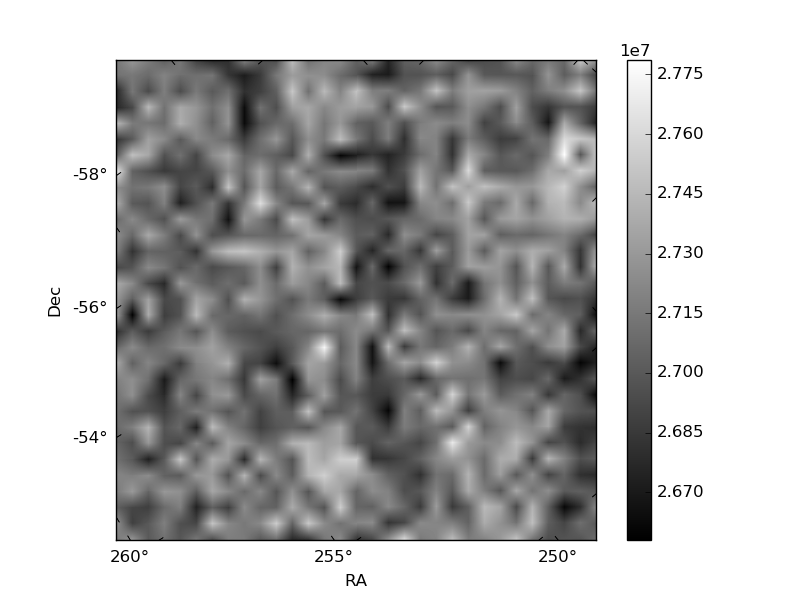
Histogram calculated using DETX and DETY for each event in the final _common_clean file
| Quadrant A | 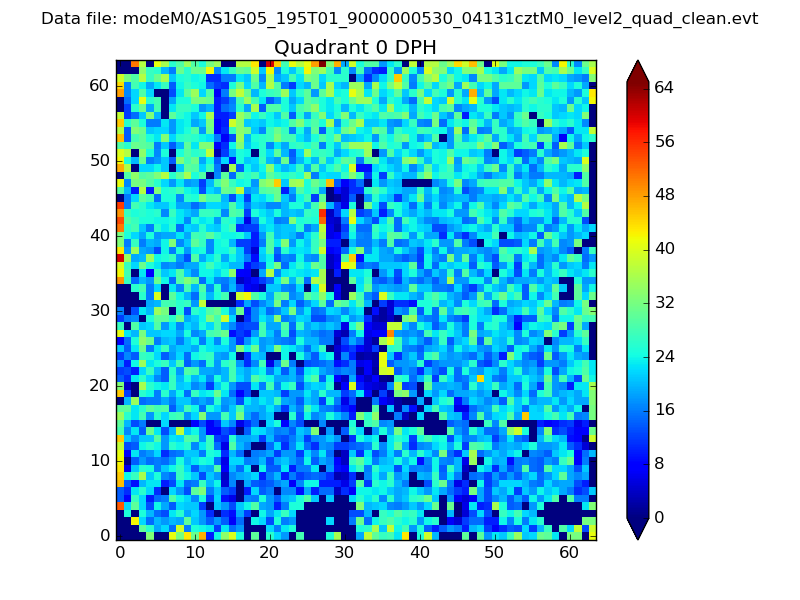 |
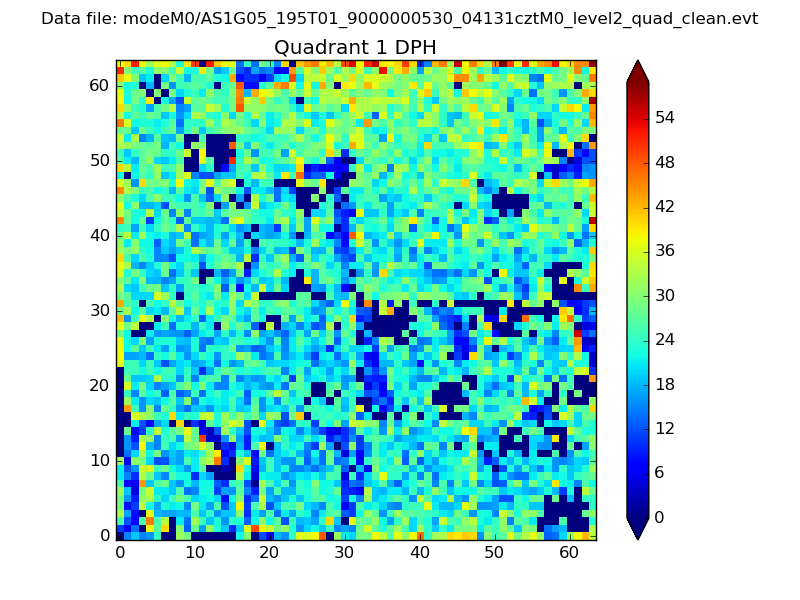 |
Quadrant B |
|---|---|---|---|
| Quadrant D | 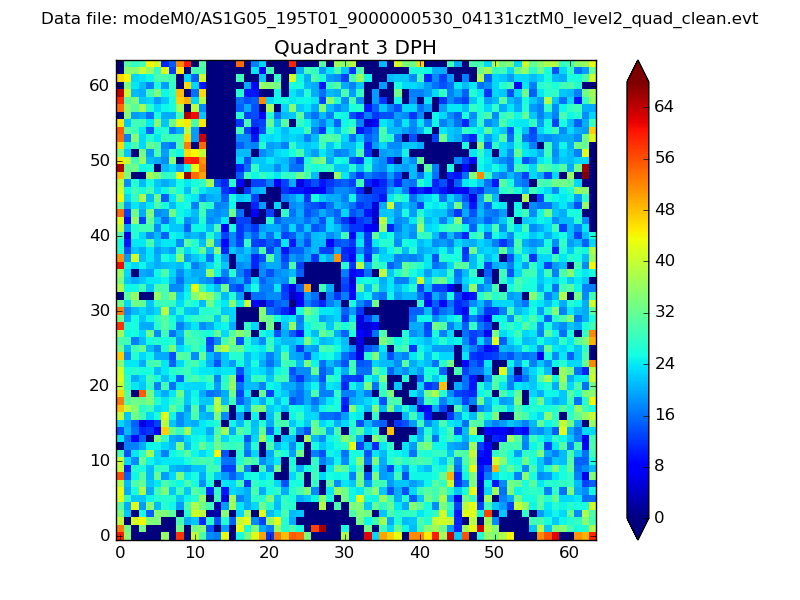 |
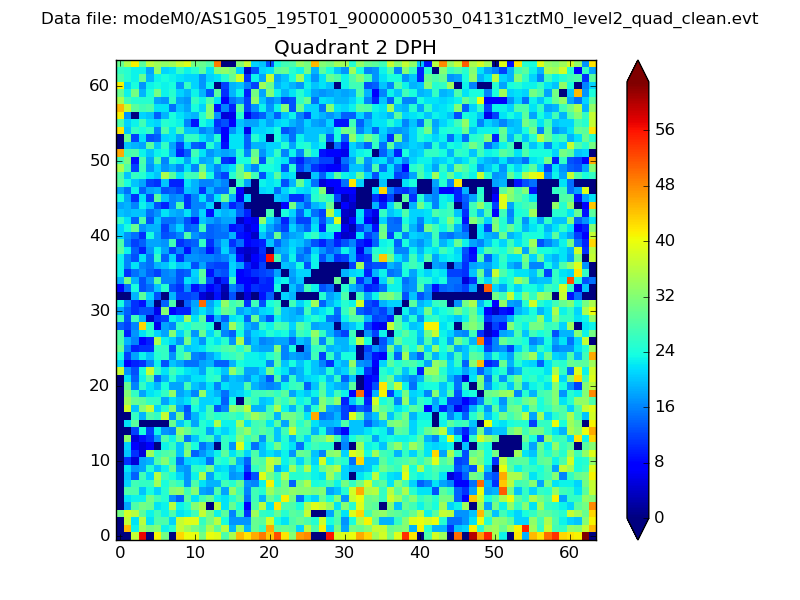 |
Quadrant C |
| Plot type | Count rate plots | Images |
|---|---|---|
| Comparison with Poisson distribution Blue bars denote a histogram of data divided into 1 sec bins. Red curve is a Poisson curve with rate = median count rate of data. |
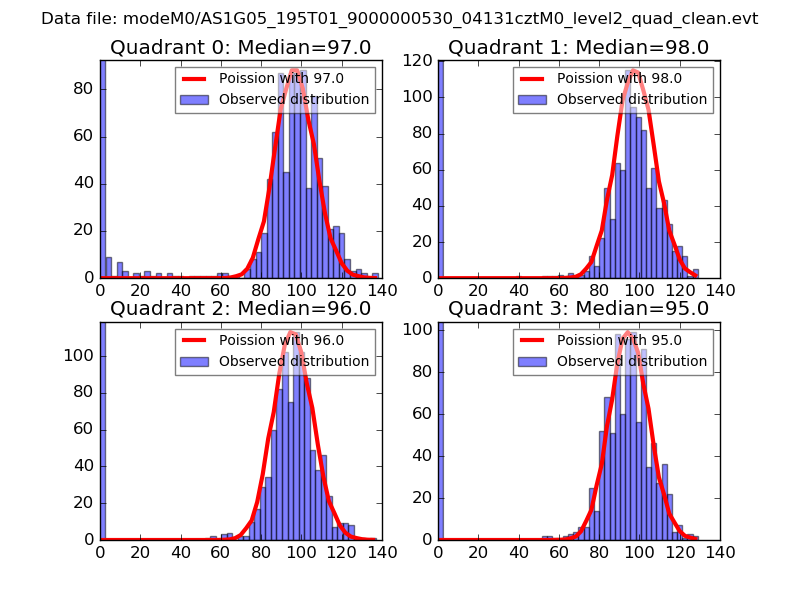 |
 |
| Quadrant-wise count rates Data is divided into 100 sec bins |
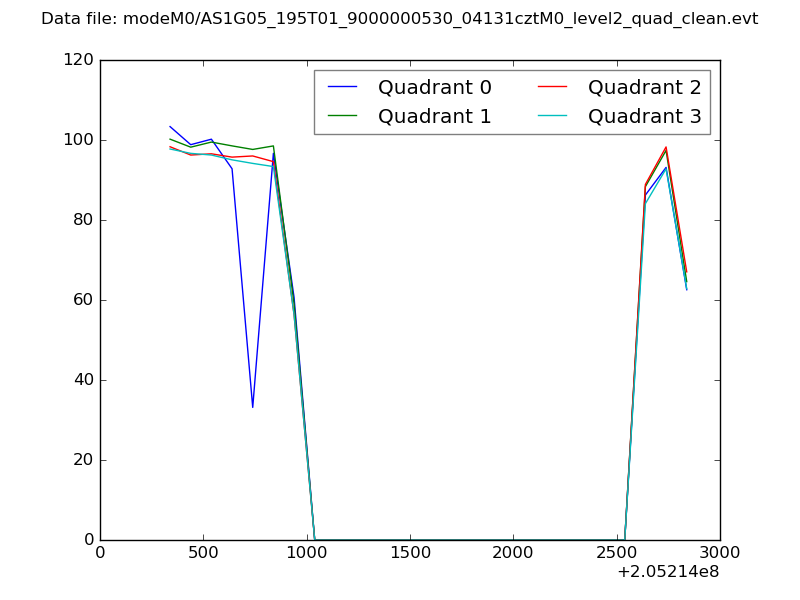 |
|
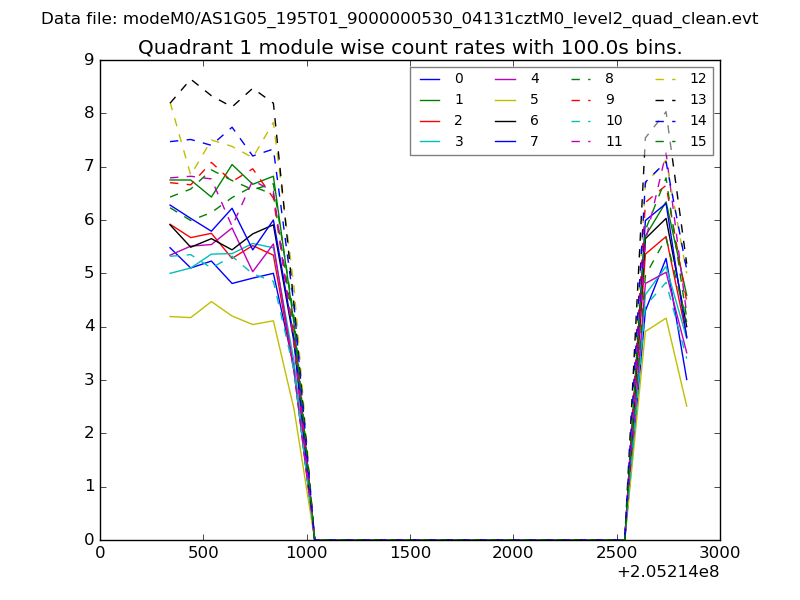
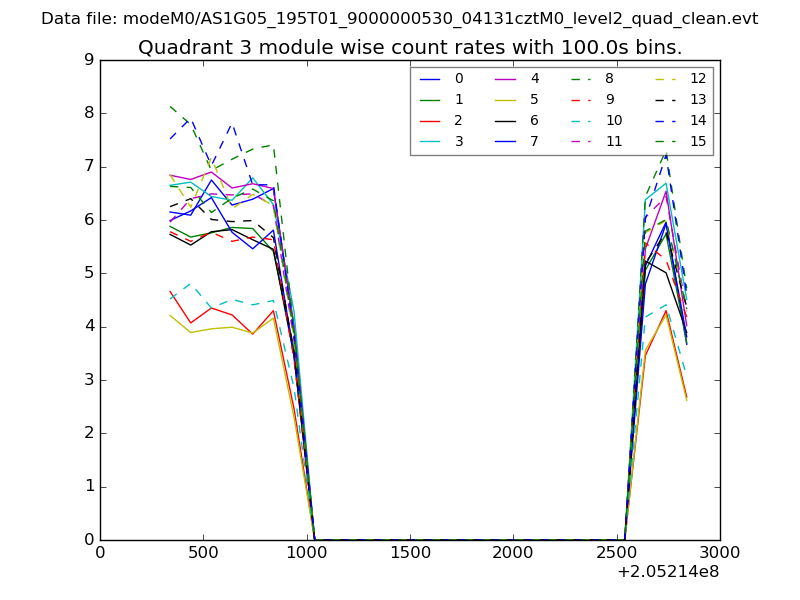
| Module-wise count rates for Quadrant A Data is divided into 100 sec bins |
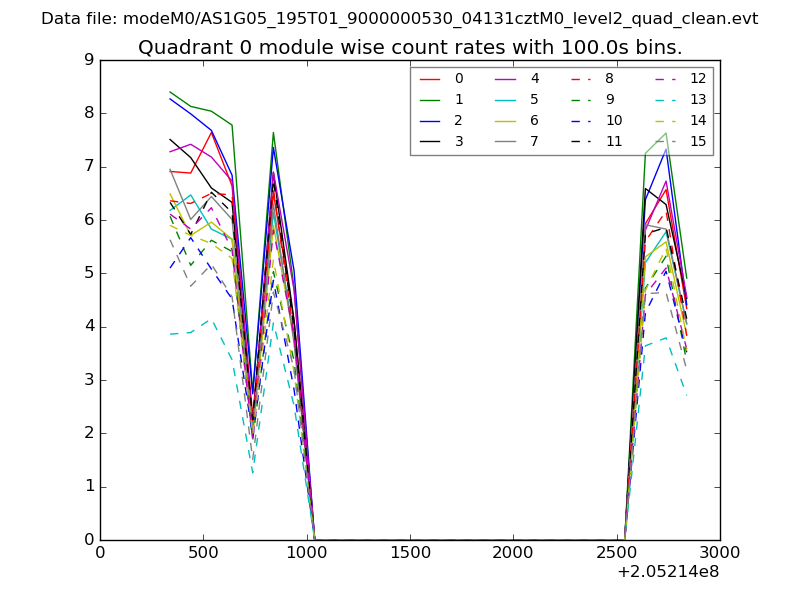 |
 |
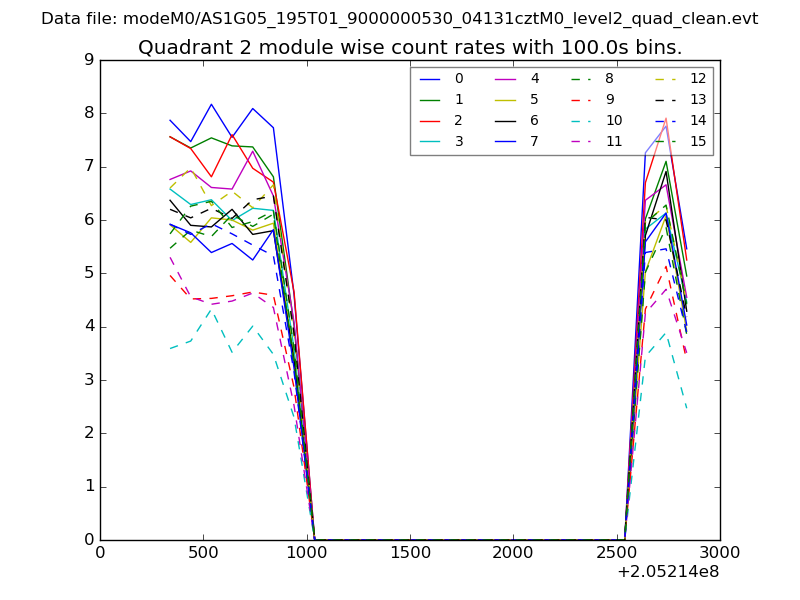
| Module-wise count rates for Quadrant B Data is divided into 100 sec bins |
 |
 |
| Module-wise count rates for Quadrant C Data is divided into 100 sec bins |
 |
 |
| Module-wise count rates for Quadrant D Data is divided into 100 sec bins |
 |
 |
| Parameter | Plot |
|---|---|
| CZT HV Monitor | 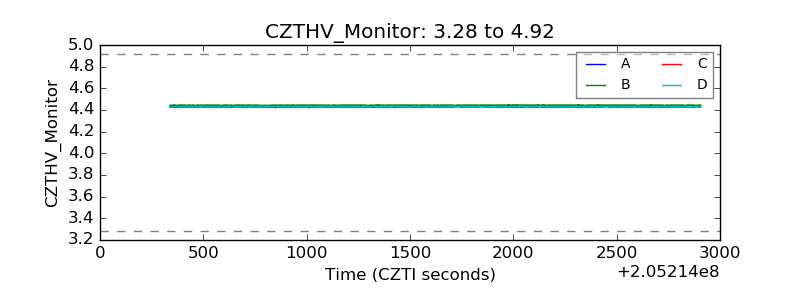 |
| D_VDD | 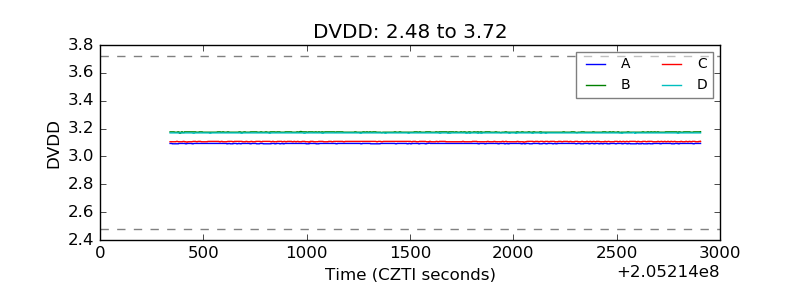 |
| Temperature 1 | 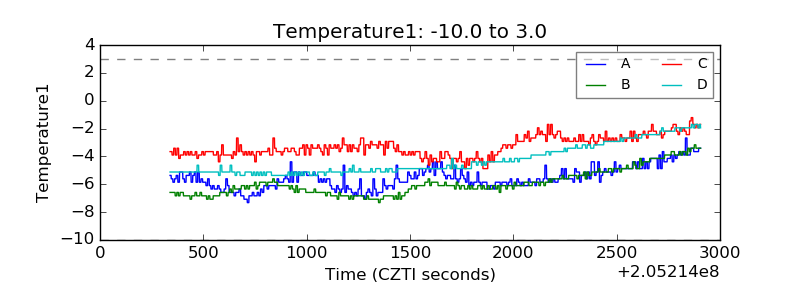 |
| Veto HV Monitor | 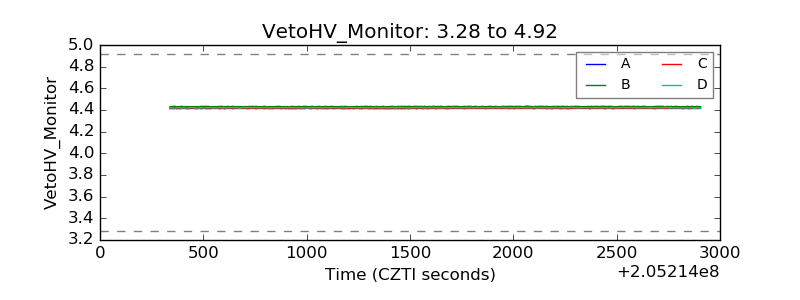 |
| Veto LLD | 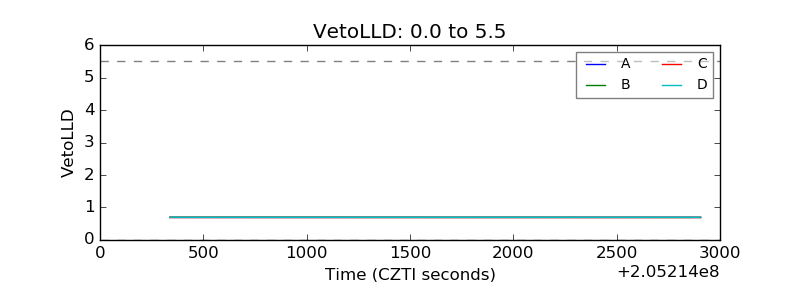 |
| Alpha Counter | 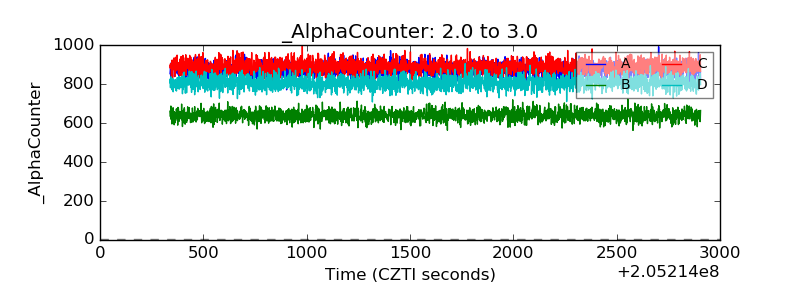 |
| _CPM_Rate | 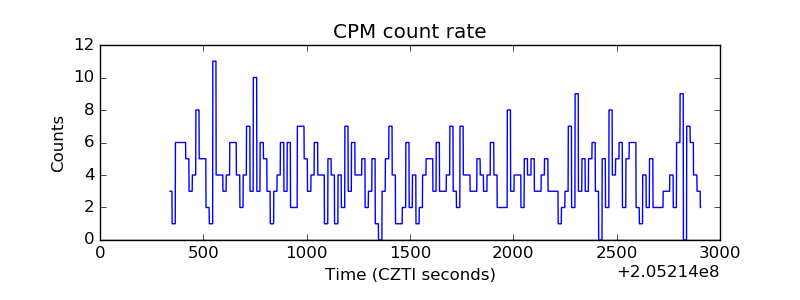 |
| CZT Counter | 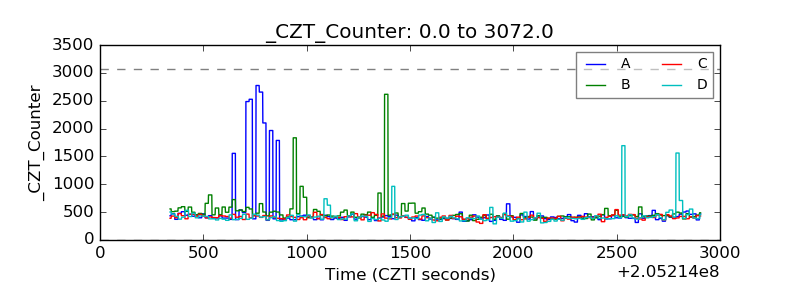 |
| +2.5 Volts monitor |  |
| +5 Volts monitor |  |
| _ROLL_ROT | 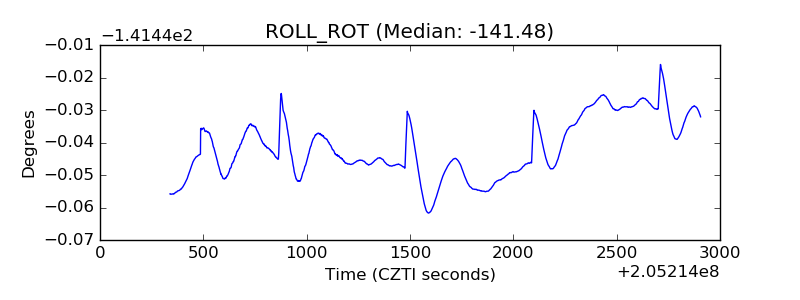 |
| _Roll_DEC | 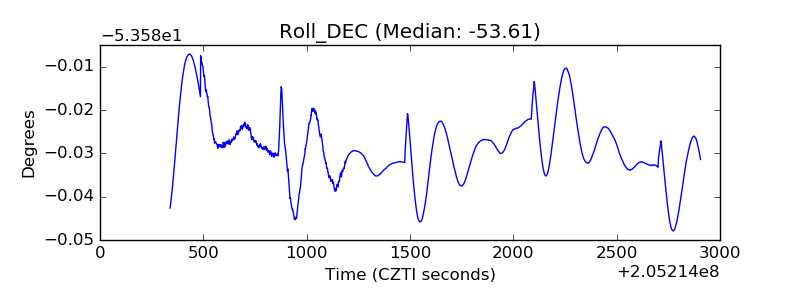 |
| _Roll_RA | 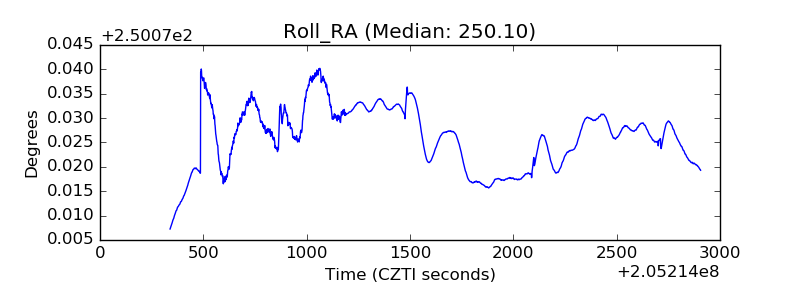 |
| Veto Counter | 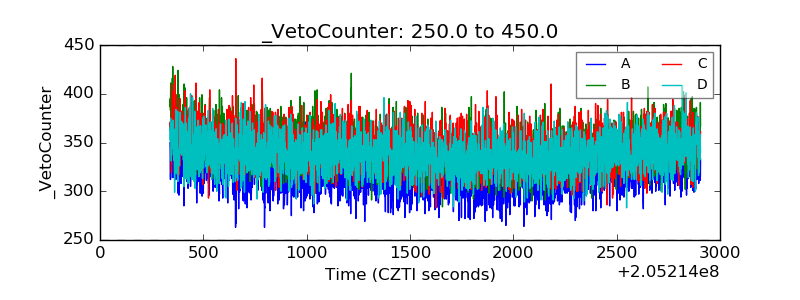 |