| Param | Original file | Final file |
|---|---|---|
| Filename | modeM0/AS1G05_195T01_9000000530_04135cztM0_level2.evt | modeM0/AS1G05_195T01_9000000530_04135cztM0_level2_quad_clean.evt |
| Size (bytes) | 1,146,994,560 | 189,190,080 |
| Size | 1.1 GB | 180.4 MB |
| Events in quadrant A | 7,507,172 | 1,184,045 |
| Events in quadrant B | 8,775,501 | 1,156,364 |
| Events in quadrant C | 6,862,662 | 1,180,927 |
| Events in quadrant D | 10,521,896 | 1,116,963 |
| Mode SS | |||
|---|---|---|---|
| Quadrant | BADHDUFLAG | Total packets | Discarded packets |
| A | 0 | 322 | 0 |
| B | 0 | 322 | 0 |
| C | 0 | 322 | 0 |
| D | 0 | 322 | 0 |
| Mode M0 | |||
|---|---|---|---|
| Quadrant | BADHDUFLAG | Total packets | Discarded packets |
| A | 0 | 33363 | 3 |
| B | 0 | 36173 | 3 |
| C | 0 | 32147 | 3 |
| D | 0 | 42635 | 3 |
| Mode M9 | |||
|---|---|---|---|
| Quadrant | BADHDUFLAG | Total packets | Discarded packets |
| A | 0 | 23 | 0 |
| B | 0 | 23 | 0 |
| C | 0 | 23 | 0 |
| D | 0 | 23 | 0 |
| Quadrant | Total seconds | Saturated seconds | Saturation percentage |
|---|---|---|---|
| A | 15813 | 196 | 1.239486% |
| B | 15813 | 426 | 2.693986% |
| C | 15813 | 150 | 0.948587% |
| D | 15813 | 1188 | 7.512806% |
Noise dominated data is calculated using 1-second bins in cleaned event files. If a bin has >2000 counts, and if more than 50% of those come from <1% of pixels, then it is considered to be noise-dominated and hence unusable.
| Quadrant | # 1 sec bins | Bins with >0 counts | Bins with >2000 counts | High rate bins dominated by noise | Noise dominated (total time) | Noise dominated (detector-on time) | Marked lightcurve |
|---|---|---|---|---|---|---|---|
| A | 18108 | 15816 | 12 | 12 | 0.07% | 0.08% |  |
| B | 18108 | 15816 | 218 | 218 | 1.20% | 1.38% | 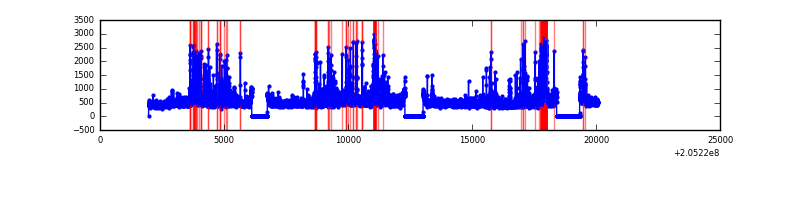 |
| C | 18108 | 15816 | 3 | 3 | 0.02% | 0.02% | 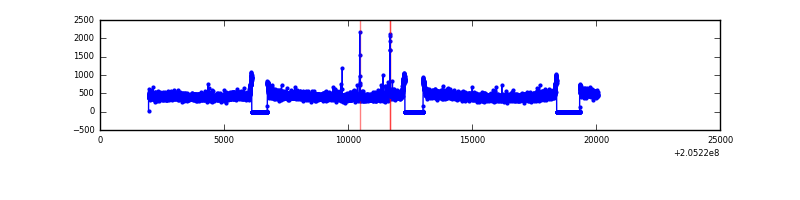 |
| D | 18108 | 15816 | 1257 | 1257 | 6.94% | 7.95% | 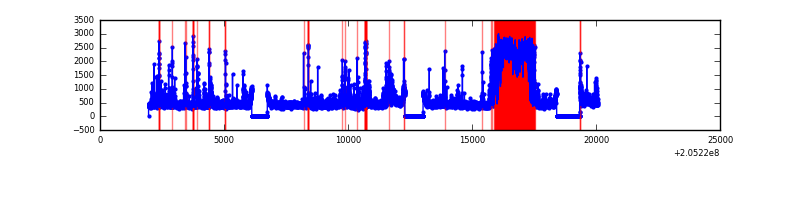 |
Top three noisy pixels from each quadrant. If the there are fewer than three noisy pixels in the level2.evt file, extra rows are filled as -1
| Pixel properties | Quadrant properties | ||||||
|---|---|---|---|---|---|---|---|
| Quadrant | DetID | PixID | Counts | Sigma | Mean | Median | Sigma |
| A | 8 | 15 | 314430 | 850.61 | 1787 | 1750 | 367.6 |
| A | 0 | 50 | 87277 | 232.67 | 1787 | 1750 | 367.6 |
| A | 0 | 118 | 72374 | 192.12 | 1787 | 1750 | 367.6 |
| B | 10 | 16 | 556243 | 1608.42 | 1796 | 1756 | 344.7 |
| B | 4 | 48 | 315957 | 911.41 | 1796 | 1756 | 344.7 |
| B | 15 | 204 | 254259 | 732.44 | 1796 | 1756 | 344.7 |
| C | 10 | 65 | 41092 | 97.06 | 1737 | 1742 | 405.4 |
| C | 13 | 61 | 14462 | 31.38 | 1737 | 1742 | 405.4 |
| C | 8 | 128 | 11524 | 24.13 | 1737 | 1742 | 405.4 |
| D | 13 | 53 | 3192449 | 7772.42 | 1704 | 1653 | 410.5 |
| D | 2 | 63 | 283880 | 687.47 | 1704 | 1653 | 410.5 |
| D | 10 | 172 | 104450 | 250.4 | 1704 | 1653 | 410.5 |
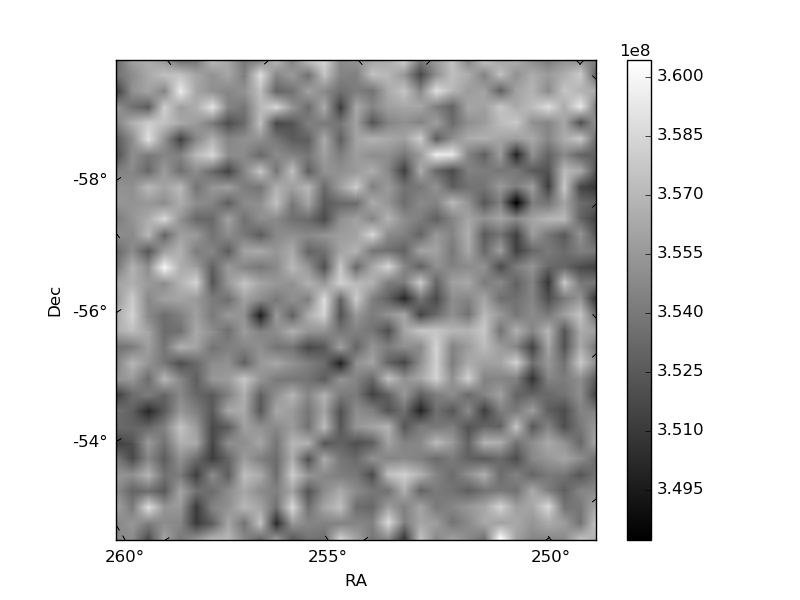
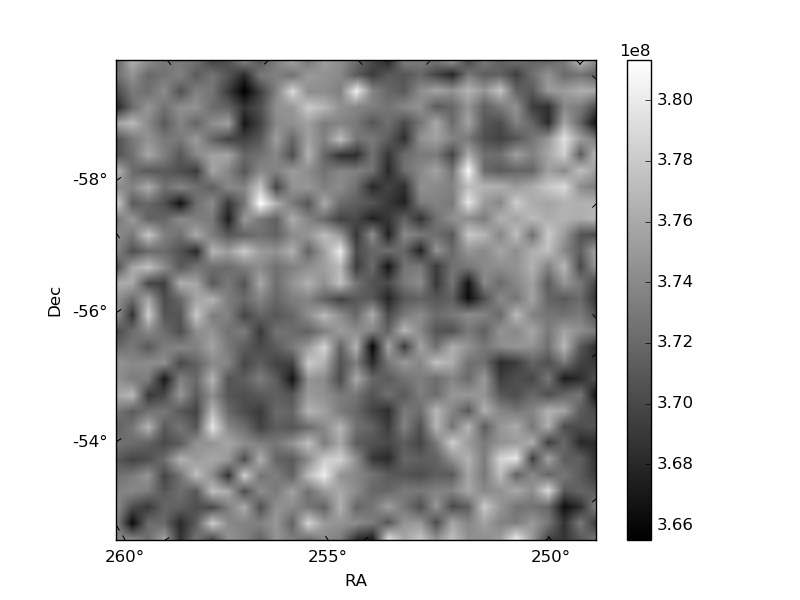
Histogram calculated using DETX and DETY for each event in the final _common_clean file
| Quadrant A |  |
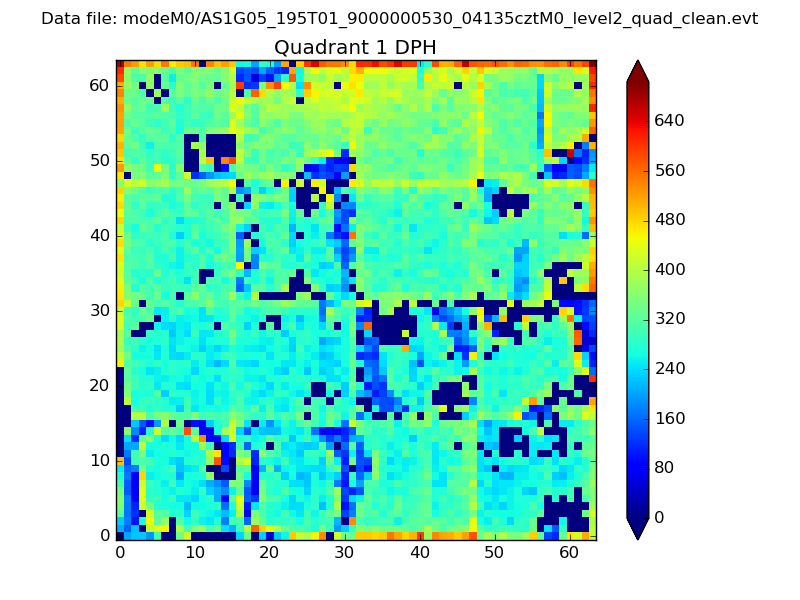 |
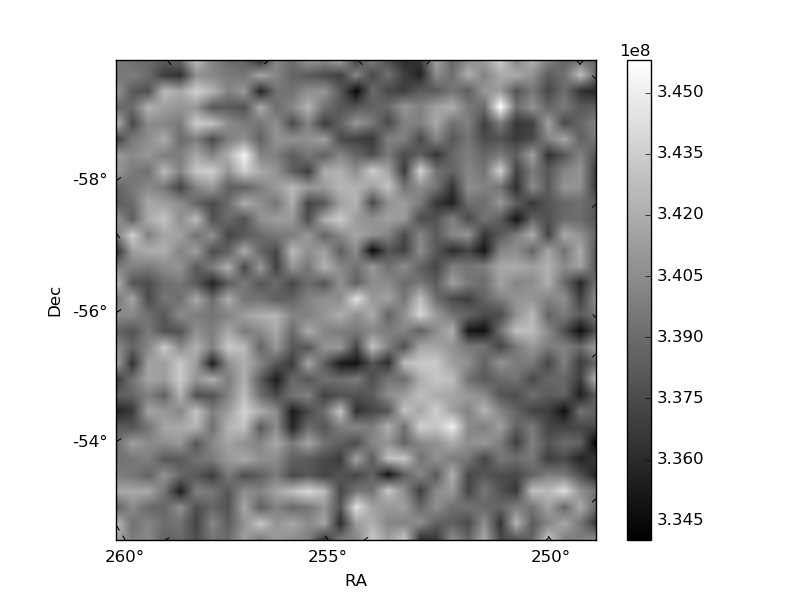
Quadrant B |
|---|---|---|---|
| Quadrant D | 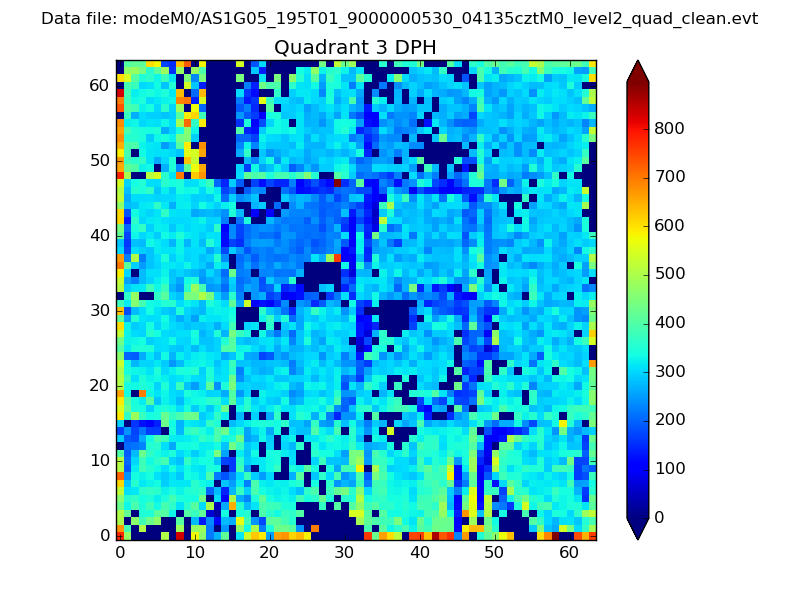 |
 |
Quadrant C |
| Plot type | Count rate plots | Images |
|---|---|---|
| Comparison with Poisson distribution Blue bars denote a histogram of data divided into 1 sec bins. Red curve is a Poisson curve with rate = median count rate of data. |
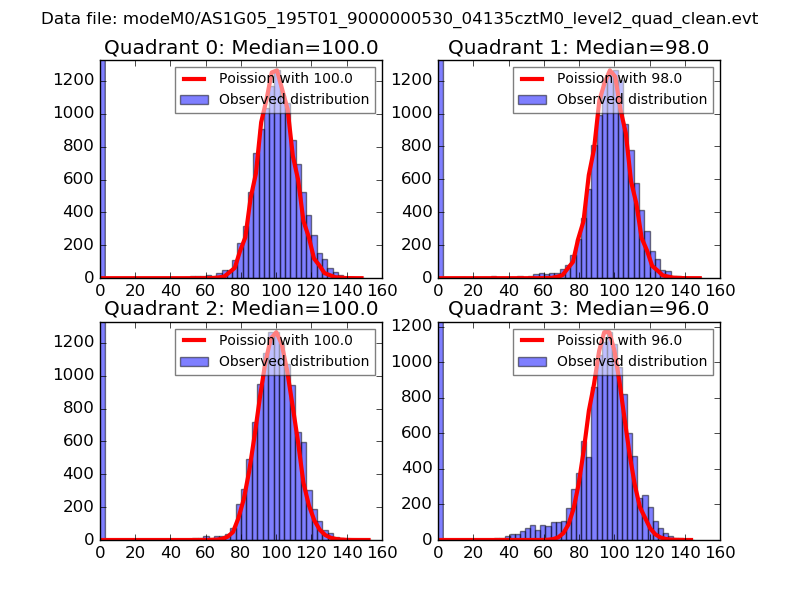 |
 |
| Quadrant-wise count rates Data is divided into 100 sec bins |
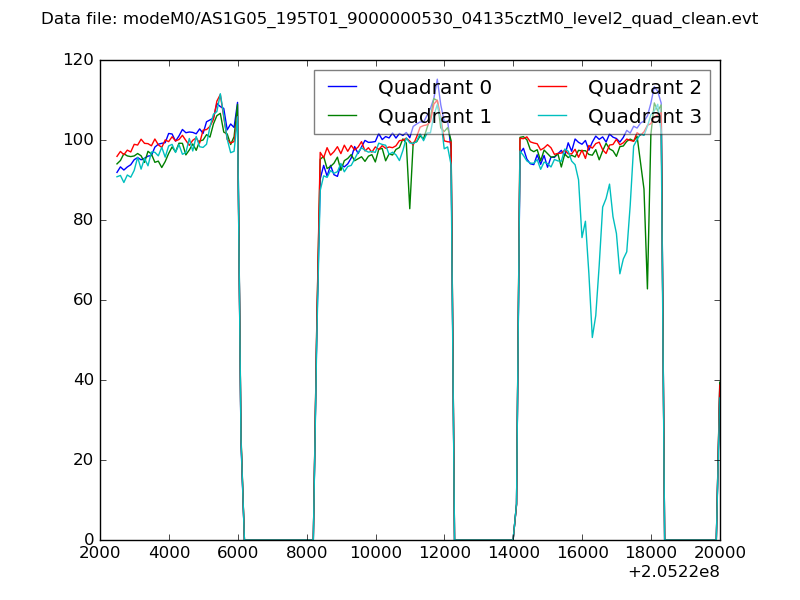 |
|
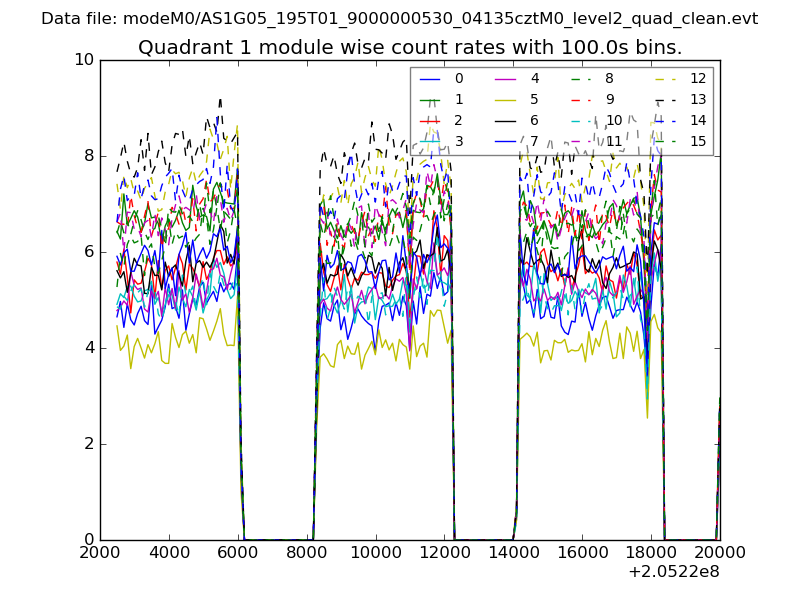
| Module-wise count rates for Quadrant A Data is divided into 100 sec bins |
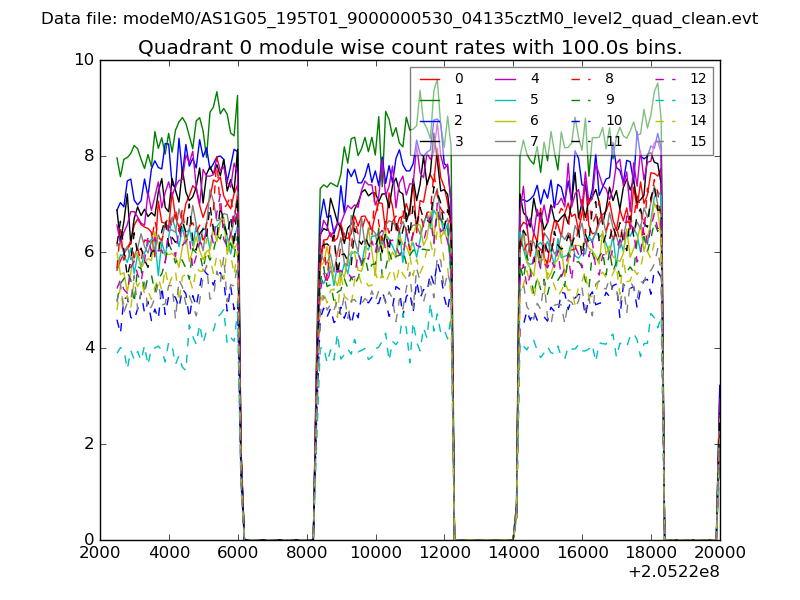 |
 |
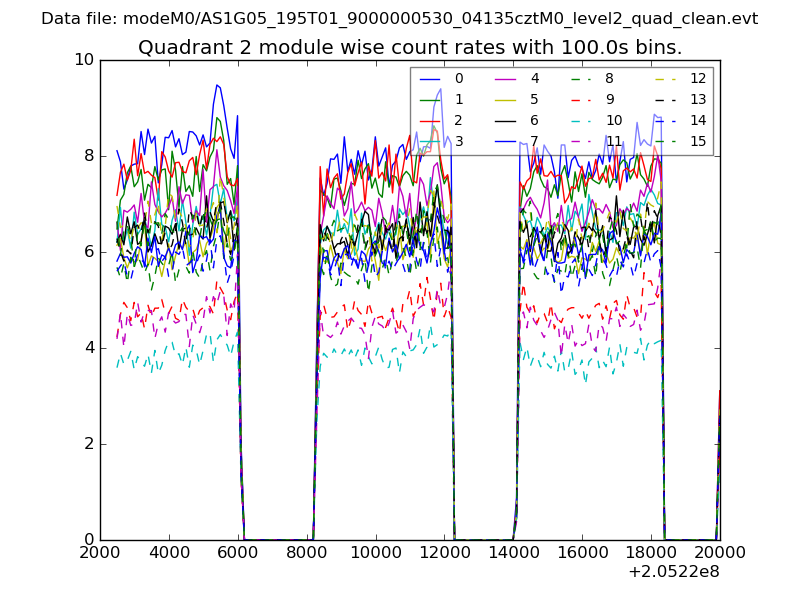
| Module-wise count rates for Quadrant B Data is divided into 100 sec bins |
 |
 |
| Module-wise count rates for Quadrant C Data is divided into 100 sec bins |
 |
 |
| Module-wise count rates for Quadrant D Data is divided into 100 sec bins |
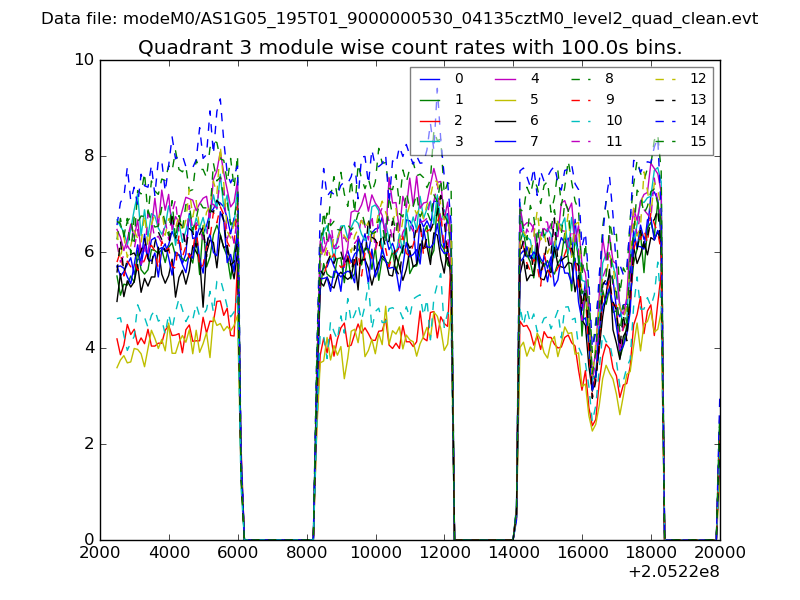 |
 |
| Parameter | Plot |
|---|---|
| CZT HV Monitor | 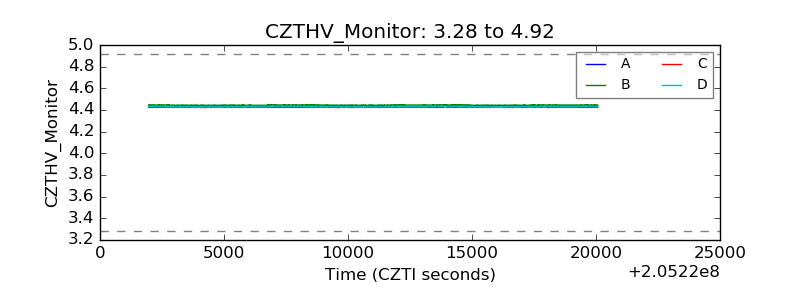 |
| D_VDD | 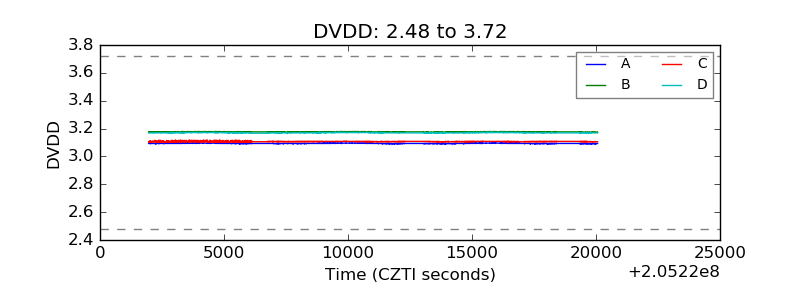 |
| Temperature 1 | 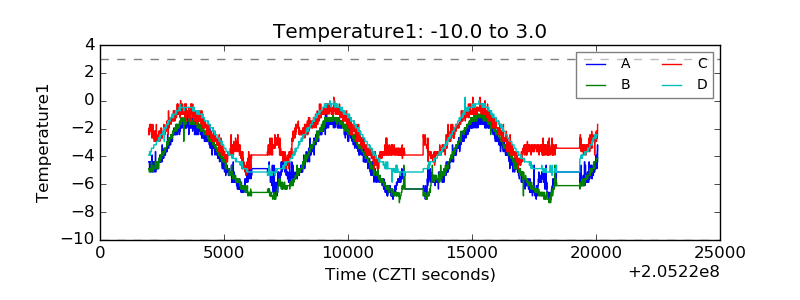 |
| Veto HV Monitor | 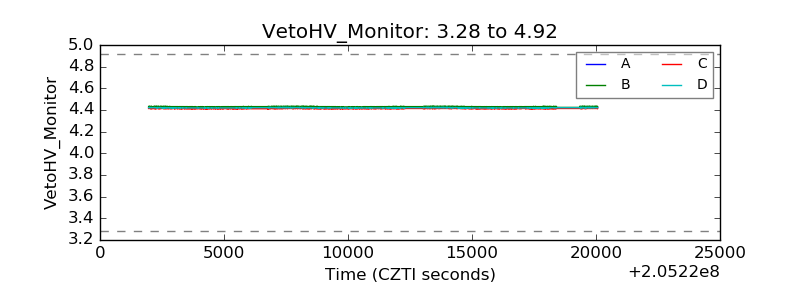 |
| Veto LLD | 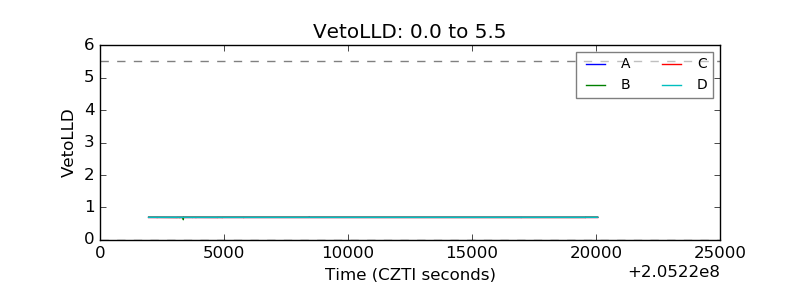 |
| Alpha Counter | 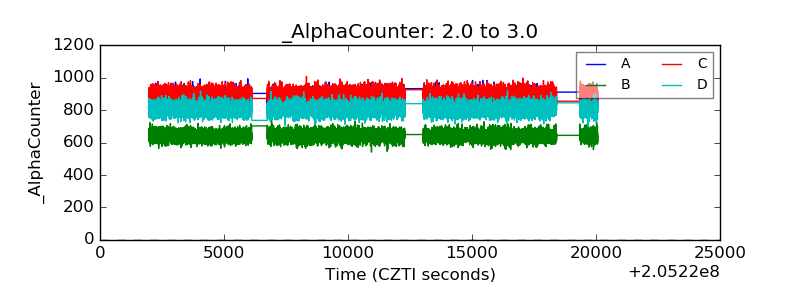 |
| _CPM_Rate | 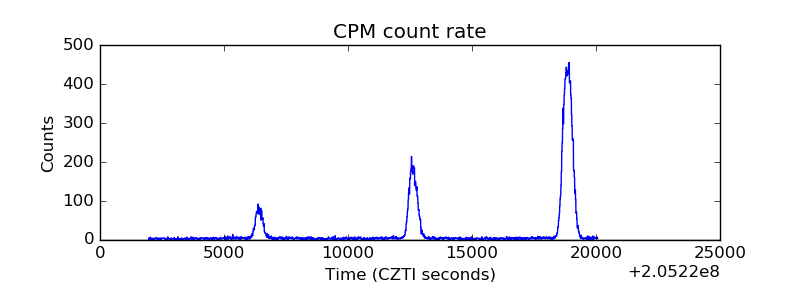 |
| CZT Counter |  |
| +2.5 Volts monitor |  |
| +5 Volts monitor |  |
| _ROLL_ROT | 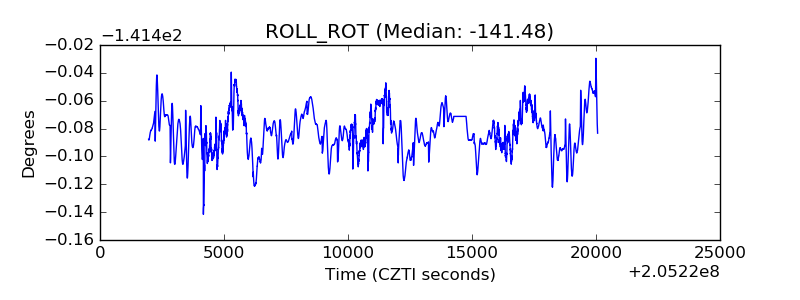 |
| _Roll_DEC | 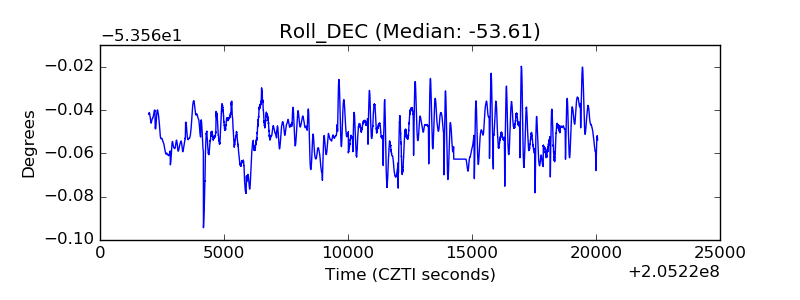 |
| _Roll_RA |  |
| Veto Counter | 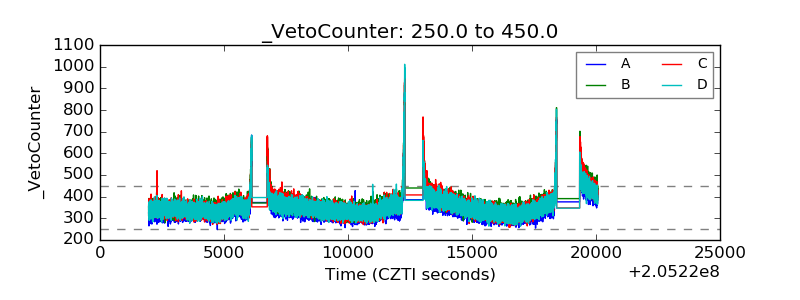 |