| Param | Original file | Final file |
|---|---|---|
| Filename | modeM0/AS1SLEW_01234_9000000527_04114cztM0_level2.evt | modeM0/AS1SLEW_01234_9000000527_04114cztM0_level2_quad_clean.evt |
| Size (bytes) | 21,052,800 | 6,295,680 |
| Size | 20.1 MB | 6.0 MB |
| Events in quadrant A | 153,529 | 37,817 |
| Events in quadrant B | 164,671 | 38,496 |
| Events in quadrant C | 148,914 | 39,379 |
| Events in quadrant D | 139,286 | 37,981 |
| Mode SS | |||
|---|---|---|---|
| Quadrant | BADHDUFLAG | Total packets | Discarded packets |
| A | 0 | 8 | 0 |
| B | 0 | 8 | 0 |
| C | 0 | 8 | 0 |
| D | 0 | 8 | 0 |
| Mode M0 | |||
|---|---|---|---|
| Quadrant | BADHDUFLAG | Total packets | Discarded packets |
| A | 0 | 810 | 0 |
| B | 0 | 812 | 0 |
| C | 0 | 806 | 0 |
| D | 0 | 804 | 0 |
| Quadrant | Total seconds | Saturated seconds | Saturation percentage |
|---|---|---|---|
| A | 403 | 0 | 0.000000% |
| B | 403 | 0 | 0.000000% |
| C | 403 | 0 | 0.000000% |
| D | 403 | 0 | 0.000000% |
Noise dominated data is calculated using 1-second bins in cleaned event files. If a bin has >2000 counts, and if more than 50% of those come from <1% of pixels, then it is considered to be noise-dominated and hence unusable.
| Quadrant | # 1 sec bins | Bins with >0 counts | Bins with >2000 counts | High rate bins dominated by noise | Noise dominated (total time) | Noise dominated (detector-on time) | Marked lightcurve |
|---|---|---|---|---|---|---|---|
| A | 403 | 403 | 0 | 0 | 0.00% | 0.00% | 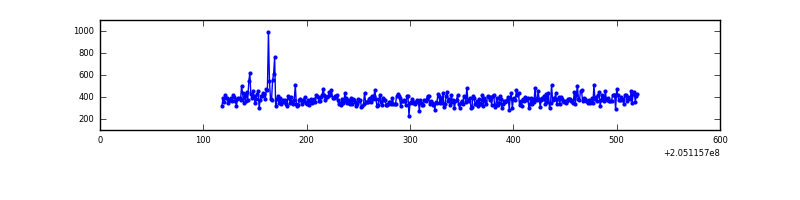 |
| B | 403 | 403 | 0 | 0 | 0.00% | 0.00% | 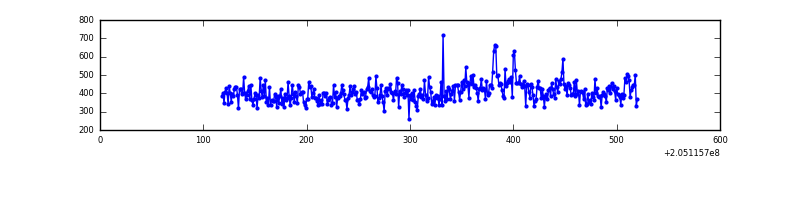 |
| C | 402 | 402 | 0 | 0 | 0.00% | 0.00% | 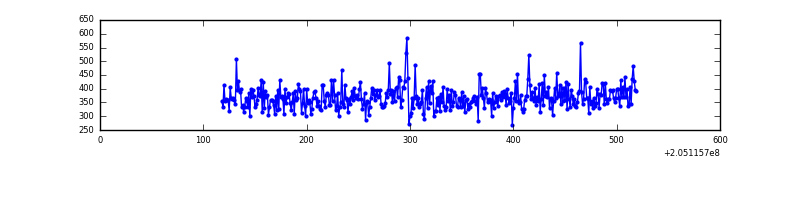 |
| D | 402 | 402 | 0 | 0 | 0.00% | 0.00% | 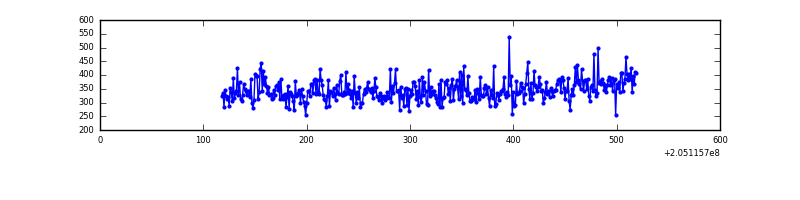 |
Top three noisy pixels from each quadrant. If the there are fewer than three noisy pixels in the level2.evt file, extra rows are filled as -1
| Pixel properties | Quadrant properties | ||||||
|---|---|---|---|---|---|---|---|
| Quadrant | DetID | PixID | Counts | Sigma | Mean | Median | Sigma |
| A | 0 | 50 | 4618 | 464.68 | 38 | 37 | 9.9 |
| A | 0 | 199 | 834 | 80.85 | 38 | 37 | 9.9 |
| A | 0 | 226 | 439 | 40.78 | 38 | 37 | 9.9 |
| B | 15 | 204 | 7916 | 793.37 | 39 | 38 | 9.9 |
| B | 14 | 167 | 1574 | 154.69 | 39 | 38 | 9.9 |
| B | 0 | 229 | 1464 | 143.61 | 39 | 38 | 9.9 |
| C | 10 | 65 | 2791 | 263.7 | 37 | 37 | 10.4 |
| C | 13 | 61 | 325 | 27.58 | 37 | 37 | 10.4 |
| C | 3 | 202 | 93 | 5.36 | 37 | 37 | 10.4 |
| D | 10 | 67 | 1164 | 105.42 | 36 | 35 | 10.7 |
| D | 14 | 226 | 384 | 32.59 | 36 | 35 | 10.7 |
| D | 10 | 172 | 310 | 25.68 | 36 | 35 | 10.7 |
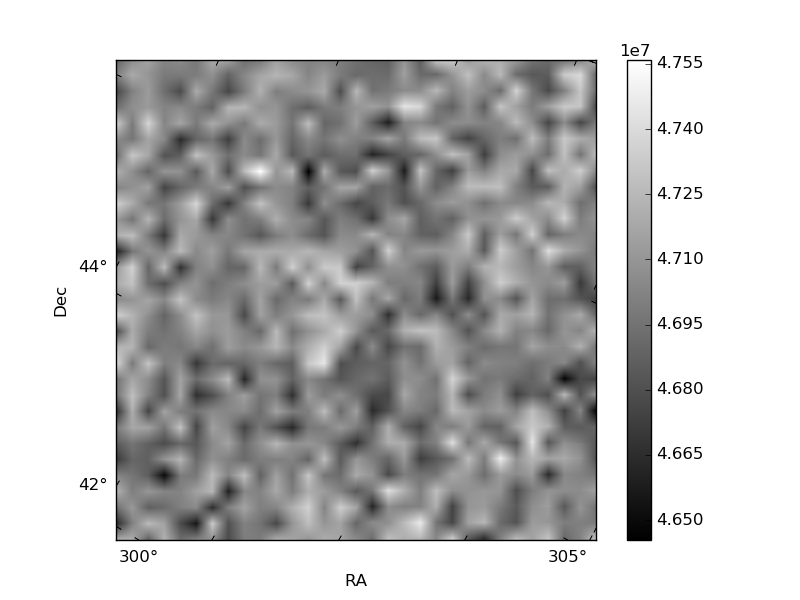
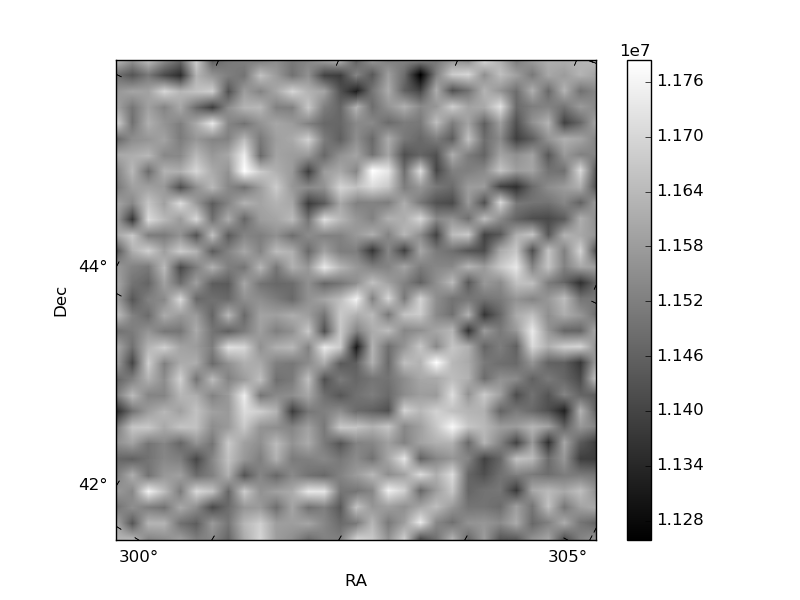
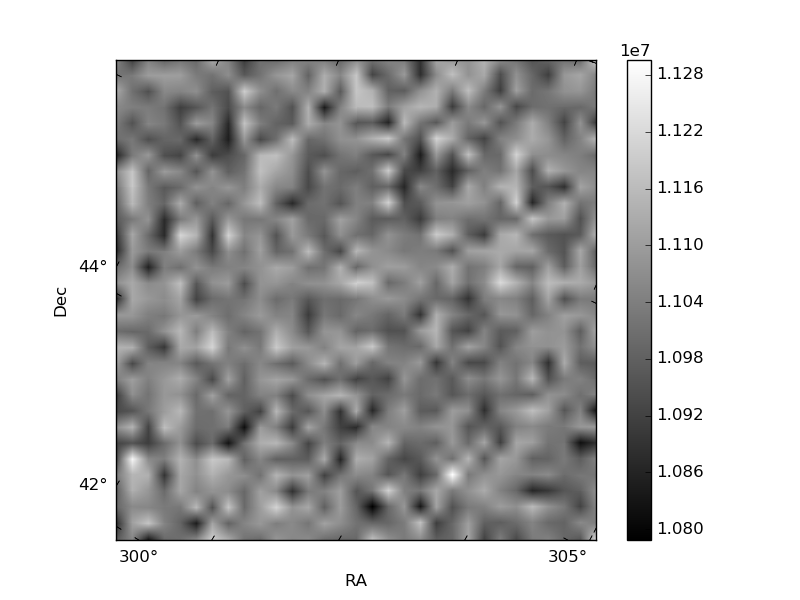
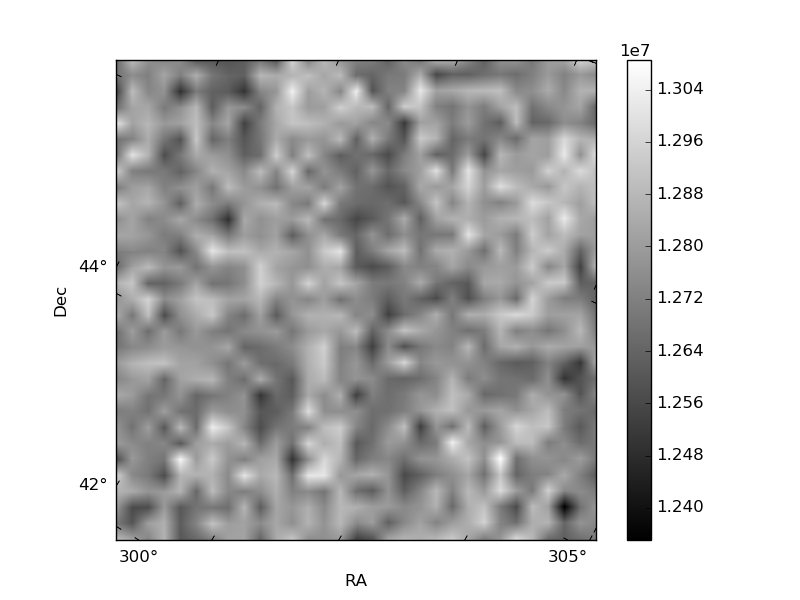
Histogram calculated using DETX and DETY for each event in the final _common_clean file
| Quadrant A |  |
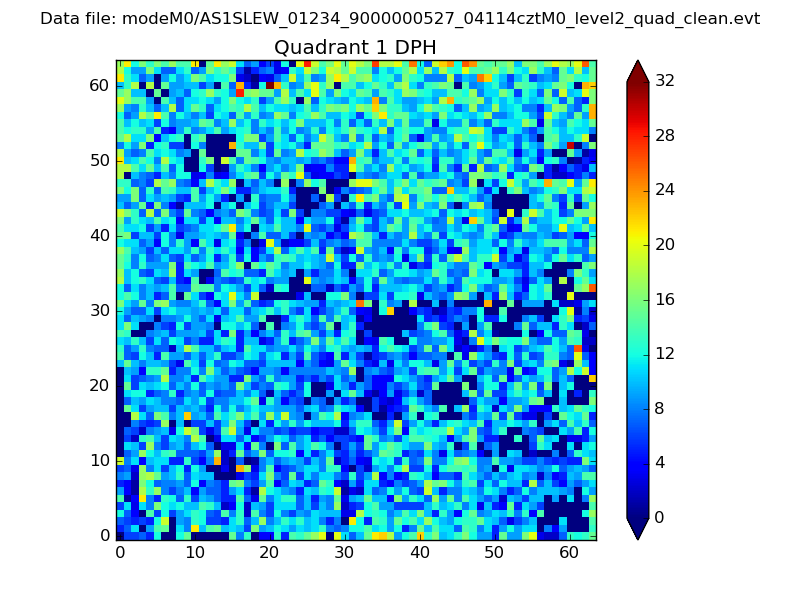 |
Quadrant B |
|---|---|---|---|
| Quadrant D | 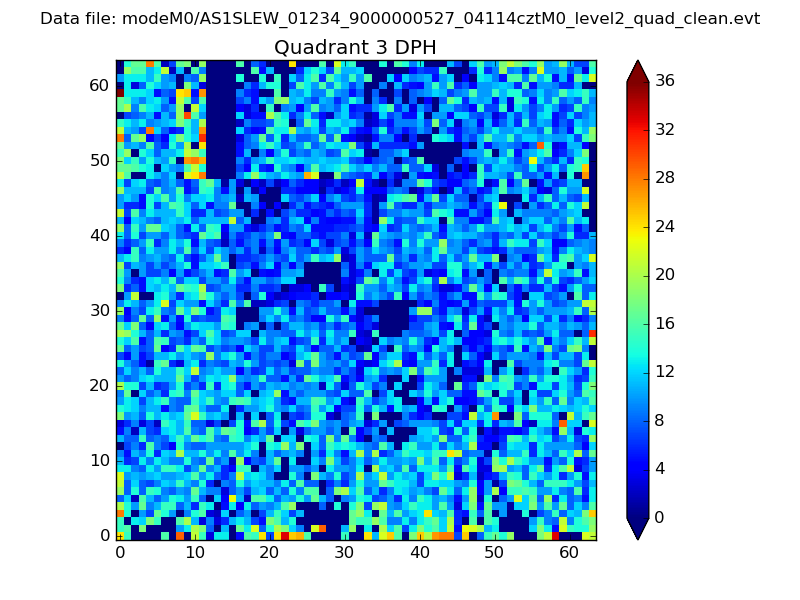 |
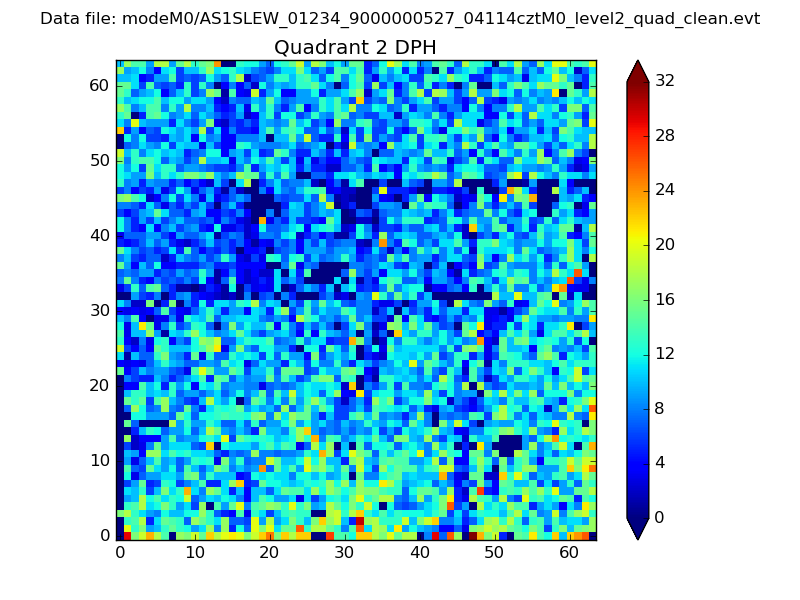 |
Quadrant C |
| Plot type | Count rate plots | Images |
|---|---|---|
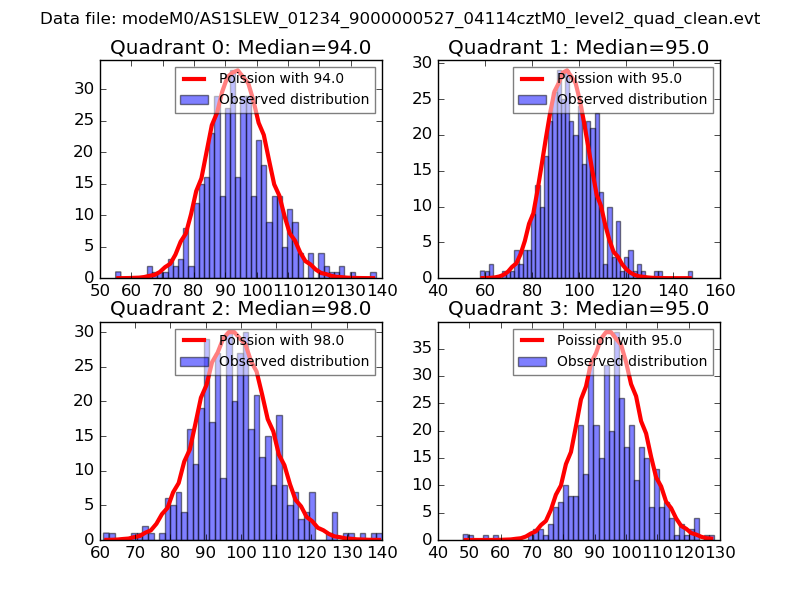
| Comparison with Poisson distribution Blue bars denote a histogram of data divided into 1 sec bins. Red curve is a Poisson curve with rate = median count rate of data. |
 |
 |
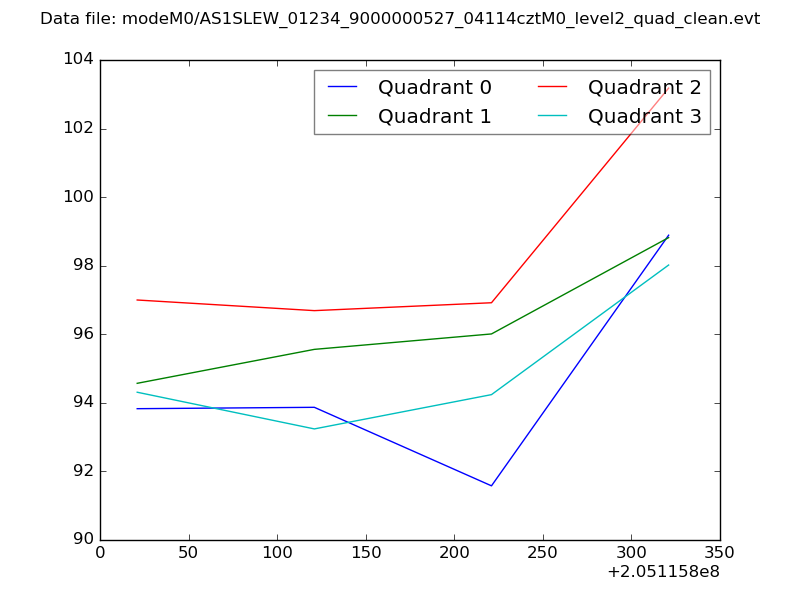
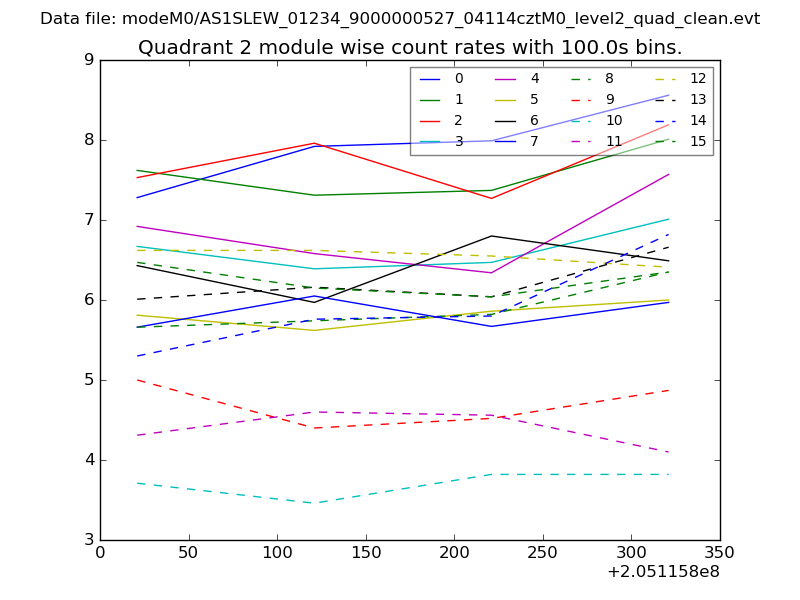
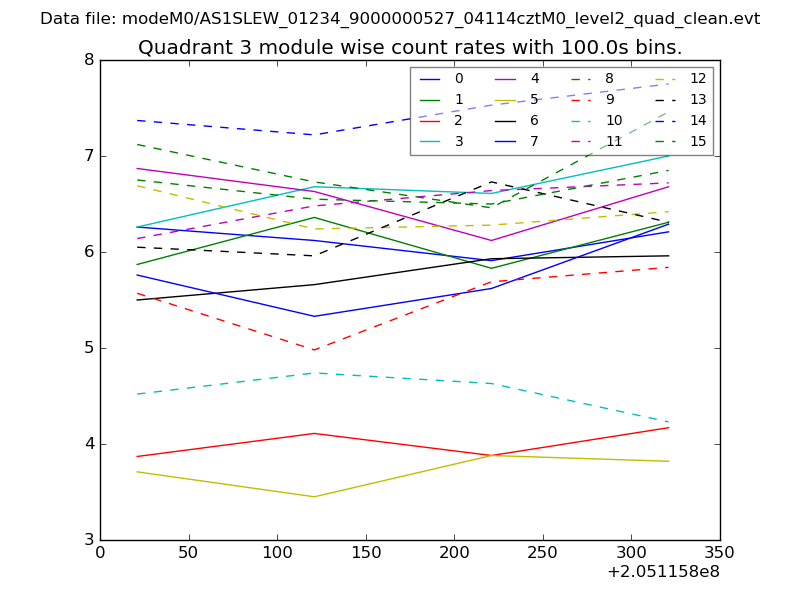
| Quadrant-wise count rates Data is divided into 100 sec bins |
 |
|
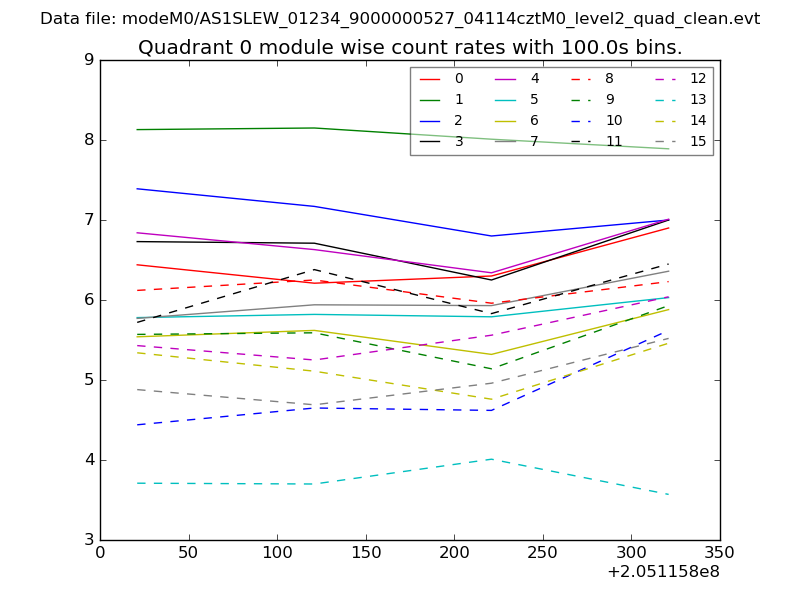
| Module-wise count rates for Quadrant A Data is divided into 100 sec bins |
 |
 |
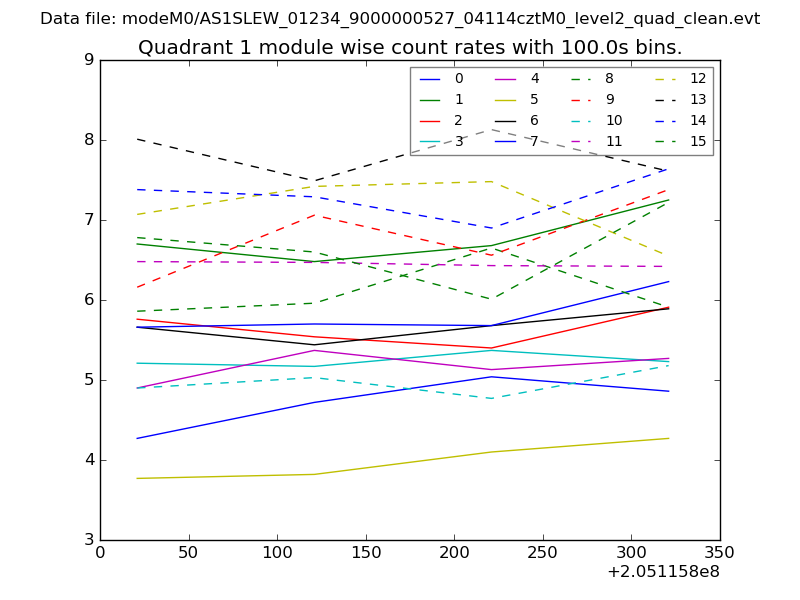
| Module-wise count rates for Quadrant B Data is divided into 100 sec bins |
 |
 |
| Module-wise count rates for Quadrant C Data is divided into 100 sec bins |
 |
 |
| Module-wise count rates for Quadrant D Data is divided into 100 sec bins |
 |
 |
| Parameter | Plot |
|---|---|
| CZT HV Monitor | 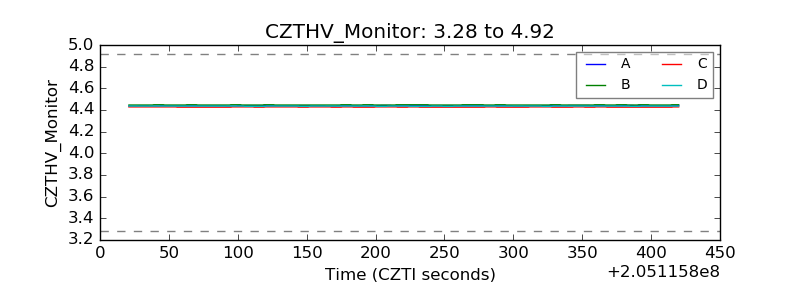 |
| D_VDD | 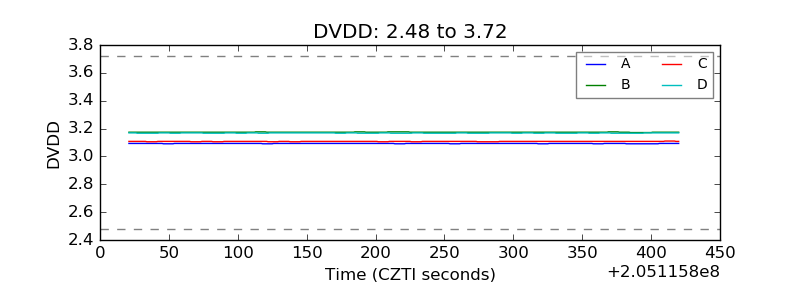 |
| Temperature 1 | 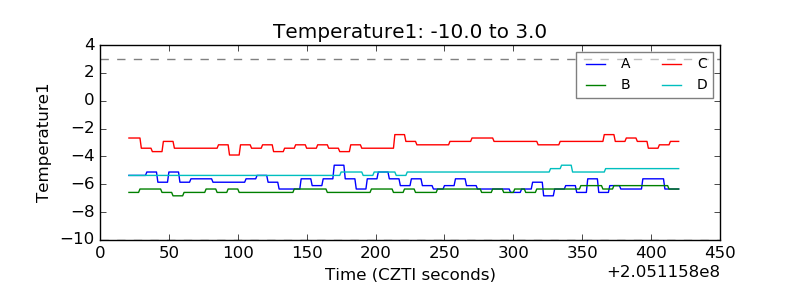 |
| Veto HV Monitor | 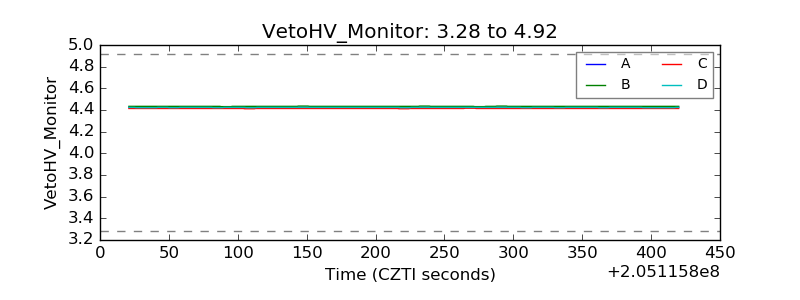 |
| Veto LLD | 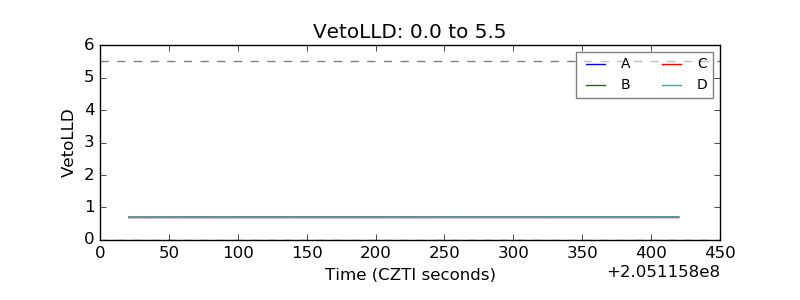 |
| Alpha Counter | 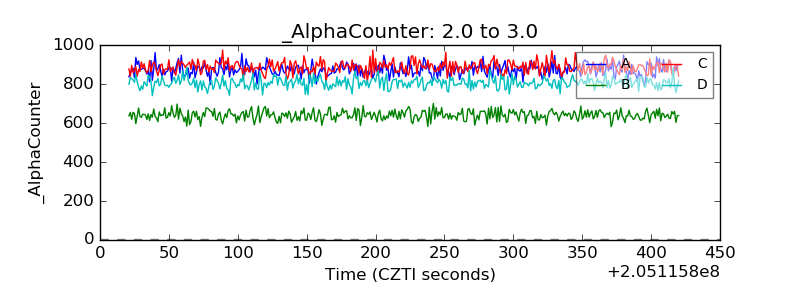 |
| _CPM_Rate | 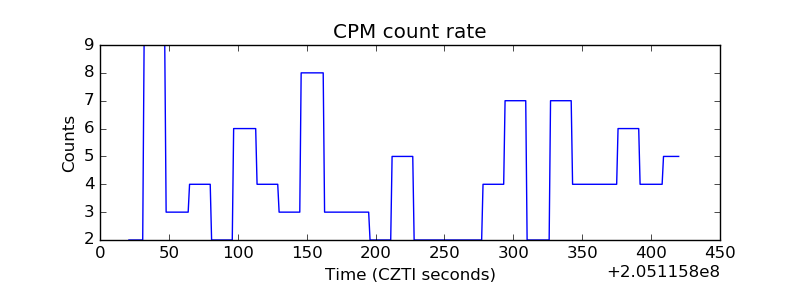 |
| CZT Counter | 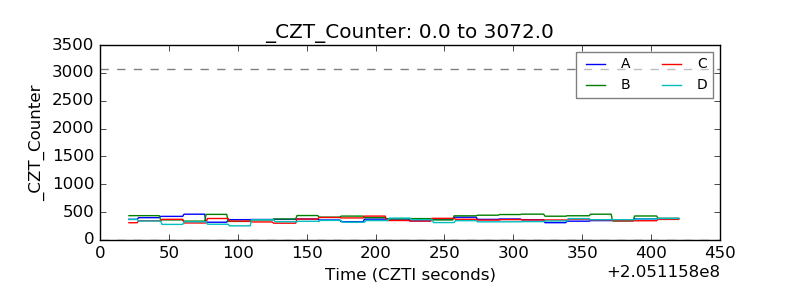 |
| +2.5 Volts monitor |  |
| +5 Volts monitor |  |
| _ROLL_ROT | 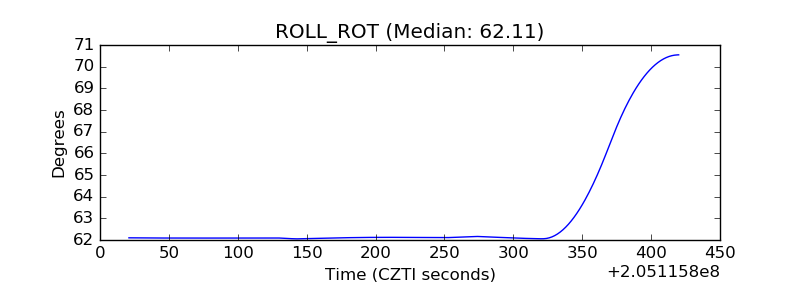 |
| _Roll_DEC | 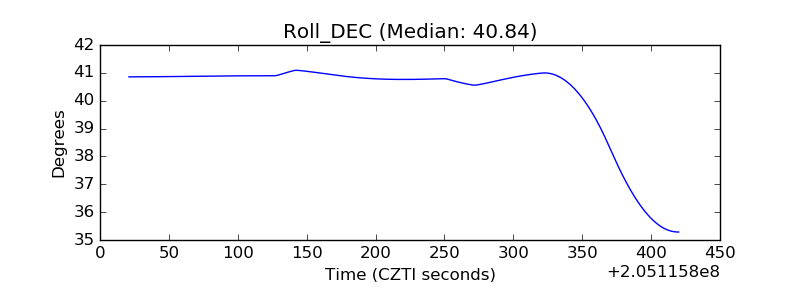 |
| _Roll_RA | 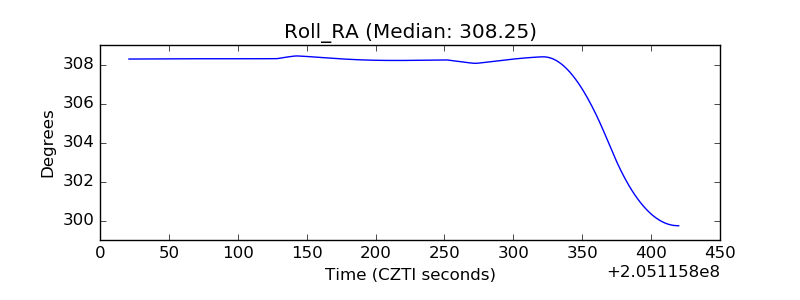 |
| Veto Counter | 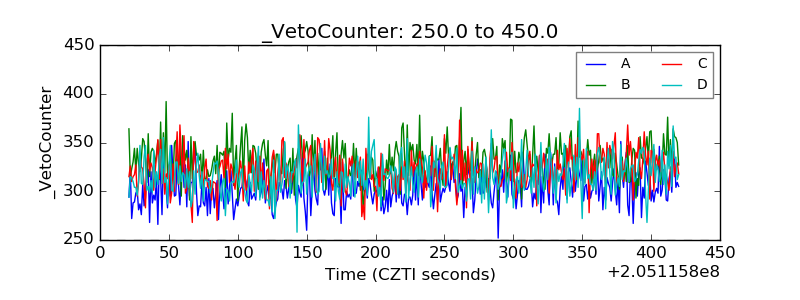 |