| Param | Original file | Final file |
|---|---|---|
| Filename | modeM0/AS1G05_213T01_9000000534cztM0_level2.fits | modeM0/AS1G05_213T01_9000000534cztM0_level2_quad_clean.evt |
| Size (bytes) | 66,528,000 | 59,578,560 |
| Size | 63.4 MB | 56.8 MB |
| Events in quadrant A | 407,574 | 350,975 |
| Events in quadrant B | 394,730 | 351,439 |
| Events in quadrant C | 397,336 | 332,588 |
| Events in quadrant D | 338,660 | 291,766 |
| Mode M9 | |||
|---|---|---|---|
| Quadrant | BADHDUFLAG | Total packets | Discarded packets |
| A | 0 | 26 | 0 |
| B | 0 | 26 | 0 |
| C | 0 | 26 | 0 |
| D | 0 | 26 | 0 |
| Mode M0 | |||
|---|---|---|---|
| Quadrant | BADHDUFLAG | Total packets | Discarded packets |
| A | 0 | 14475 | 0 |
| B | 0 | 14659 | 0 |
| C | 0 | 14031 | 0 |
| D | 0 | 18827 | 0 |
| Mode SS | |||
|---|---|---|---|
| Quadrant | BADHDUFLAG | Total packets | Discarded packets |
| A | 0 | 142 | 0 |
| B | 0 | 142 | 0 |
| C | 0 | 142 | 0 |
| D | 0 | 142 | 0 |
| Quadrant | Total seconds | Saturated seconds | Saturation percentage |
|---|---|---|---|
| A | 6837 | 67 | 0.979962% |
| B | 6837 | 39 | 0.570426% |
| C | 6837 | 18 | 0.263273% |
| D | 6837 | 334 | 4.885184% |
Noise dominated data is calculated using 1-second bins in cleaned event files. If a bin has >2000 counts, and if more than 50% of those come from <1% of pixels, then it is considered to be noise-dominated and hence unusable.
| Quadrant | # 1 sec bins | Bins with >0 counts | Bins with >2000 counts | High rate bins dominated by noise | Noise dominated (total time) | Noise dominated (detector-on time) | Marked lightcurve |
|---|---|---|---|---|---|---|---|
| A | 9446 | 6834 | 0 | 0 | 0.00% | 0.00% |  |
| B | 9447 | 6835 | 0 | 0 | 0.00% | 0.00% |  |
| C | 9446 | 6834 | 0 | 0 | 0.00% | 0.00% |  |
| D | 9446 | 6832 | 0 | 0 | 0.00% | 0.00% |  |
Top three noisy pixels from each quadrant. If the there are fewer than three noisy pixels in the level2.evt file, extra rows are filled as -1
| Pixel properties | Quadrant properties | ||||||
|---|---|---|---|---|---|---|---|
| Quadrant | DetID | PixID | Counts | Sigma | Mean | Median | Sigma |
| A | 0 | 29 | 373 | 9.54 | 106 | 100 | 28.6 |
| A | 7 | 110 | 347 | 8.63 | 106 | 100 | 28.6 |
| A | 9 | 19 | 313 | 7.44 | 106 | 100 | 28.6 |
| B | 2 | 9 | 343 | 10.55 | 104 | 100 | 23.0 |
| B | 12 | 226 | 275 | 7.6 | 104 | 100 | 23.0 |
| B | 5 | 128 | 261 | 6.99 | 104 | 100 | 23.0 |
| C | 1 | 80 | 295 | 6.62 | 105 | 98 | 29.8 |
| C | 12 | 241 | 288 | 6.38 | 105 | 98 | 29.8 |
| C | 9 | 188 | 288 | 6.38 | 105 | 98 | 29.8 |
| D | 11 | 82 | 290 | 7.45 | 96 | 88 | 27.1 |
| D | 7 | 5 | 258 | 6.27 | 96 | 88 | 27.1 |
| D | 10 | 189 | 248 | 5.9 | 96 | 88 | 27.1 |
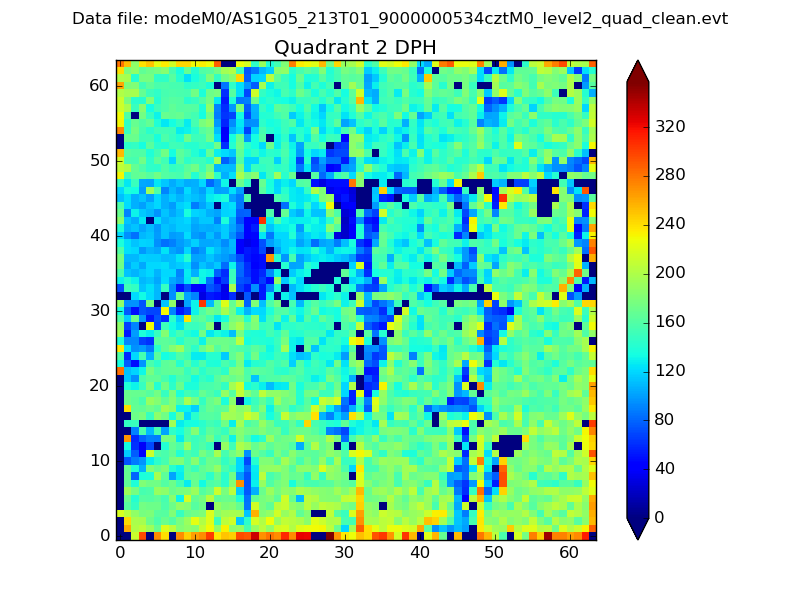
Histogram calculated using DETX and DETY for each event in the final _common_clean file
| Quadrant A |  |
 |
Quadrant B |
|---|---|---|---|
| Quadrant D |  |
 |
Quadrant C |
| Plot type | Count rate plots | Images |
|---|---|---|
| Comparison with Poisson distribution Blue bars denote a histogram of data divided into 1 sec bins. Red curve is a Poisson curve with rate = median count rate of data. |
 |
 |
| Quadrant-wise count rates Data is divided into 100 sec bins |
 |
|
| Module-wise count rates for Quadrant A Data is divided into 100 sec bins |
 |
 |
| Module-wise count rates for Quadrant B Data is divided into 100 sec bins |
 |
 |
| Module-wise count rates for Quadrant C Data is divided into 100 sec bins |
 |
 |
| Module-wise count rates for Quadrant D Data is divided into 100 sec bins |
 |
 |
| Parameter | Plot |
|---|---|
| CZT HV Monitor |  |
| D_VDD | 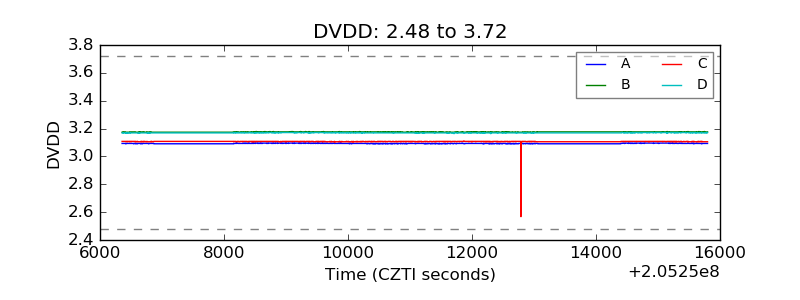 |
| Temperature 1 |  |
| Veto HV Monitor |  |
| Veto LLD |  |
| Alpha Counter |  |
| _CPM_Rate |  |
| CZT Counter |  |
| +2.5 Volts monitor |  |
| +5 Volts monitor |  |
| _ROLL_ROT |  |
| _Roll_DEC |  |
| _Roll_RA |  |
| Veto Counter |  |