| Param | Original file | Final file |
|---|---|---|
| Filename | modeM0/AS1G05_213T01_9000000534_04138cztM0_level2.evt | modeM0/AS1G05_213T01_9000000534_04138cztM0_level2_quad_clean.evt |
| Size (bytes) | 178,450,560 | 35,444,160 |
| Size | 170.2 MB | 33.8 MB |
| Events in quadrant A | 1,088,566 | 238,664 |
| Events in quadrant B | 1,082,391 | 242,745 |
| Events in quadrant C | 954,996 | 234,599 |
| Events in quadrant D | 2,142,277 | 213,346 |
| Mode M9 | |||
|---|---|---|---|
| Quadrant | BADHDUFLAG | Total packets | Discarded packets |
| A | 0 | 13 | 0 |
| B | 0 | 13 | 0 |
| C | 0 | 13 | 0 |
| D | 0 | 13 | 0 |
| Mode M0 | |||
|---|---|---|---|
| Quadrant | BADHDUFLAG | Total packets | Discarded packets |
| A | 0 | 4439 | 2 |
| B | 0 | 4451 | 1 |
| C | 0 | 4096 | 1 |
| D | 0 | 7681 | 1 |
| Mode SS | |||
|---|---|---|---|
| Quadrant | BADHDUFLAG | Total packets | Discarded packets |
| A | 0 | 42 | 0 |
| B | 0 | 42 | 0 |
| C | 0 | 42 | 0 |
| D | 0 | 42 | 0 |
| Quadrant | Total seconds | Saturated seconds | Saturation percentage |
|---|---|---|---|
| A | 1970 | 38 | 1.928934% |
| B | 1970 | 25 | 1.269036% |
| C | 1970 | 8 | 0.406091% |
| D | 1970 | 287 | 14.568528% |
Noise dominated data is calculated using 1-second bins in cleaned event files. If a bin has >2000 counts, and if more than 50% of those come from <1% of pixels, then it is considered to be noise-dominated and hence unusable.
| Quadrant | # 1 sec bins | Bins with >0 counts | Bins with >2000 counts | High rate bins dominated by noise | Noise dominated (total time) | Noise dominated (detector-on time) | Marked lightcurve |
|---|---|---|---|---|---|---|---|
| A | 3250 | 1971 | 17 | 17 | 0.52% | 0.86% | 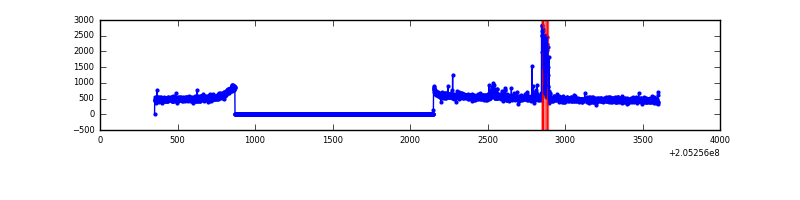 |
| B | 3250 | 1971 | 1 | 1 | 0.03% | 0.05% | 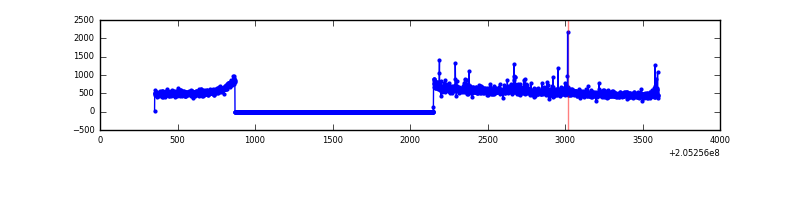 |
| C | 3250 | 1971 | 0 | 0 | 0.00% | 0.00% | 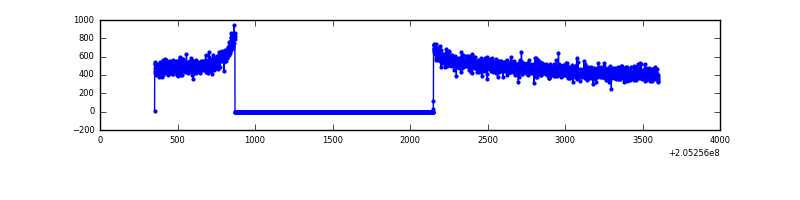 |
| D | 3250 | 1971 | 340 | 340 | 10.46% | 17.25% | 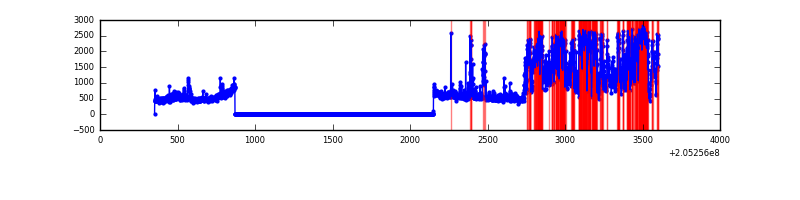 |
Top three noisy pixels from each quadrant. If the there are fewer than three noisy pixels in the level2.evt file, extra rows are filled as -1
| Pixel properties | Quadrant properties | ||||||
|---|---|---|---|---|---|---|---|
| Quadrant | DetID | PixID | Counts | Sigma | Mean | Median | Sigma |
| A | 0 | 118 | 68308 | 1253.09 | 258 | 253 | 54.3 |
| A | 13 | 14 | 13421 | 242.46 | 258 | 253 | 54.3 |
| A | 0 | 226 | 9476 | 169.82 | 258 | 253 | 54.3 |
| B | 14 | 167 | 25673 | 495.4 | 259 | 253 | 51.3 |
| B | 0 | 183 | 12849 | 245.48 | 259 | 253 | 51.3 |
| B | 15 | 54 | 11021 | 209.85 | 259 | 253 | 51.3 |
| C | 13 | 61 | 2016 | 30.7 | 244 | 245 | 57.7 |
| C | 10 | 65 | 706 | 7.99 | 244 | 245 | 57.7 |
| C | 1 | 16 | 599 | 6.14 | 244 | 245 | 57.7 |
| D | 1 | 52 | 1125138 | 19199.37 | 238 | 231 | 58.6 |
| D | 8 | 112 | 25569 | 432.46 | 238 | 231 | 58.6 |
| D | 13 | 137 | 21445 | 362.07 | 238 | 231 | 58.6 |
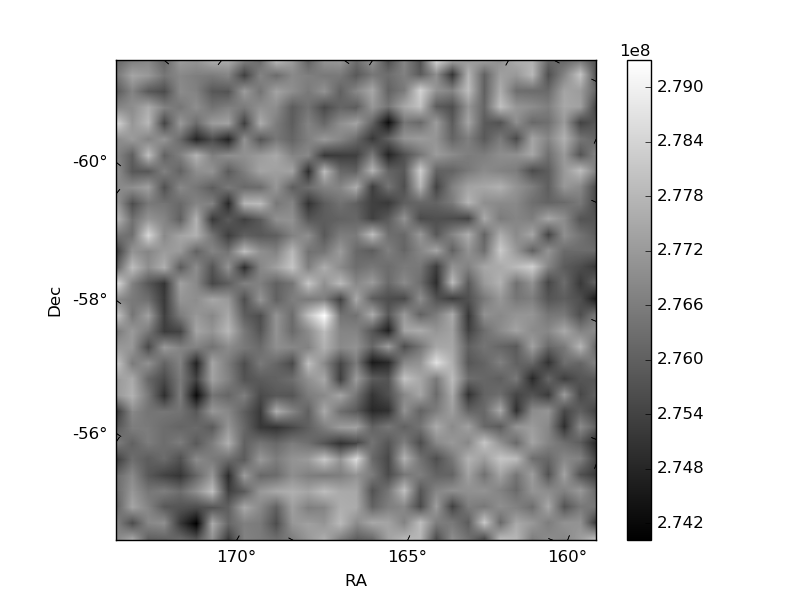
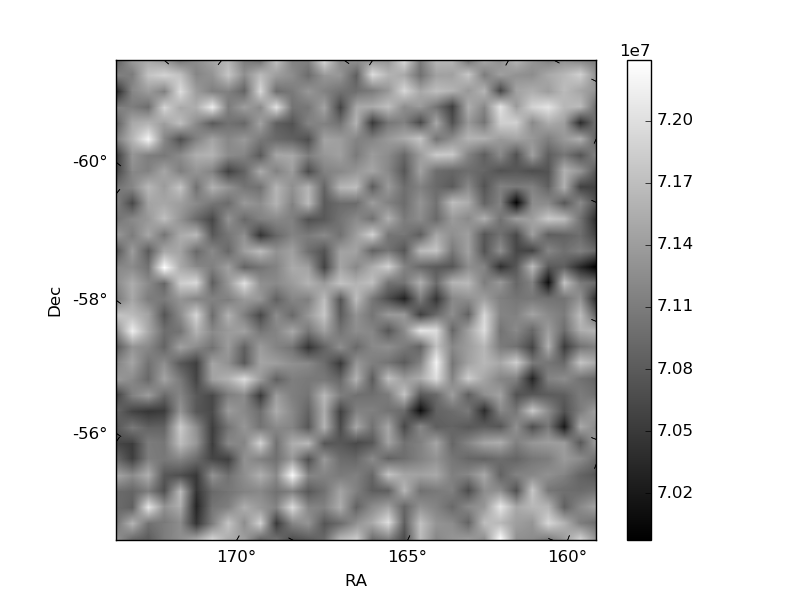
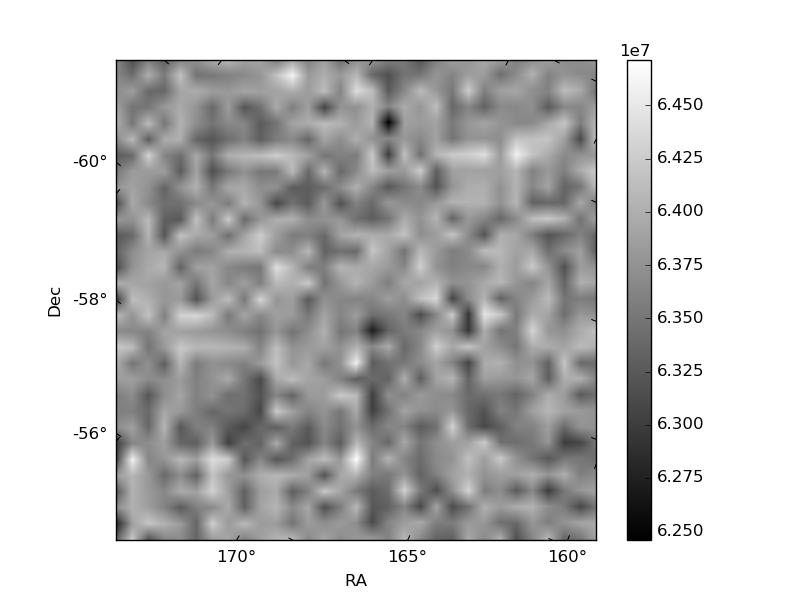
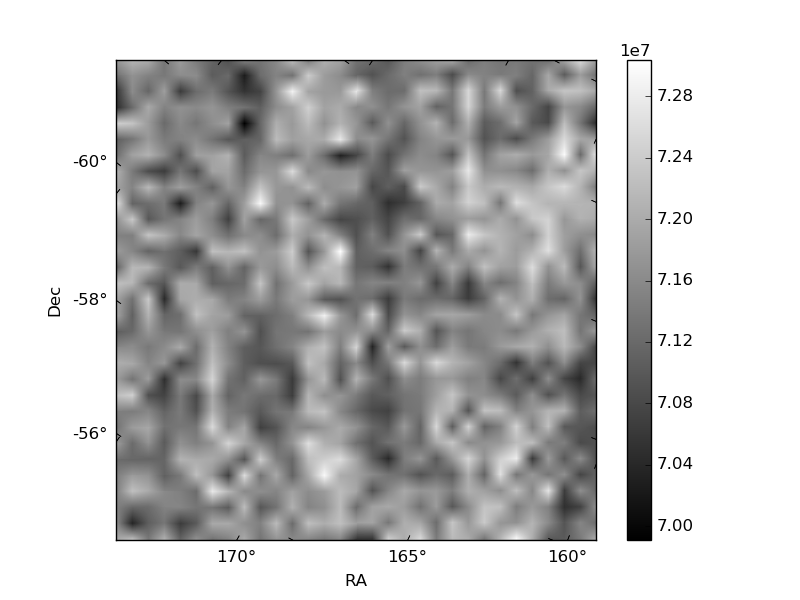
Histogram calculated using DETX and DETY for each event in the final _common_clean file
| Quadrant A | 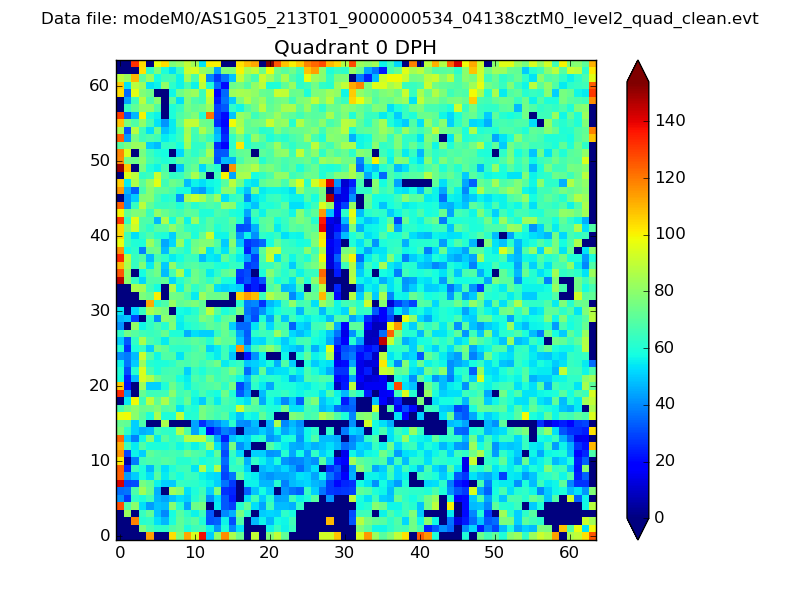 |
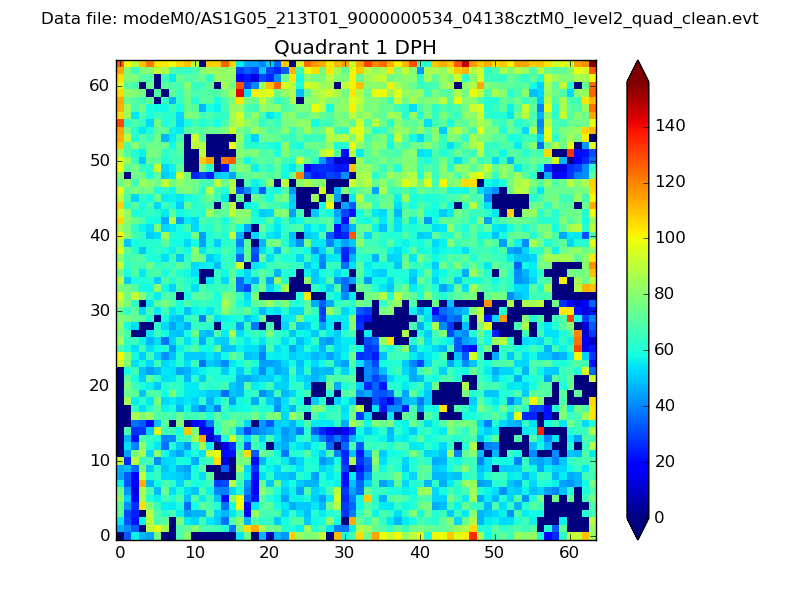 |
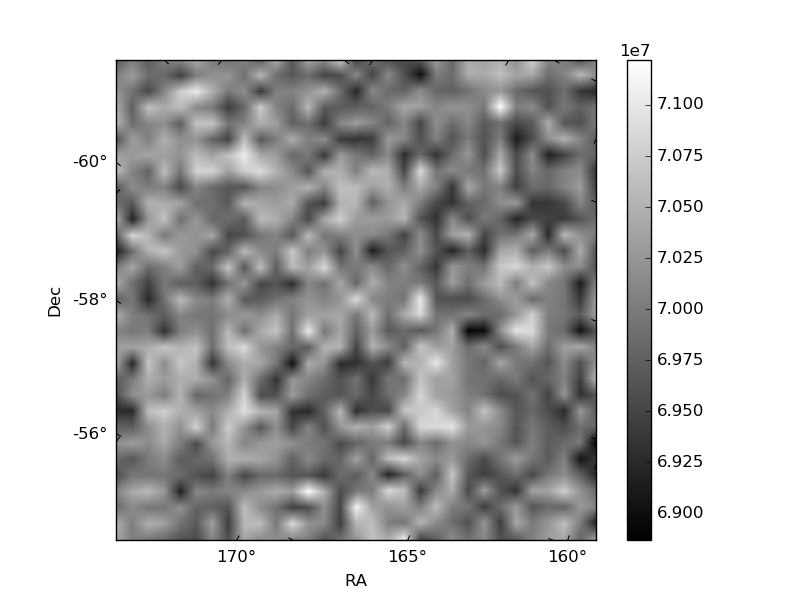
Quadrant B |
|---|---|---|---|
| Quadrant D | 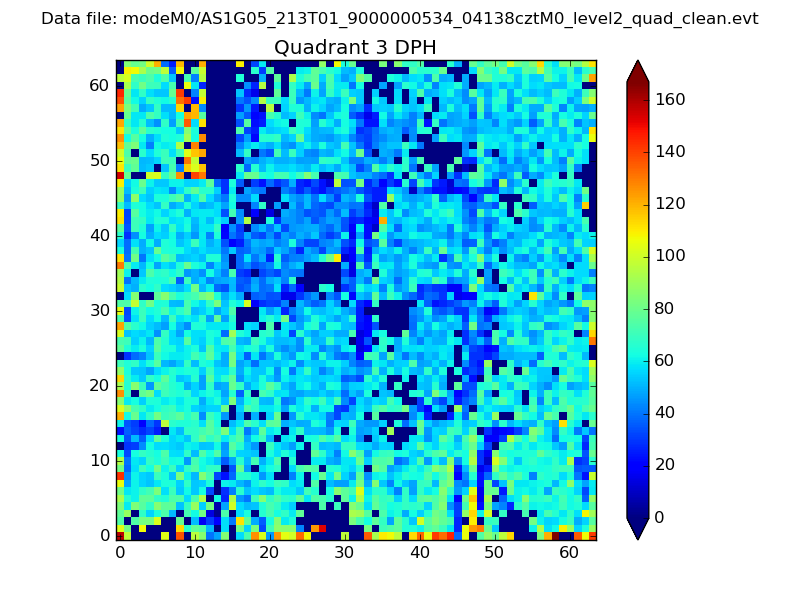 |
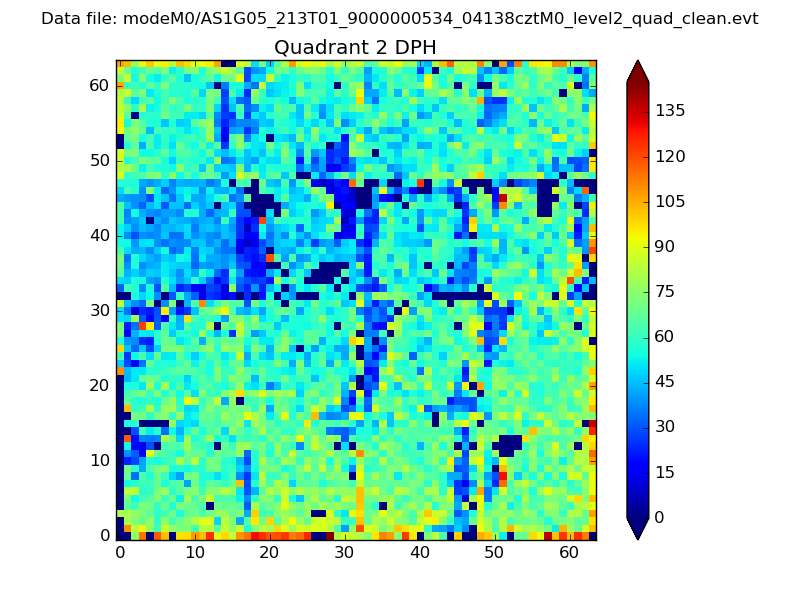 |
Quadrant C |
| Plot type | Count rate plots | Images |
|---|---|---|
| Comparison with Poisson distribution Blue bars denote a histogram of data divided into 1 sec bins. Red curve is a Poisson curve with rate = median count rate of data. |
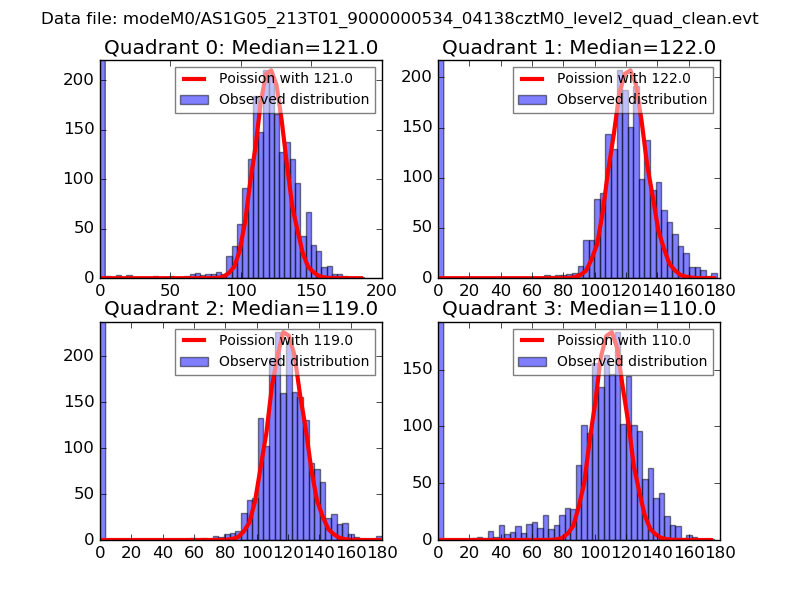 |
 |
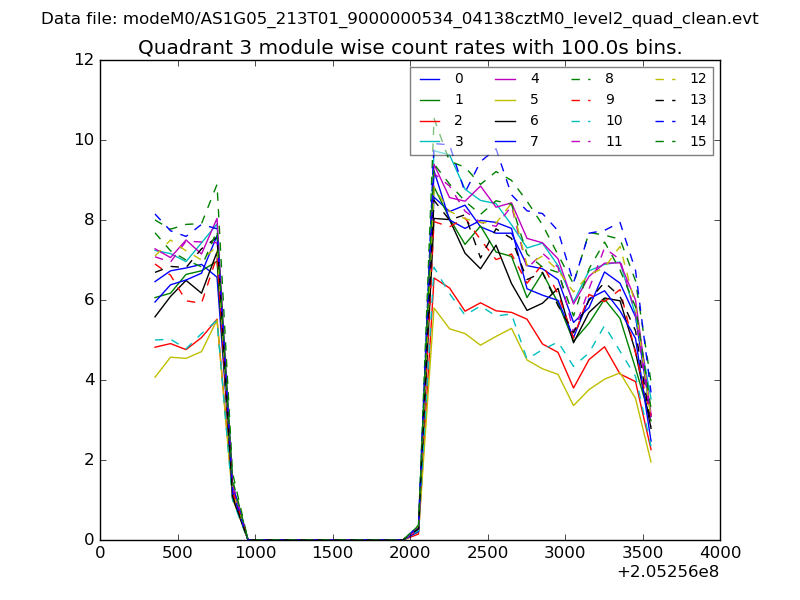
| Quadrant-wise count rates Data is divided into 100 sec bins |
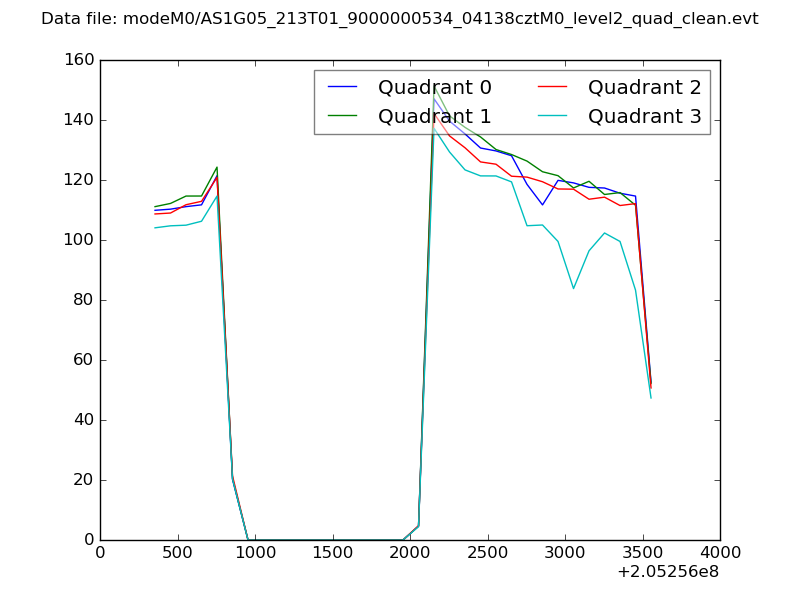 |
|
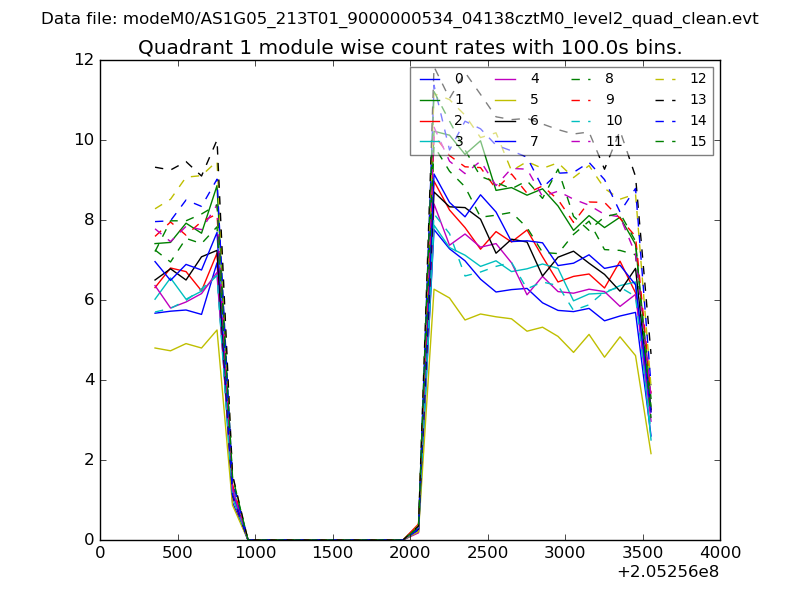
| Module-wise count rates for Quadrant A Data is divided into 100 sec bins |
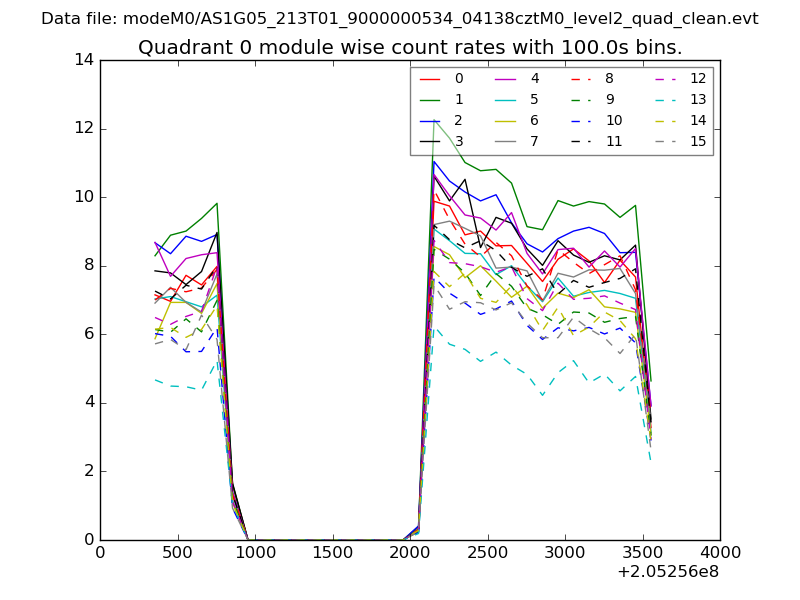 |
 |
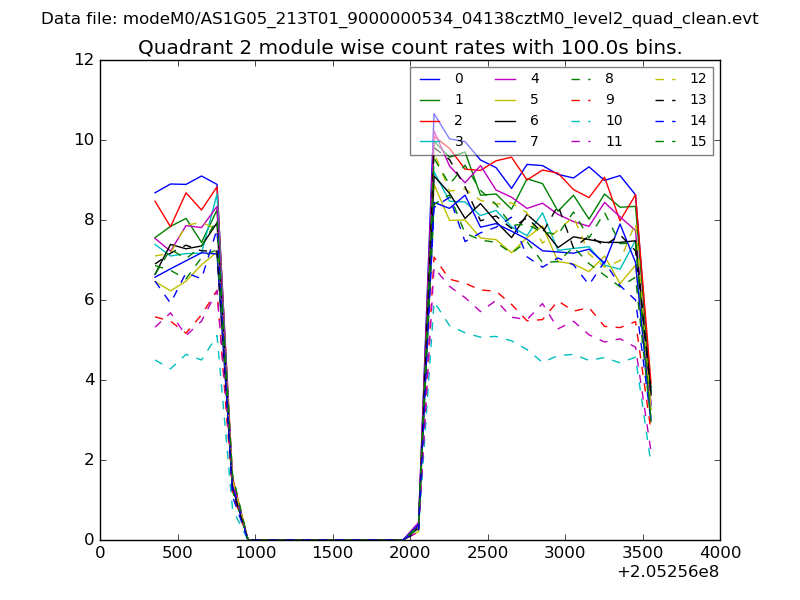
| Module-wise count rates for Quadrant B Data is divided into 100 sec bins |
 |
 |
| Module-wise count rates for Quadrant C Data is divided into 100 sec bins |
 |
 |
| Module-wise count rates for Quadrant D Data is divided into 100 sec bins |
 |
 |
| Parameter | Plot |
|---|---|
| CZT HV Monitor | 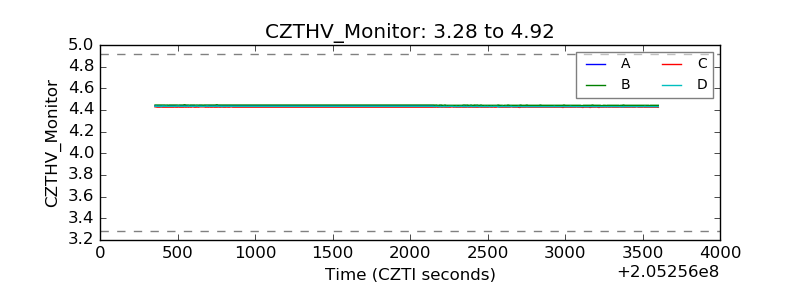 |
| D_VDD | 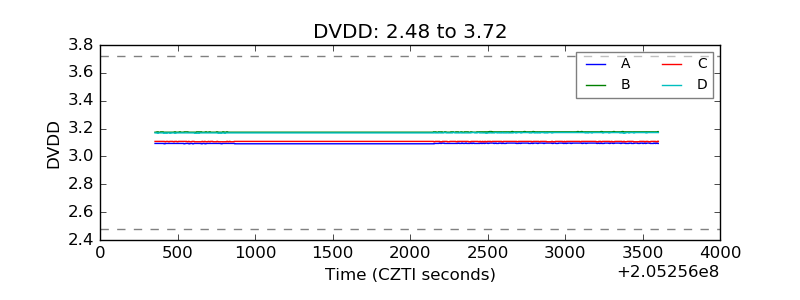 |
| Temperature 1 | 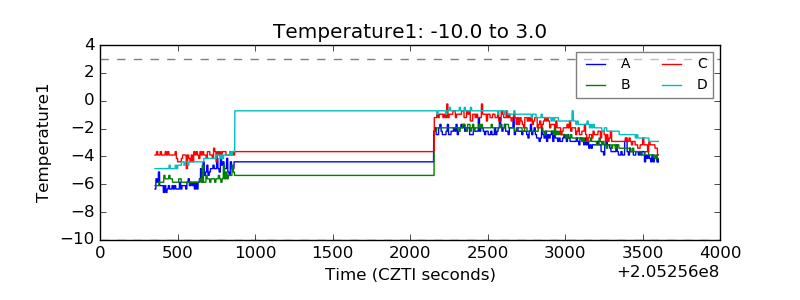 |
| Veto HV Monitor | 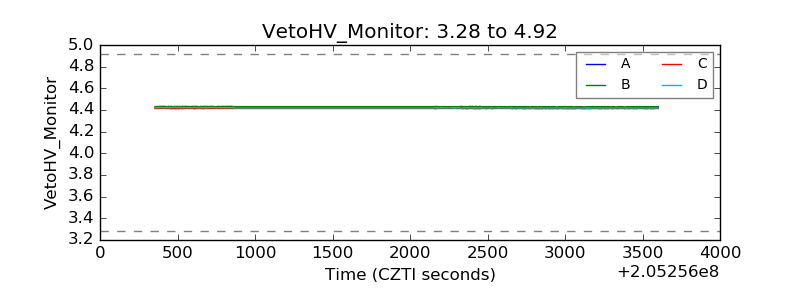 |
| Veto LLD | 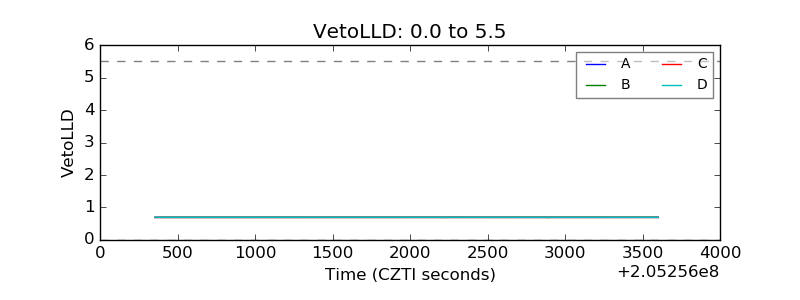 |
| Alpha Counter | 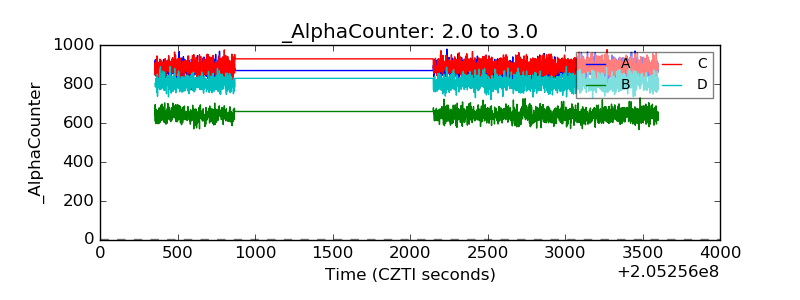 |
| _CPM_Rate | 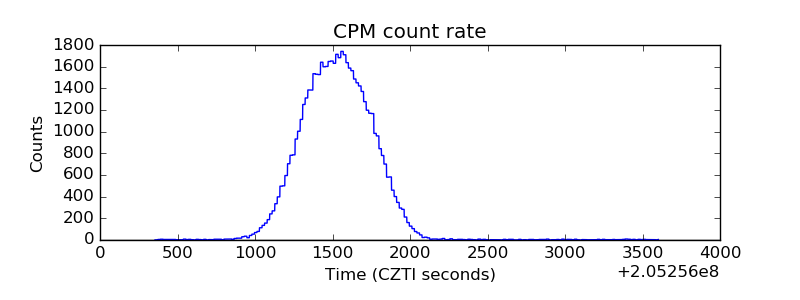 |
| CZT Counter | 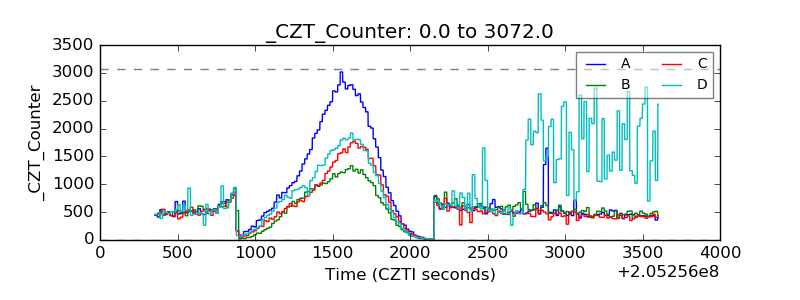 |
| +2.5 Volts monitor |  |
| +5 Volts monitor |  |
| _ROLL_ROT | 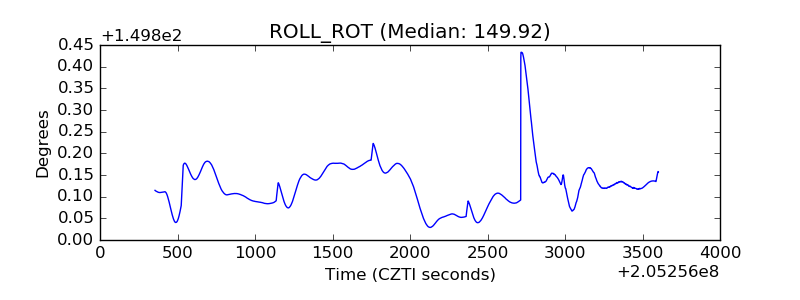 |
| _Roll_DEC | 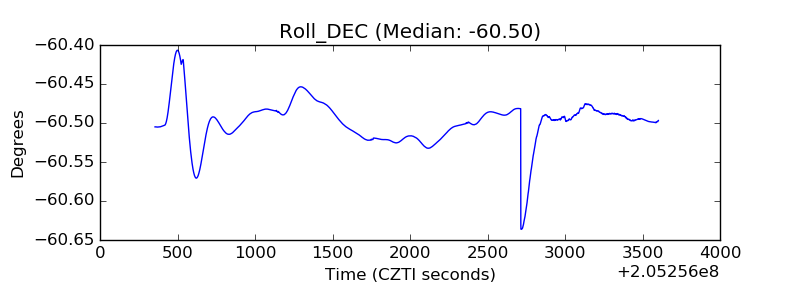 |
| _Roll_RA | 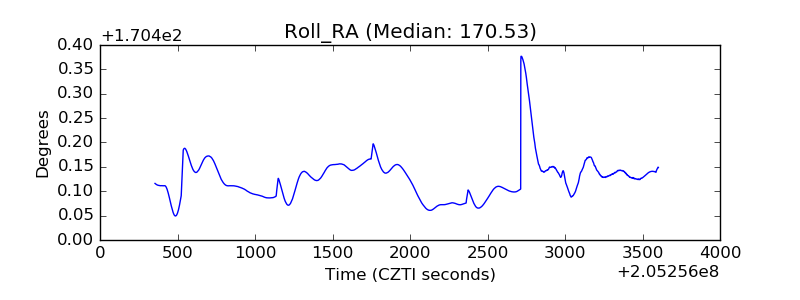 |
| Veto Counter | 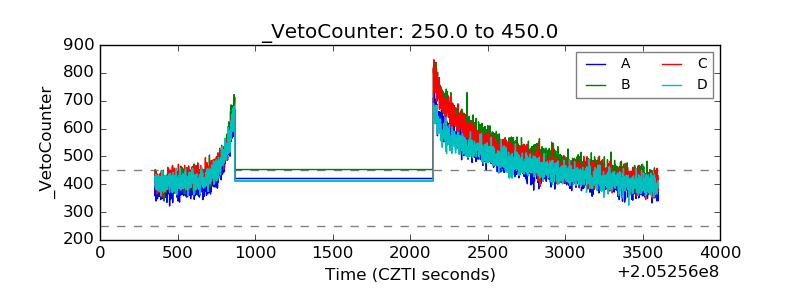 |