| Param | Original file | Final file |
|---|---|---|
| Filename | modeM0/AS1G05_213T01_9000000534_04139cztM0_level2.evt | modeM0/AS1G05_213T01_9000000534_04139cztM0_level2_quad_clean.evt |
| Size (bytes) | 424,592,640 | 76,783,680 |
| Size | 404.9 MB | 73.2 MB |
| Events in quadrant A | 2,828,742 | 489,246 |
| Events in quadrant B | 2,907,033 | 493,248 |
| Events in quadrant C | 2,614,114 | 481,047 |
| Events in quadrant D | 4,109,595 | 451,177 |
| Mode M9 | |||
|---|---|---|---|
| Quadrant | BADHDUFLAG | Total packets | Discarded packets |
| A | 0 | 13 | 0 |
| B | 0 | 13 | 0 |
| C | 0 | 13 | 0 |
| D | 0 | 13 | 0 |
| Mode M0 | |||
|---|---|---|---|
| Quadrant | BADHDUFLAG | Total packets | Discarded packets |
| A | 0 | 12313 | 2 |
| B | 0 | 12444 | 1 |
| C | 0 | 11945 | 1 |
| D | 0 | 16530 | 1 |
| Mode SS | |||
|---|---|---|---|
| Quadrant | BADHDUFLAG | Total packets | Discarded packets |
| A | 0 | 120 | 0 |
| B | 0 | 120 | 0 |
| C | 0 | 120 | 0 |
| D | 0 | 120 | 0 |
| Quadrant | Total seconds | Saturated seconds | Saturation percentage |
|---|---|---|---|
| A | 5869 | 48 | 0.817857% |
| B | 5869 | 15 | 0.255580% |
| C | 5869 | 10 | 0.170387% |
| D | 5869 | 322 | 5.486454% |
Noise dominated data is calculated using 1-second bins in cleaned event files. If a bin has >2000 counts, and if more than 50% of those come from <1% of pixels, then it is considered to be noise-dominated and hence unusable.
| Quadrant | # 1 sec bins | Bins with >0 counts | Bins with >2000 counts | High rate bins dominated by noise | Noise dominated (total time) | Noise dominated (detector-on time) | Marked lightcurve |
|---|---|---|---|---|---|---|---|
| A | 7199 | 5869 | 17 | 17 | 0.24% | 0.29% | 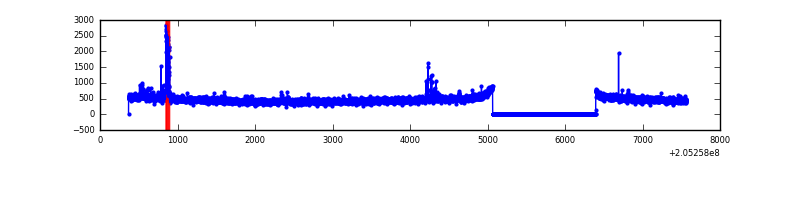 |
| B | 7199 | 5869 | 1 | 1 | 0.01% | 0.02% | 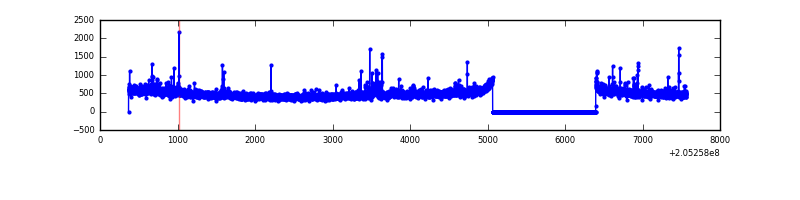 |
| C | 7199 | 5869 | 1 | 1 | 0.01% | 0.02% | 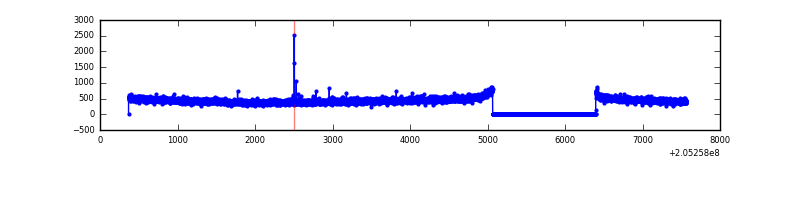 |
| D | 7199 | 5870 | 379 | 379 | 5.26% | 6.46% | 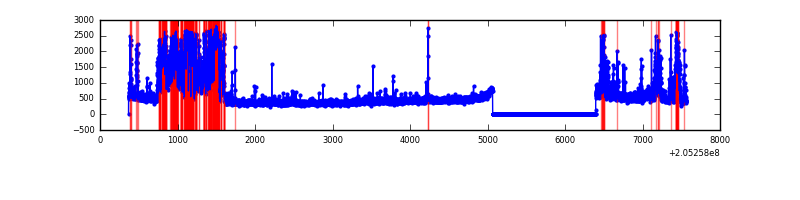 |
Top three noisy pixels from each quadrant. If the there are fewer than three noisy pixels in the level2.evt file, extra rows are filled as -1
| Pixel properties | Quadrant properties | ||||||
|---|---|---|---|---|---|---|---|
| Quadrant | DetID | PixID | Counts | Sigma | Mean | Median | Sigma |
| A | 0 | 118 | 76767 | 537.55 | 696 | 683 | 141.5 |
| A | 15 | 234 | 29210 | 201.55 | 696 | 683 | 141.5 |
| A | 13 | 14 | 28012 | 193.09 | 696 | 683 | 141.5 |
| B | 10 | 16 | 58583 | 435.39 | 703 | 690 | 133.0 |
| B | 14 | 167 | 29475 | 216.48 | 703 | 690 | 133.0 |
| B | 0 | 183 | 27897 | 204.61 | 703 | 690 | 133.0 |
| C | 10 | 65 | 18708 | 118.18 | 663 | 666 | 152.7 |
| C | 1 | 16 | 6137 | 35.84 | 663 | 666 | 152.7 |
| C | 13 | 61 | 5660 | 32.71 | 663 | 666 | 152.7 |
| D | 1 | 52 | 1386110 | 8665.45 | 654 | 633 | 159.9 |
| D | 2 | 232 | 114117 | 709.78 | 654 | 633 | 159.9 |
| D | 13 | 137 | 27290 | 166.73 | 654 | 633 | 159.9 |
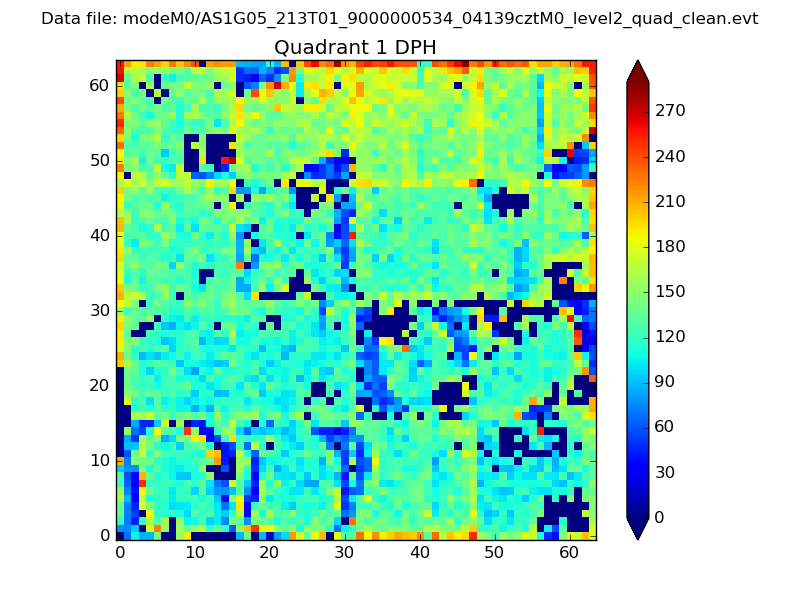
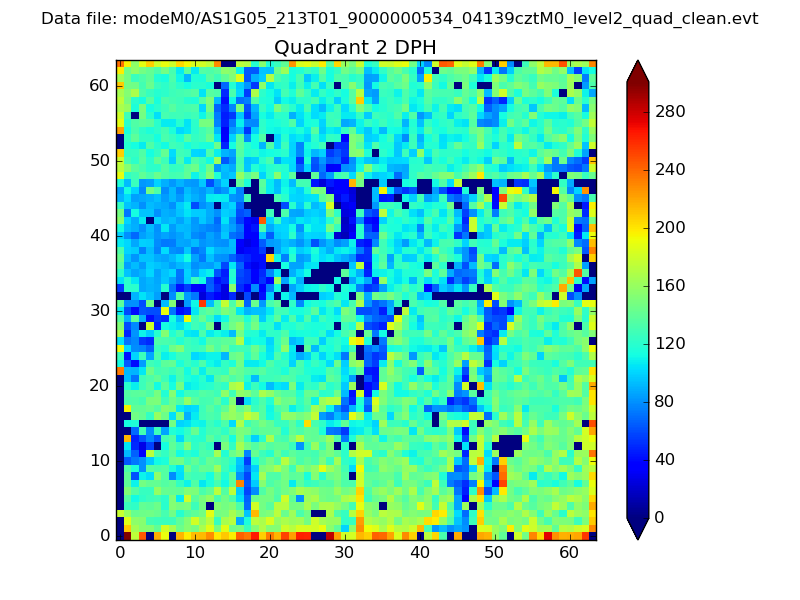
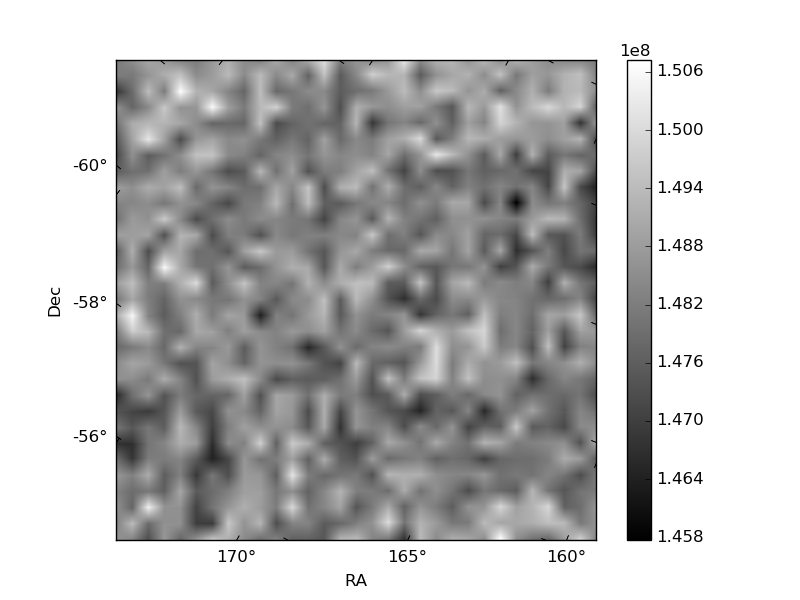
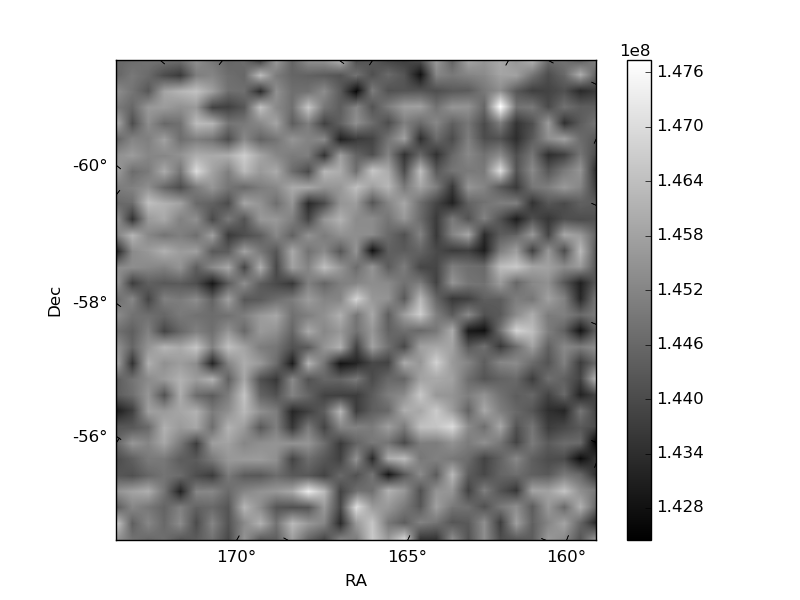
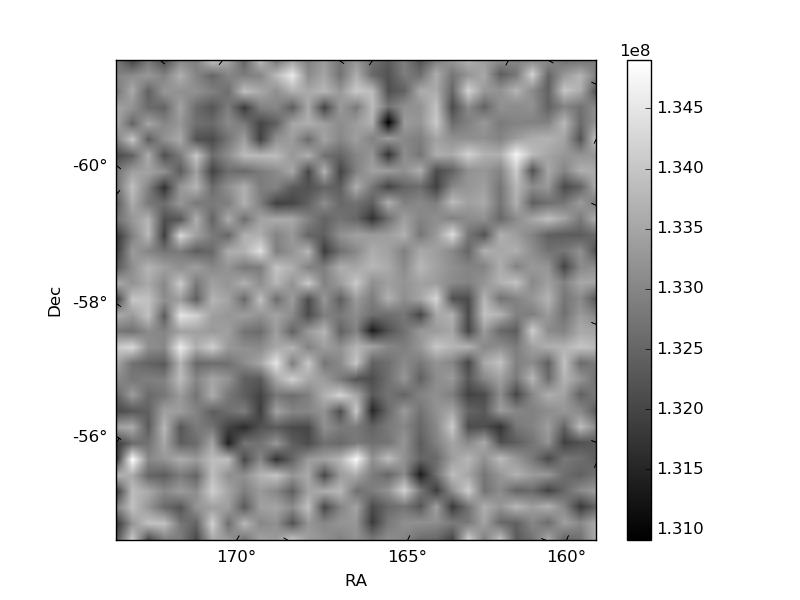
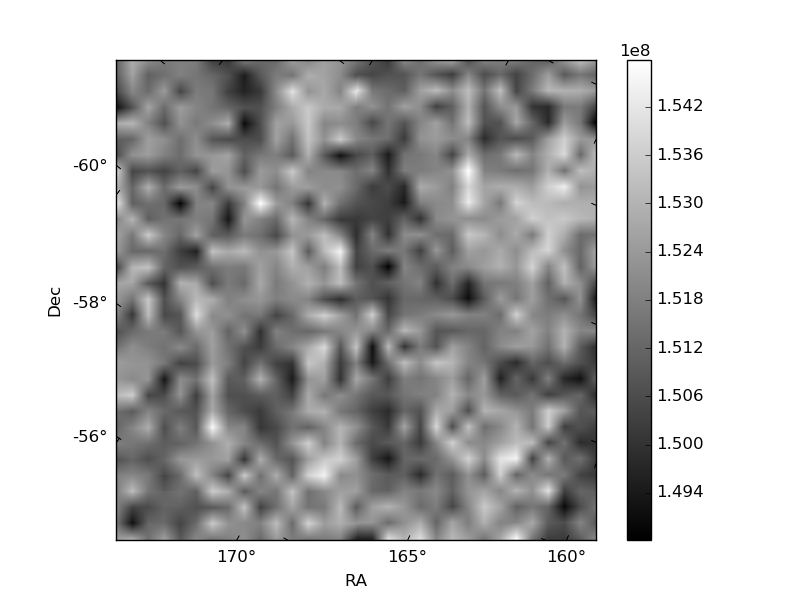
Histogram calculated using DETX and DETY for each event in the final _common_clean file
| Quadrant A |  |
 |
Quadrant B |
|---|---|---|---|
| Quadrant D | 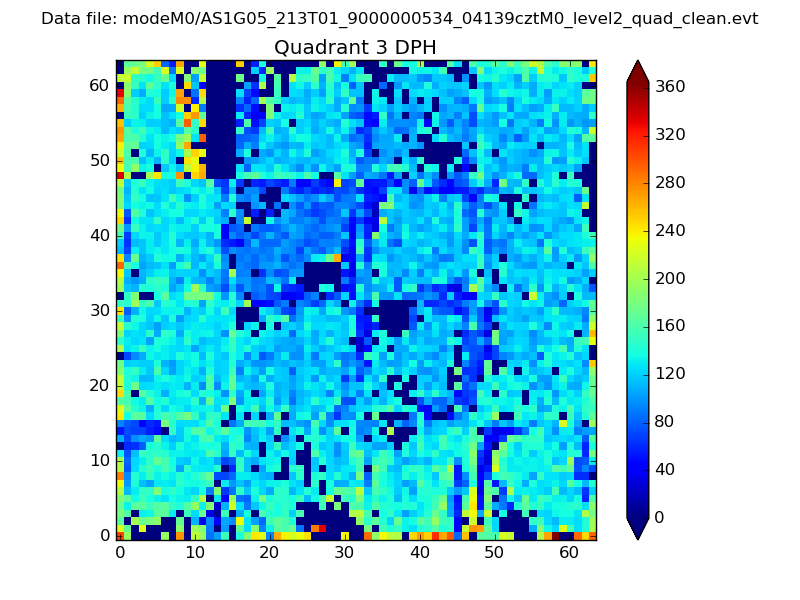 |
 |
Quadrant C |
| Plot type | Count rate plots | Images |
|---|---|---|
| Comparison with Poisson distribution Blue bars denote a histogram of data divided into 1 sec bins. Red curve is a Poisson curve with rate = median count rate of data. |
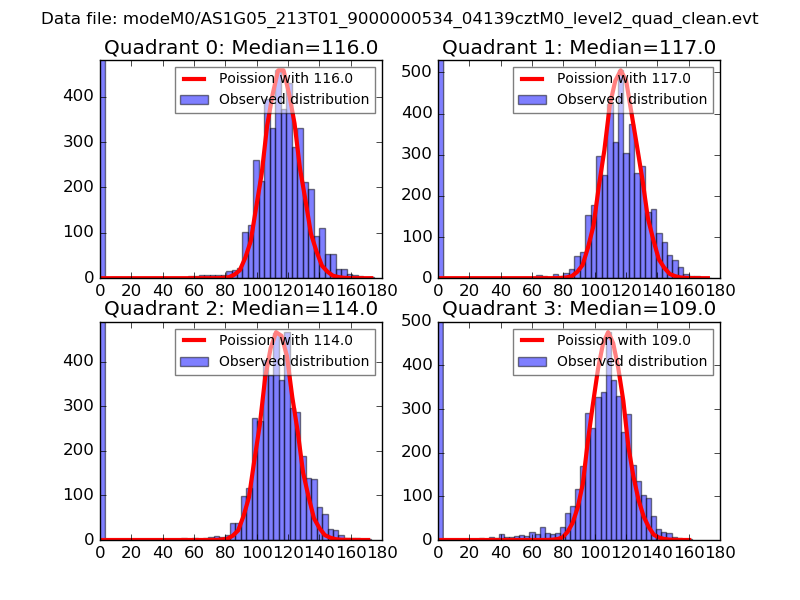 |
 |
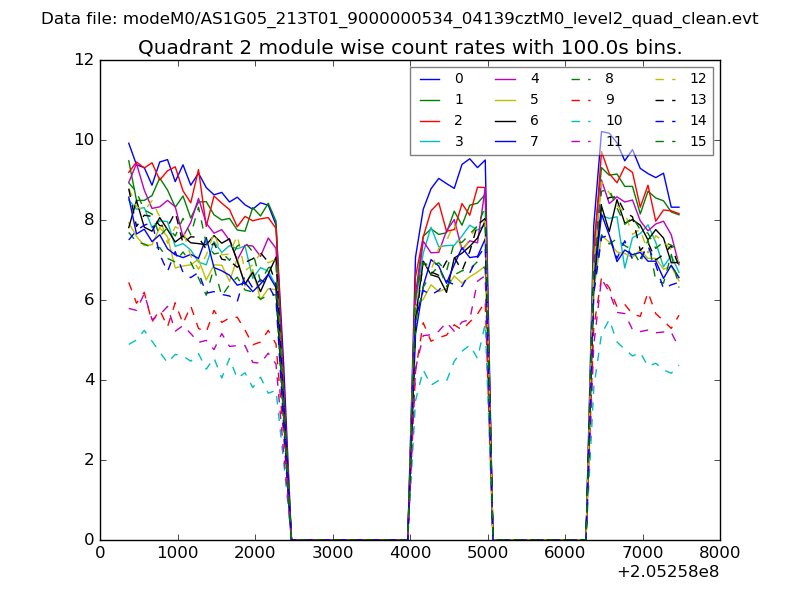
| Quadrant-wise count rates Data is divided into 100 sec bins |
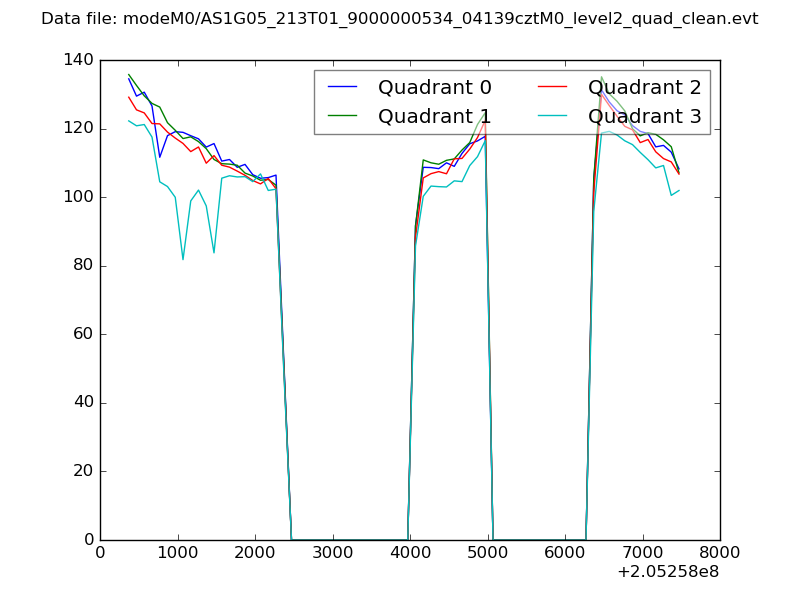 |
|
| Module-wise count rates for Quadrant A Data is divided into 100 sec bins |
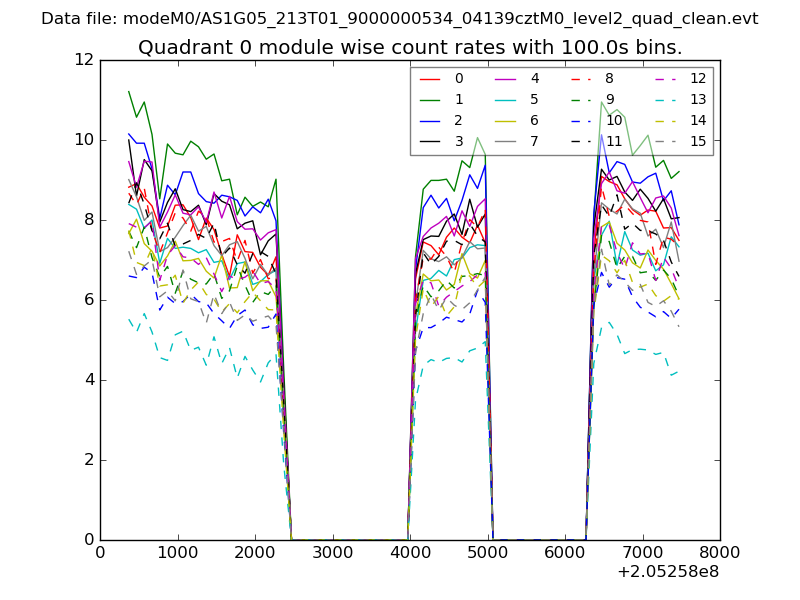 |
 |
| Module-wise count rates for Quadrant B Data is divided into 100 sec bins |
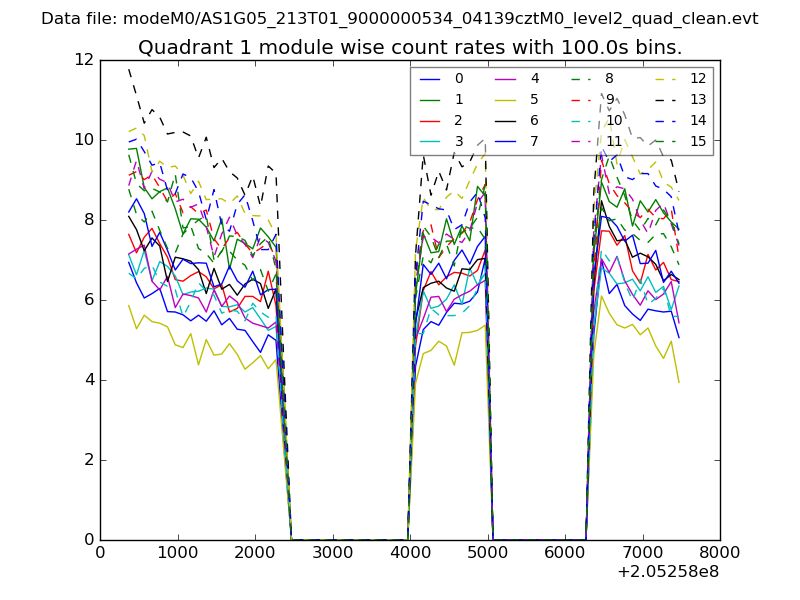 |
 |
| Module-wise count rates for Quadrant C Data is divided into 100 sec bins |
 |
 |
| Module-wise count rates for Quadrant D Data is divided into 100 sec bins |
 |
 |
| Parameter | Plot |
|---|---|
| CZT HV Monitor | 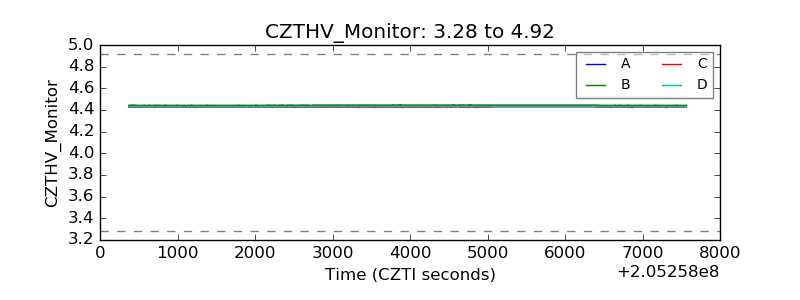 |
| D_VDD | 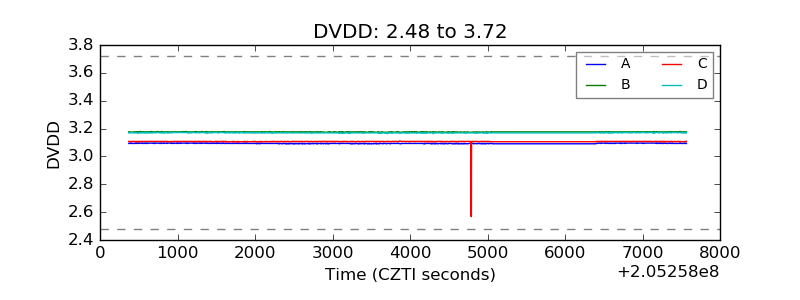 |
| Temperature 1 | 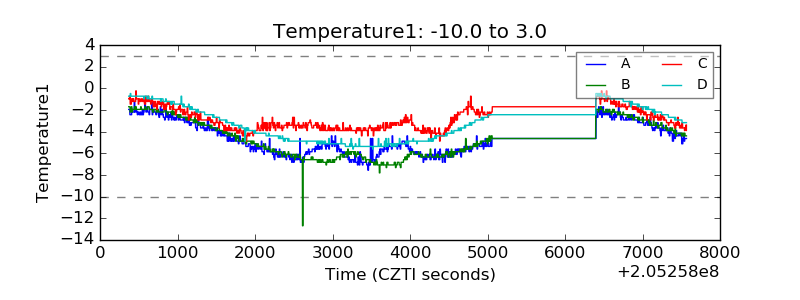 |
| Veto HV Monitor | 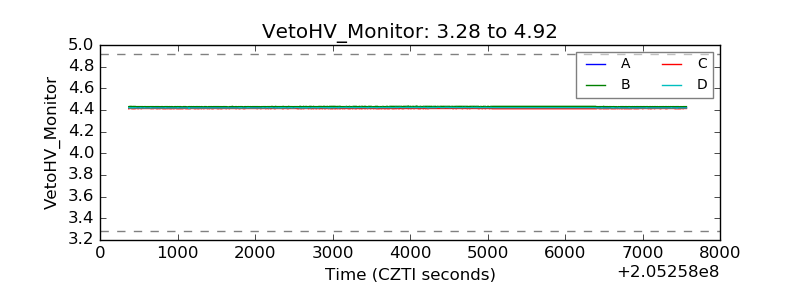 |
| Veto LLD | 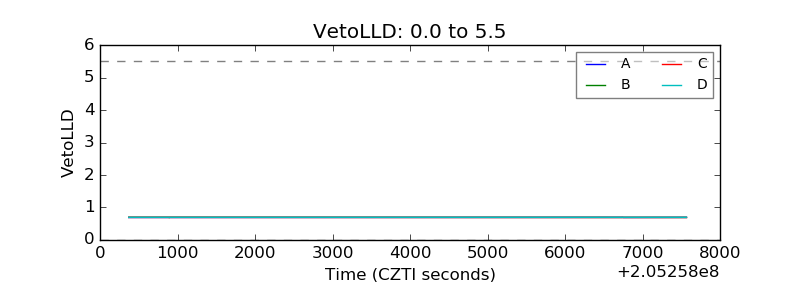 |
| Alpha Counter | 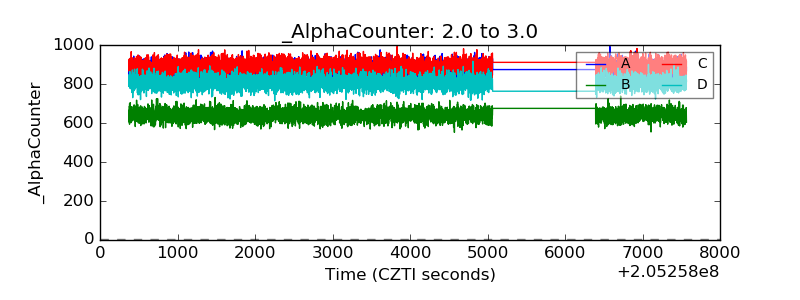 |
| _CPM_Rate | 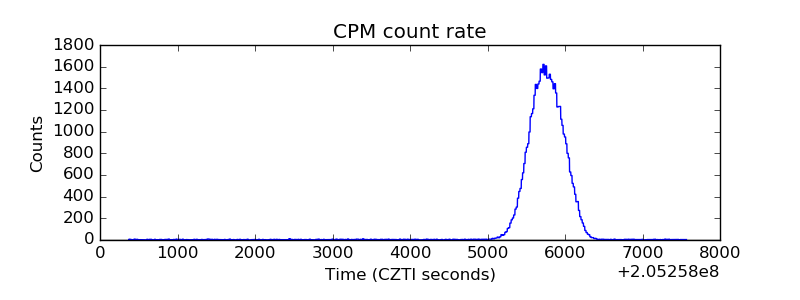 |
| CZT Counter | 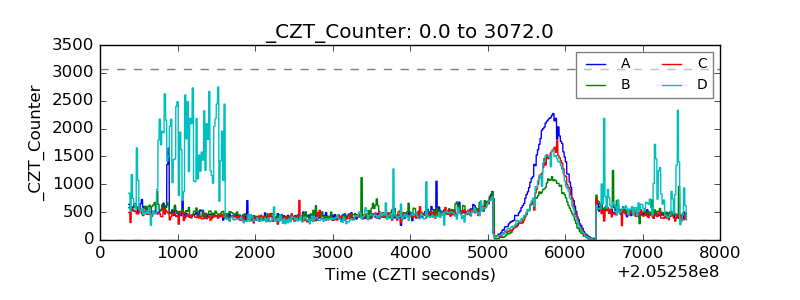 |
| +2.5 Volts monitor |  |
| +5 Volts monitor |  |
| _ROLL_ROT | 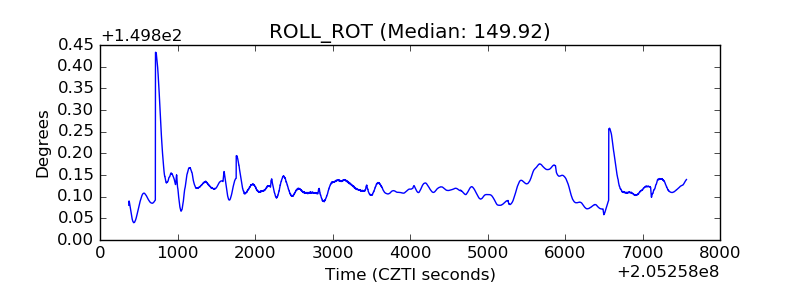 |
| _Roll_DEC | 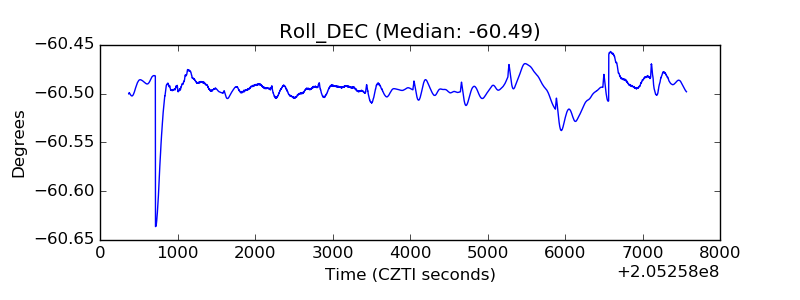 |
| _Roll_RA |  |
| Veto Counter | 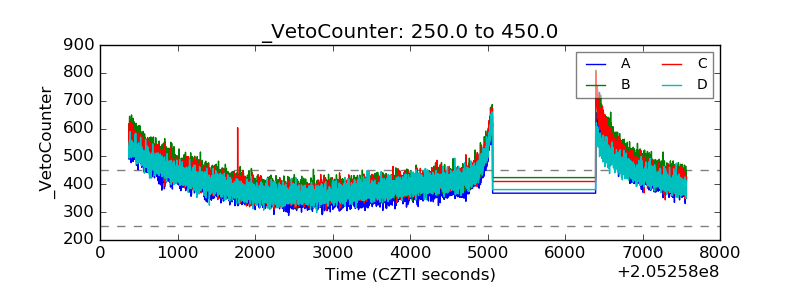 |