| Param | Original file | Final file |
|---|---|---|
| Filename | modeM0/AS1G05_213T01_9000000534_04140cztM0_level2.evt | modeM0/AS1G05_213T01_9000000534_04140cztM0_level2_quad_clean.evt |
| Size (bytes) | 104,414,400 | 25,335,360 |
| Size | 99.6 MB | 24.2 MB |
| Events in quadrant A | 681,846 | 168,169 |
| Events in quadrant B | 726,211 | 170,069 |
| Events in quadrant C | 636,899 | 165,244 |
| Events in quadrant D | 1,018,521 | 158,250 |
| Mode M9 | |||
|---|---|---|---|
| Quadrant | BADHDUFLAG | Total packets | Discarded packets |
| A | 0 | 4 | 0 |
| B | 0 | 4 | 0 |
| C | 0 | 4 | 0 |
| D | 0 | 5 | 0 |
| Mode M0 | |||
|---|---|---|---|
| Quadrant | BADHDUFLAG | Total packets | Discarded packets |
| A | 0 | 2905 | 1 |
| B | 0 | 2998 | 1 |
| C | 0 | 2859 | 1 |
| D | 0 | 4008 | 1 |
| Mode SS | |||
|---|---|---|---|
| Quadrant | BADHDUFLAG | Total packets | Discarded packets |
| A | 0 | 30 | 0 |
| B | 0 | 30 | 0 |
| C | 0 | 30 | 0 |
| D | 0 | 30 | 0 |
| Quadrant | Total seconds | Saturated seconds | Saturation percentage |
|---|---|---|---|
| A | 1404 | 4 | 0.284900% |
| B | 1404 | 2 | 0.142450% |
| C | 1404 | 2 | 0.142450% |
| D | 1404 | 39 | 2.777778% |
Noise dominated data is calculated using 1-second bins in cleaned event files. If a bin has >2000 counts, and if more than 50% of those come from <1% of pixels, then it is considered to be noise-dominated and hence unusable.
| Quadrant | # 1 sec bins | Bins with >0 counts | Bins with >2000 counts | High rate bins dominated by noise | Noise dominated (total time) | Noise dominated (detector-on time) | Marked lightcurve |
|---|---|---|---|---|---|---|---|
| A | 1403 | 1403 | 0 | 0 | 0.00% | 0.00% | 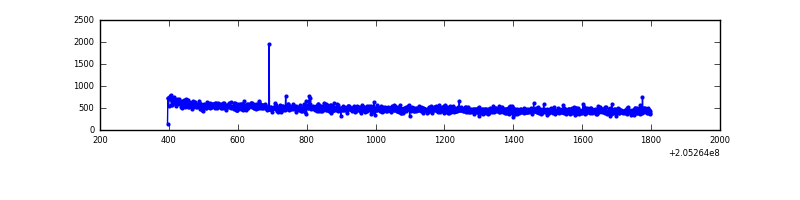 |
| B | 1403 | 1403 | 0 | 0 | 0.00% | 0.00% | 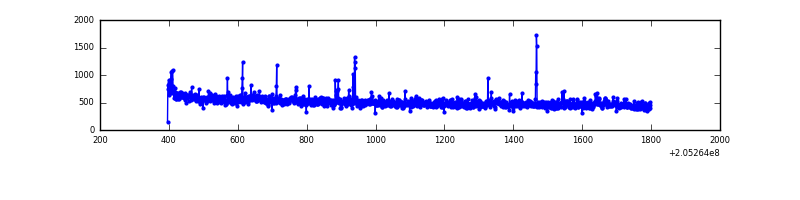 |
| C | 1403 | 1403 | 0 | 0 | 0.00% | 0.00% | 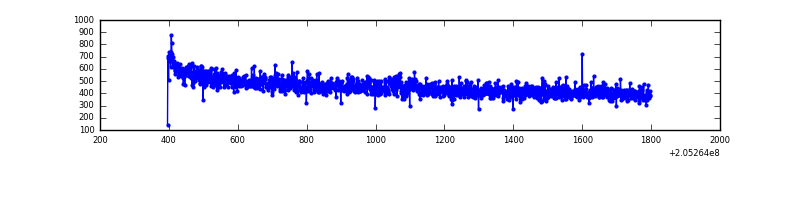 |
| D | 1404 | 1404 | 38 | 38 | 2.71% | 2.71% | 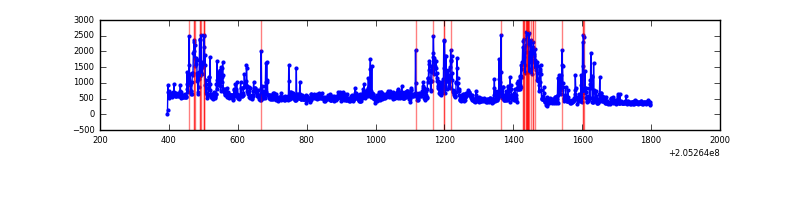 |
Top three noisy pixels from each quadrant. If the there are fewer than three noisy pixels in the level2.evt file, extra rows are filled as -1
| Pixel properties | Quadrant properties | ||||||
|---|---|---|---|---|---|---|---|
| Quadrant | DetID | PixID | Counts | Sigma | Mean | Median | Sigma |
| A | 15 | 234 | 4360 | 113.42 | 173 | 170 | 36.9 |
| A | 13 | 14 | 3955 | 102.46 | 173 | 170 | 36.9 |
| A | 14 | 111 | 2132 | 53.11 | 173 | 170 | 36.9 |
| B | 10 | 16 | 18114 | 508.39 | 174 | 170 | 35.3 |
| B | 0 | 183 | 12748 | 356.36 | 174 | 170 | 35.3 |
| B | 4 | 81 | 6662 | 183.93 | 174 | 170 | 35.3 |
| C | 1 | 16 | 5319 | 134.22 | 160 | 161 | 38.4 |
| C | 10 | 65 | 2488 | 60.55 | 160 | 161 | 38.4 |
| C | 13 | 61 | 1354 | 31.04 | 160 | 161 | 38.4 |
| D | 1 | 52 | 267085 | 6507.44 | 161 | 156 | 41.0 |
| D | 2 | 232 | 98517 | 2397.93 | 161 | 156 | 41.0 |
| D | 13 | 137 | 15945 | 384.92 | 161 | 156 | 41.0 |
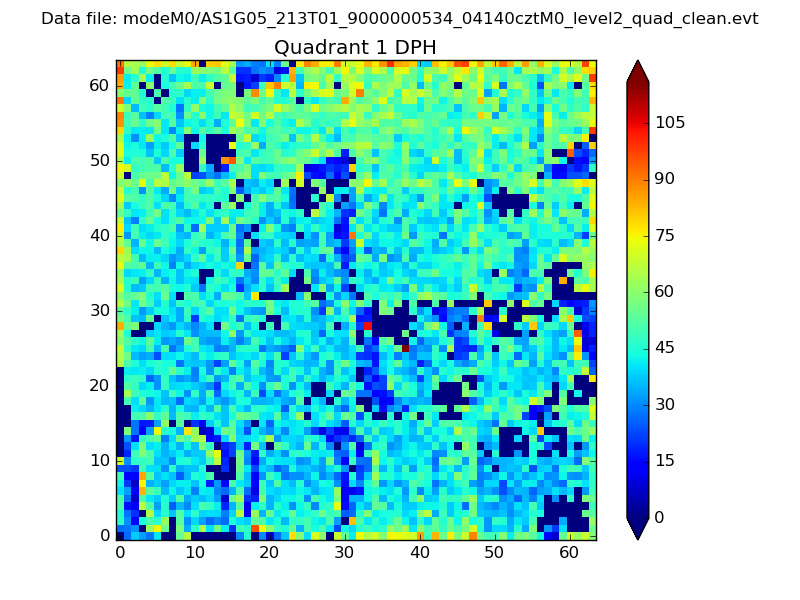
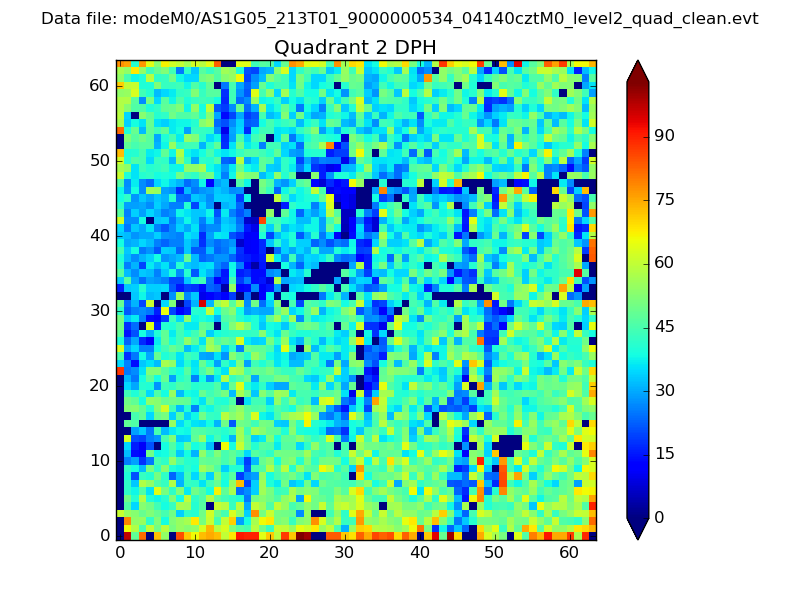
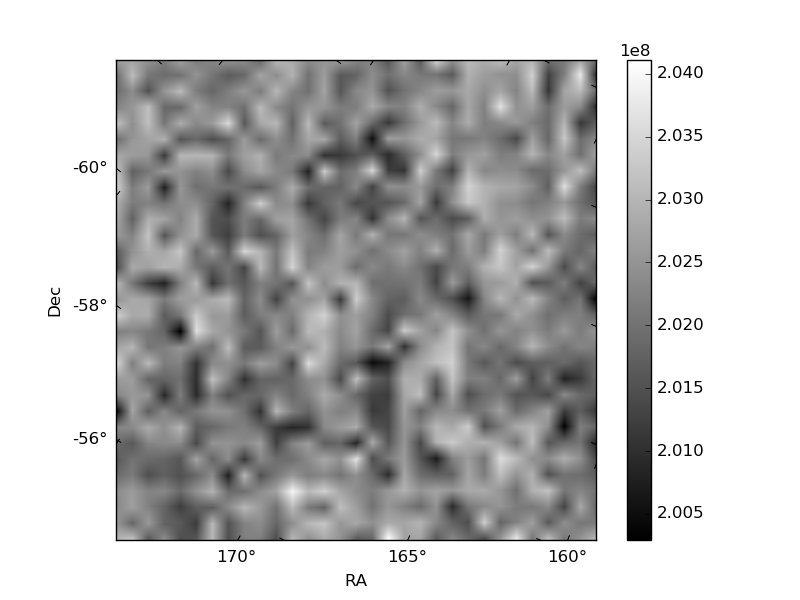
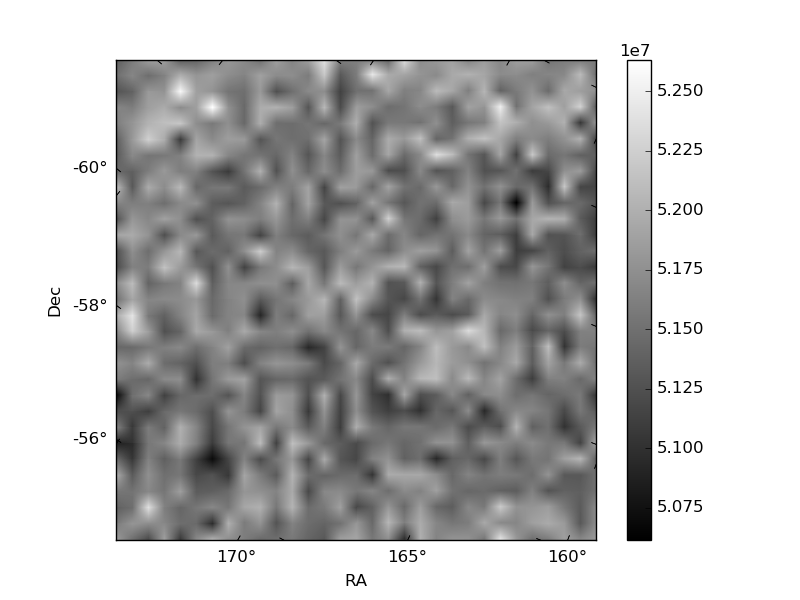
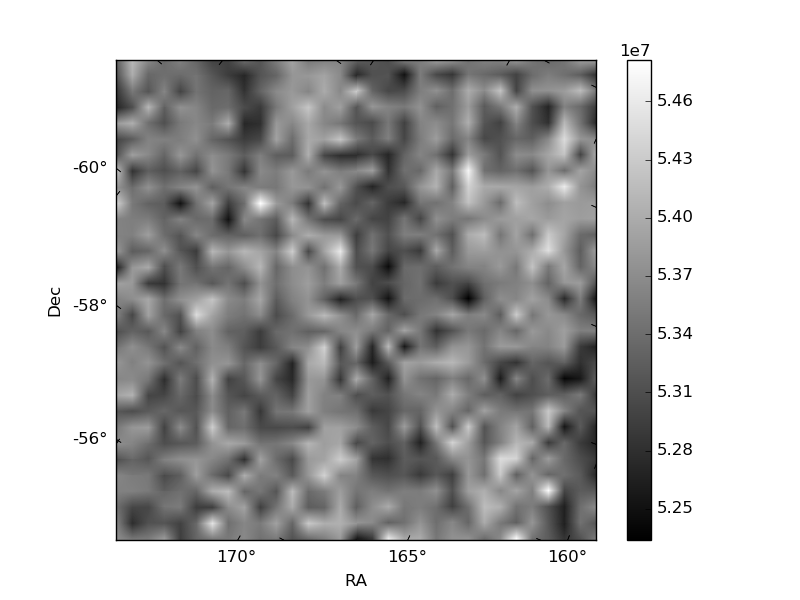
Histogram calculated using DETX and DETY for each event in the final _common_clean file
| Quadrant A |  |
 |
Quadrant B |
|---|---|---|---|
| Quadrant D | 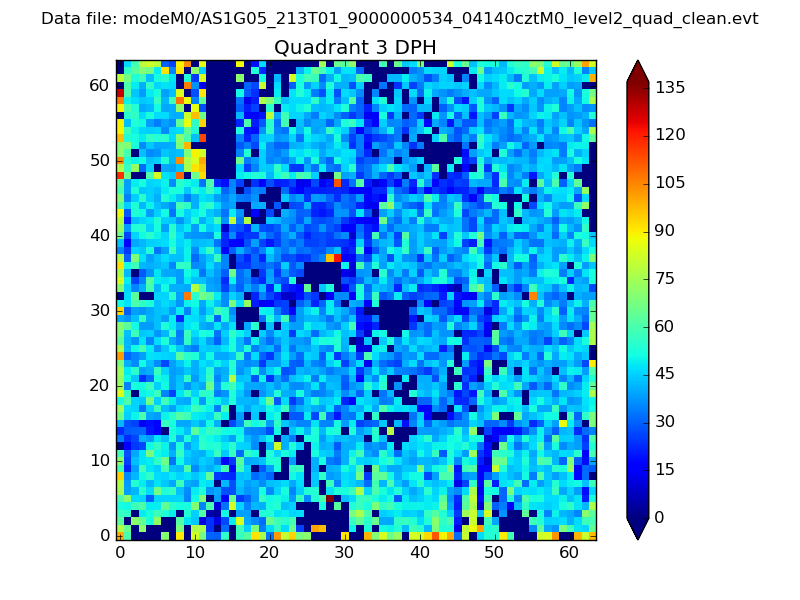 |
 |
Quadrant C |
| Plot type | Count rate plots | Images |
|---|---|---|
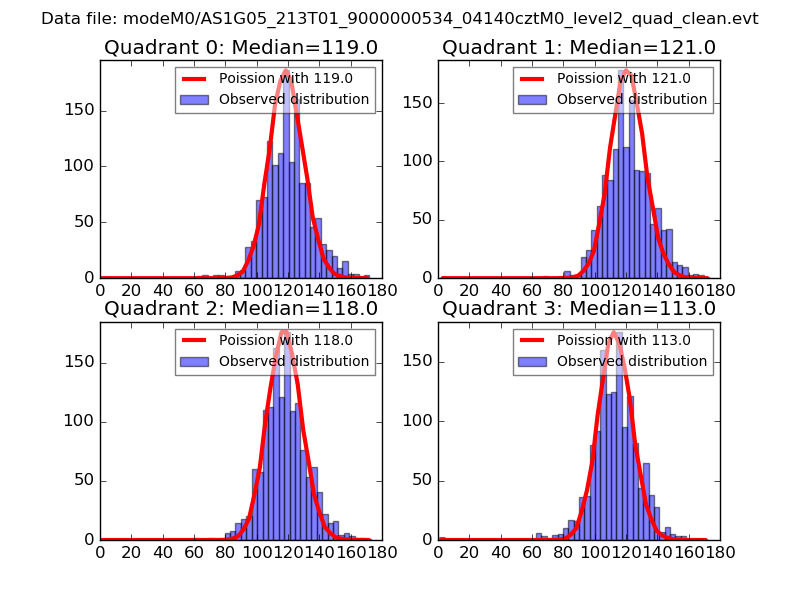
| Comparison with Poisson distribution Blue bars denote a histogram of data divided into 1 sec bins. Red curve is a Poisson curve with rate = median count rate of data. |
 |
 |
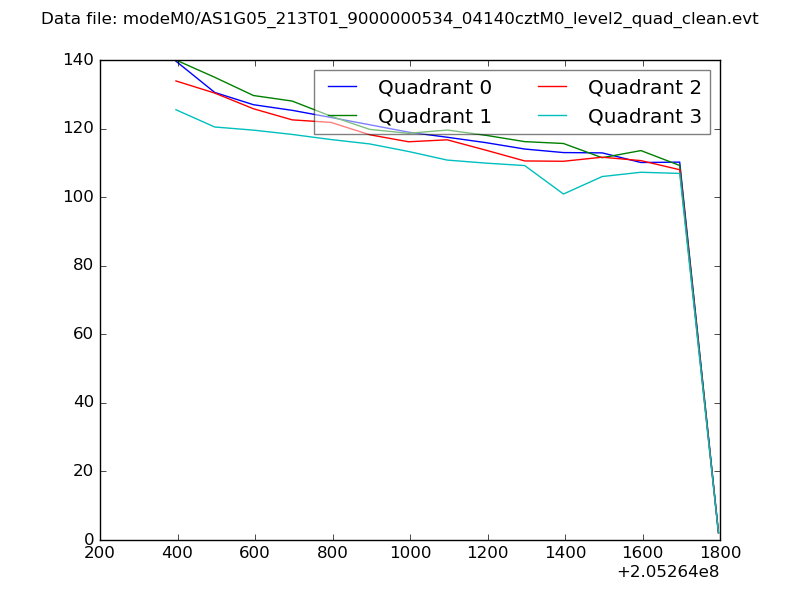
| Quadrant-wise count rates Data is divided into 100 sec bins |
 |
|
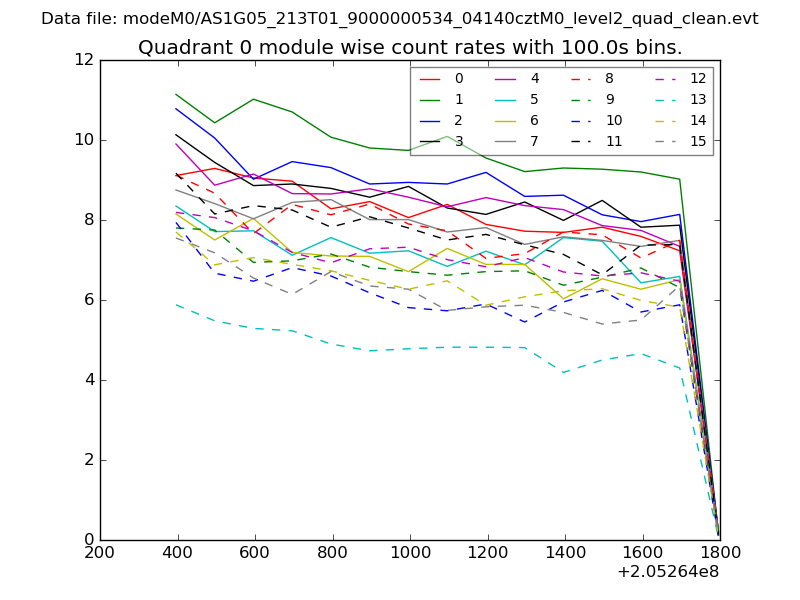
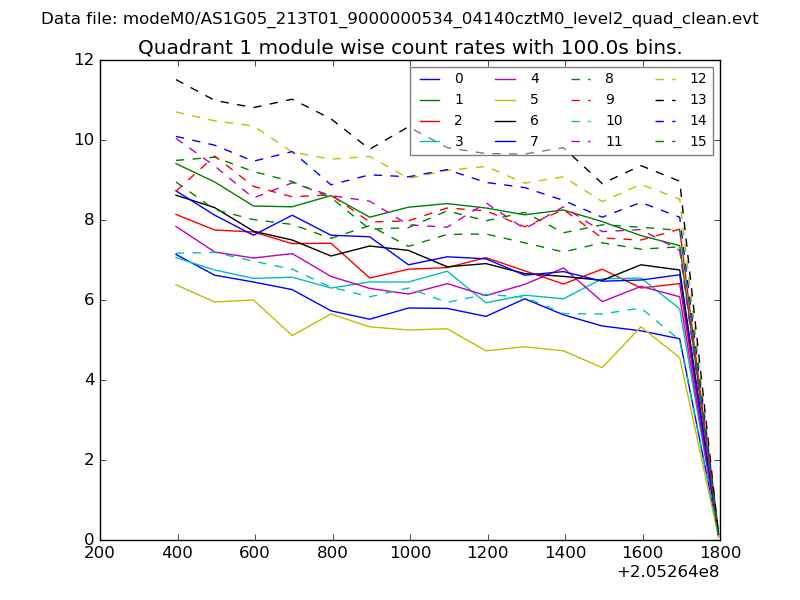
| Module-wise count rates for Quadrant A Data is divided into 100 sec bins |
 |
 |
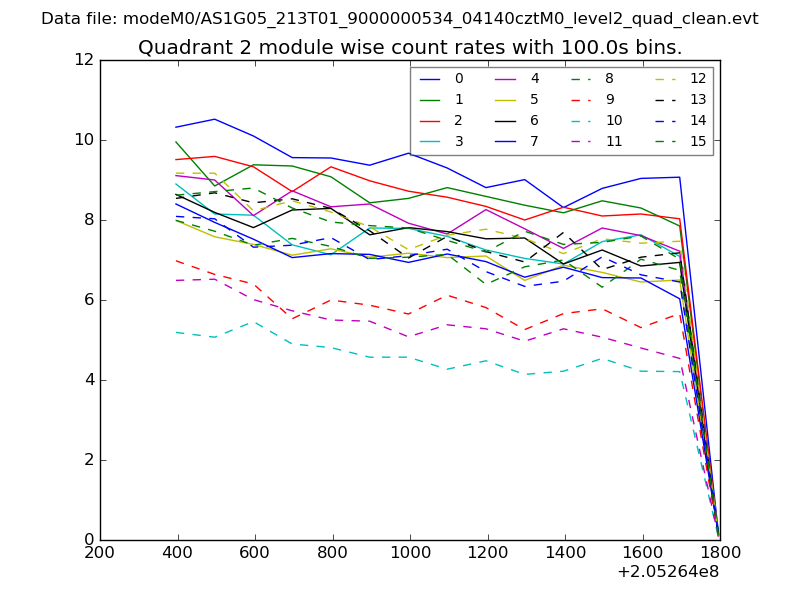
| Module-wise count rates for Quadrant B Data is divided into 100 sec bins |
 |
 |
| Module-wise count rates for Quadrant C Data is divided into 100 sec bins |
 |
 |
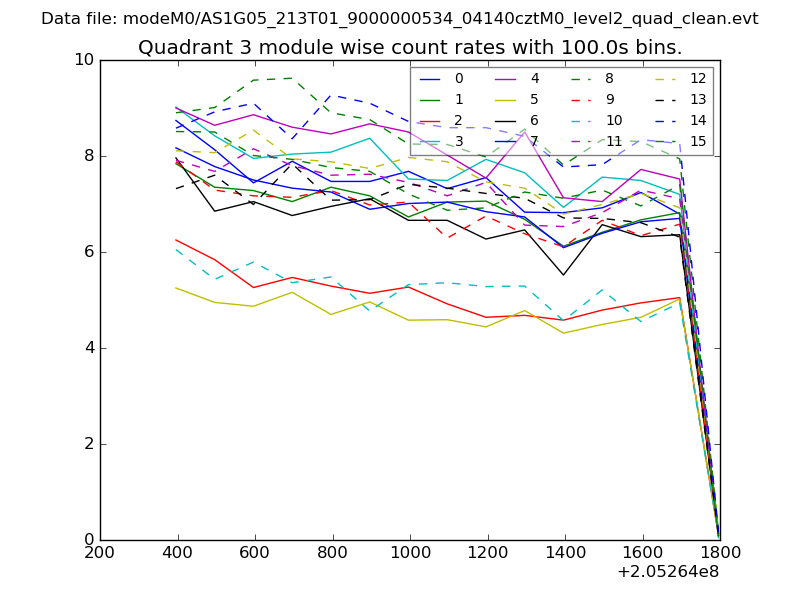
| Module-wise count rates for Quadrant D Data is divided into 100 sec bins |
 |
 |
| Parameter | Plot |
|---|---|
| CZT HV Monitor | 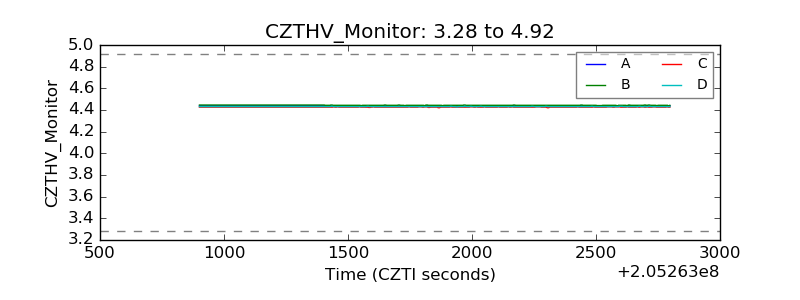 |
| D_VDD | 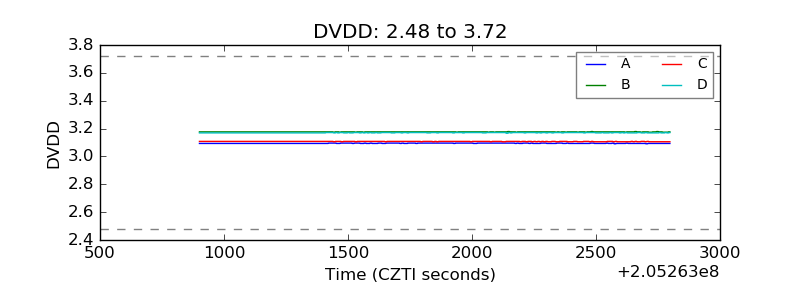 |
| Temperature 1 | 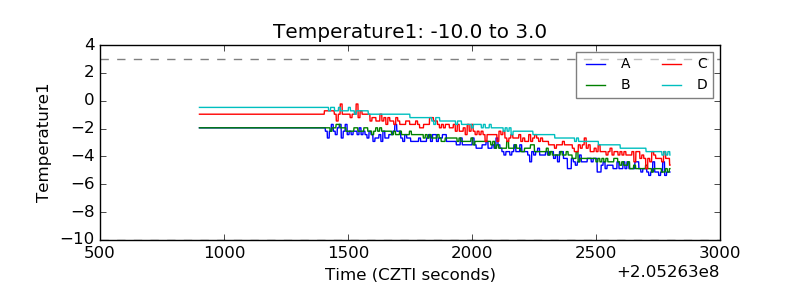 |
| Veto HV Monitor | 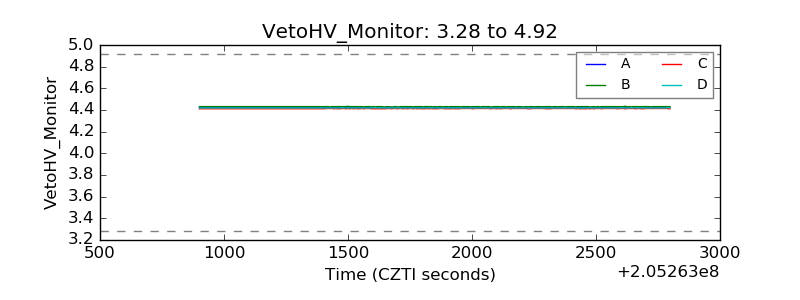 |
| Veto LLD |  |
| Alpha Counter | 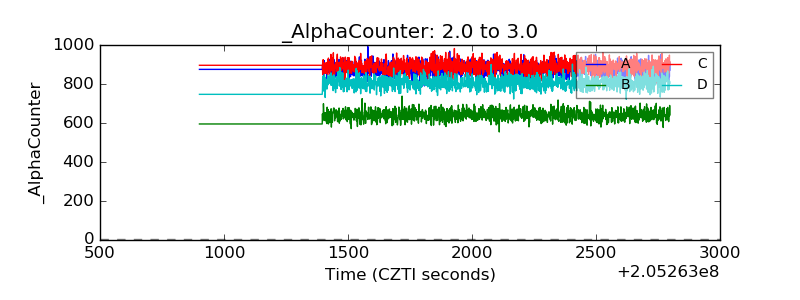 |
| _CPM_Rate | 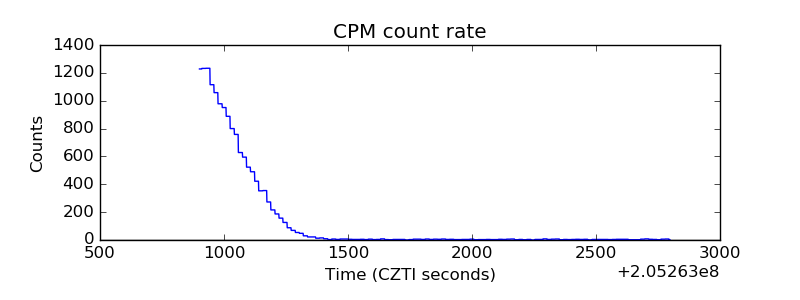 |
| CZT Counter | 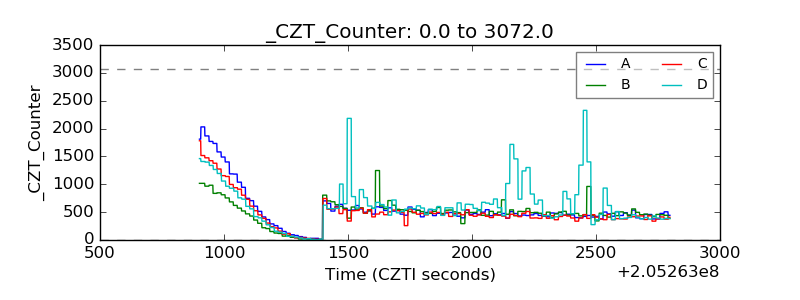 |
| +2.5 Volts monitor |  |
| +5 Volts monitor |  |
| _ROLL_ROT | 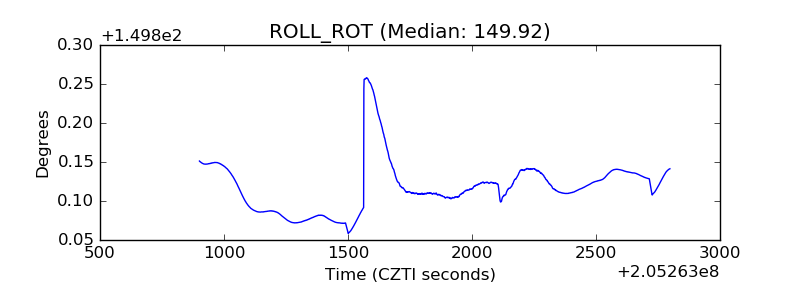 |
| _Roll_DEC | 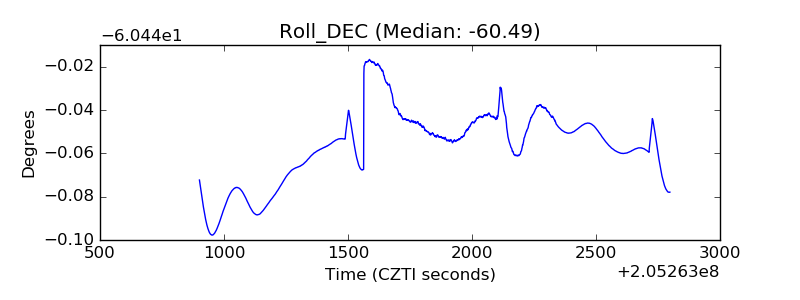 |
| _Roll_RA | 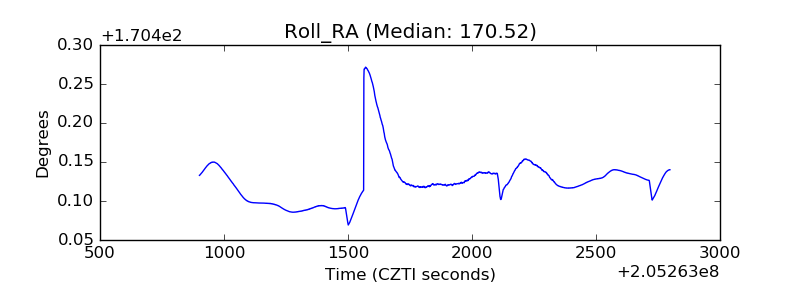 |
| Veto Counter | 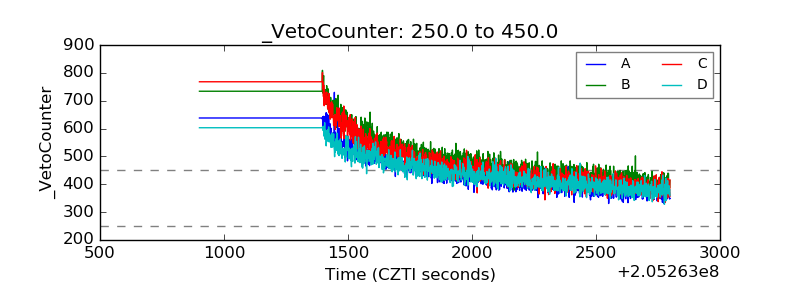 |