| Param | Original file | Final file |
|---|---|---|
| Filename | modeM0/AS1G05_240T01_9000000536_04140cztM0_level2.evt | modeM0/AS1G05_240T01_9000000536_04140cztM0_level2_quad_clean.evt |
| Size (bytes) | 258,125,760 | 46,679,040 |
| Size | 246.2 MB | 44.5 MB |
| Events in quadrant A | 1,880,360 | 288,875 |
| Events in quadrant B | 1,948,228 | 290,606 |
| Events in quadrant C | 1,838,615 | 282,784 |
| Events in quadrant D | 1,881,637 | 273,663 |
| Mode SS | |||
|---|---|---|---|
| Quadrant | BADHDUFLAG | Total packets | Discarded packets |
| A | 0 | 80 | 0 |
| B | 0 | 80 | 0 |
| C | 0 | 80 | 0 |
| D | 0 | 80 | 0 |
| Mode M9 | |||
|---|---|---|---|
| Quadrant | BADHDUFLAG | Total packets | Discarded packets |
| A | 0 | 13 | 0 |
| B | 0 | 13 | 0 |
| C | 0 | 13 | 0 |
| D | 0 | 13 | 0 |
| Mode M0 | |||
|---|---|---|---|
| Quadrant | BADHDUFLAG | Total packets | Discarded packets |
| A | 0 | 8156 | 2 |
| B | 0 | 8274 | 1 |
| C | 0 | 8100 | 1 |
| D | 0 | 8345 | 1 |
| Quadrant | Total seconds | Saturated seconds | Saturation percentage |
|---|---|---|---|
| A | 3928 | 63 | 1.603870% |
| B | 3928 | 64 | 1.629328% |
| C | 3928 | 29 | 0.738289% |
| D | 3928 | 26 | 0.661914% |
Noise dominated data is calculated using 1-second bins in cleaned event files. If a bin has >2000 counts, and if more than 50% of those come from <1% of pixels, then it is considered to be noise-dominated and hence unusable.
| Quadrant | # 1 sec bins | Bins with >0 counts | Bins with >2000 counts | High rate bins dominated by noise | Noise dominated (total time) | Noise dominated (detector-on time) | Marked lightcurve |
|---|---|---|---|---|---|---|---|
| A | 5223 | 3928 | 0 | 0 | 0.00% | 0.00% | 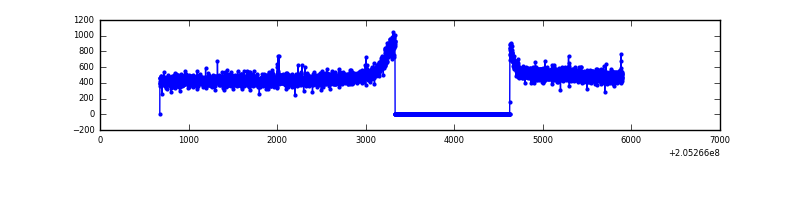 |
| B | 5223 | 3928 | 0 | 0 | 0.00% | 0.00% | 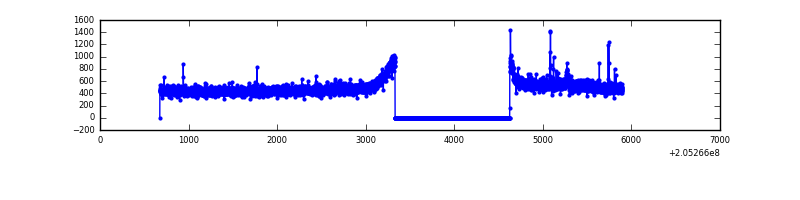 |
| C | 5223 | 3928 | 0 | 0 | 0.00% | 0.00% | 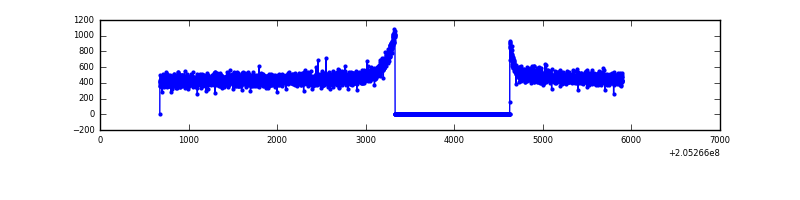 |
| D | 5223 | 3929 | 7 | 7 | 0.13% | 0.18% | 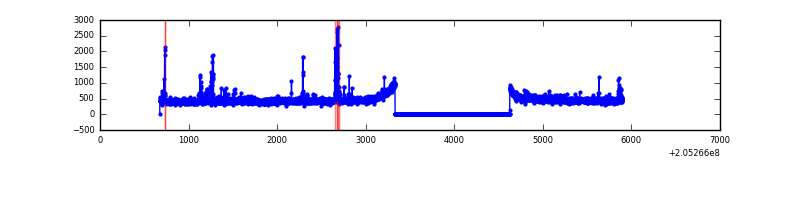 |
Top three noisy pixels from each quadrant. If the there are fewer than three noisy pixels in the level2.evt file, extra rows are filled as -1
| Pixel properties | Quadrant properties | ||||||
|---|---|---|---|---|---|---|---|
| Quadrant | DetID | PixID | Counts | Sigma | Mean | Median | Sigma |
| A | 13 | 14 | 17419 | 171.53 | 481 | 470 | 98.8 |
| A | 0 | 118 | 5734 | 53.27 | 481 | 470 | 98.8 |
| A | 0 | 226 | 5545 | 51.36 | 481 | 470 | 98.8 |
| B | 14 | 167 | 19095 | 198.56 | 486 | 475 | 93.8 |
| B | 15 | 204 | 16238 | 168.09 | 486 | 475 | 93.8 |
| B | 0 | 183 | 11926 | 122.11 | 486 | 475 | 93.8 |
| C | 13 | 61 | 3775 | 29.76 | 470 | 472 | 111.0 |
| C | 1 | 16 | 2895 | 21.83 | 470 | 472 | 111.0 |
| C | 3 | 202 | 1178 | 6.36 | 470 | 472 | 111.0 |
| D | 13 | 239 | 44507 | 389.52 | 466 | 452 | 113.1 |
| D | 13 | 137 | 24071 | 208.83 | 466 | 452 | 113.1 |
| D | 2 | 14 | 18521 | 159.76 | 466 | 452 | 113.1 |
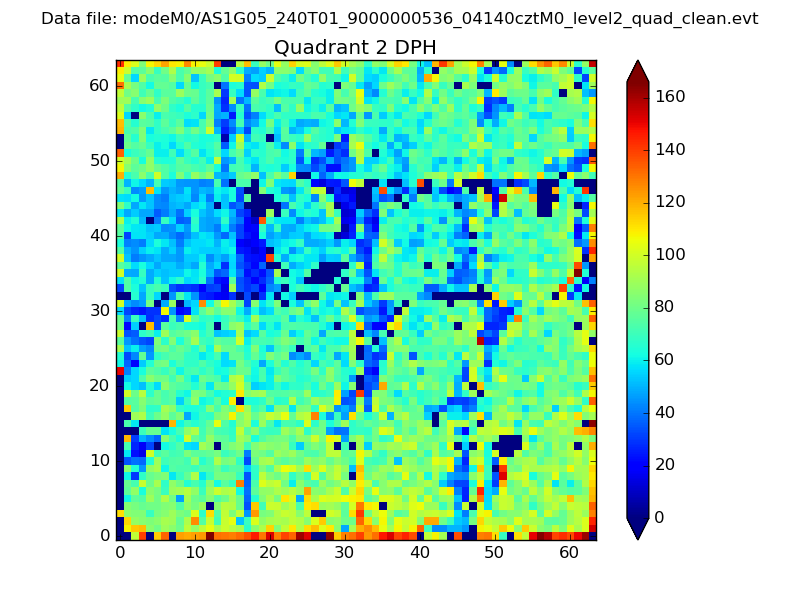
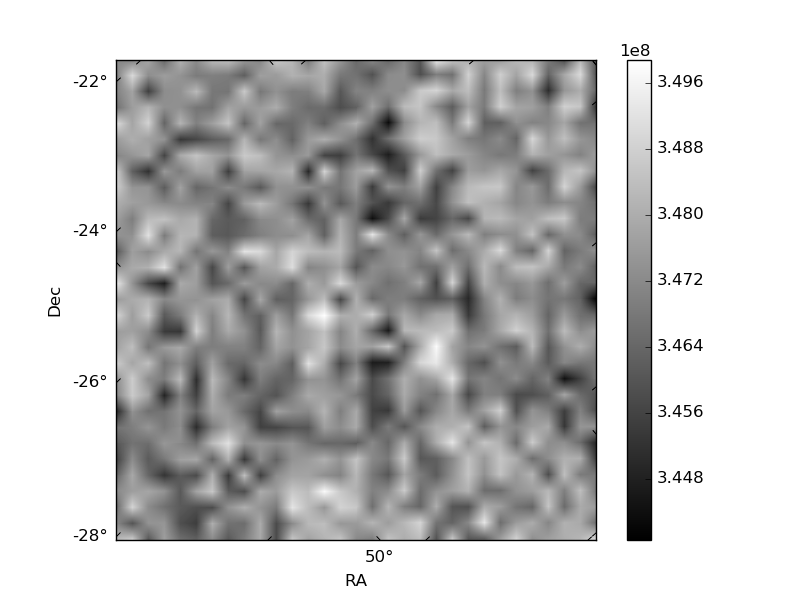
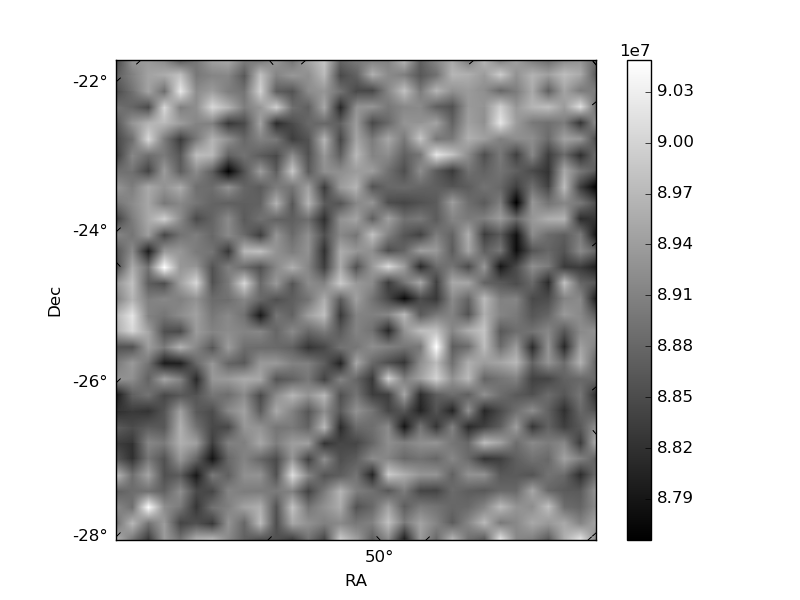
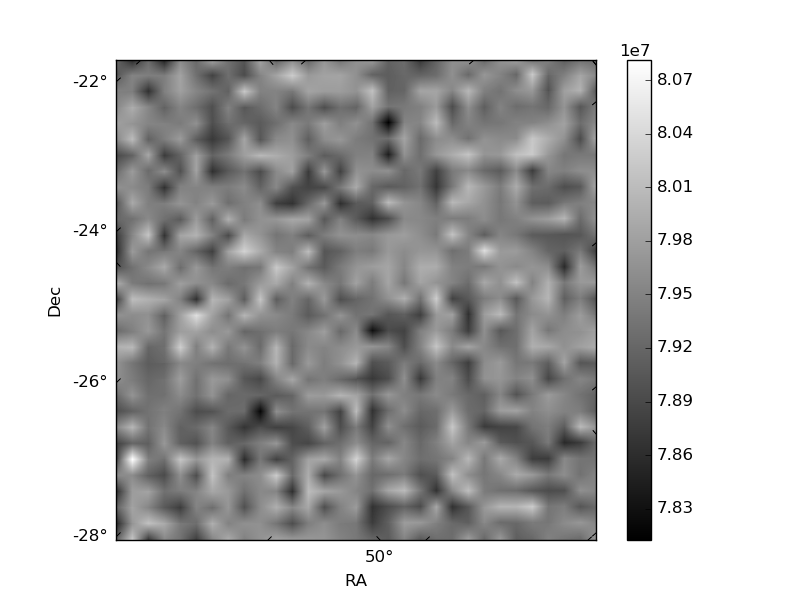
Histogram calculated using DETX and DETY for each event in the final _common_clean file
| Quadrant A | 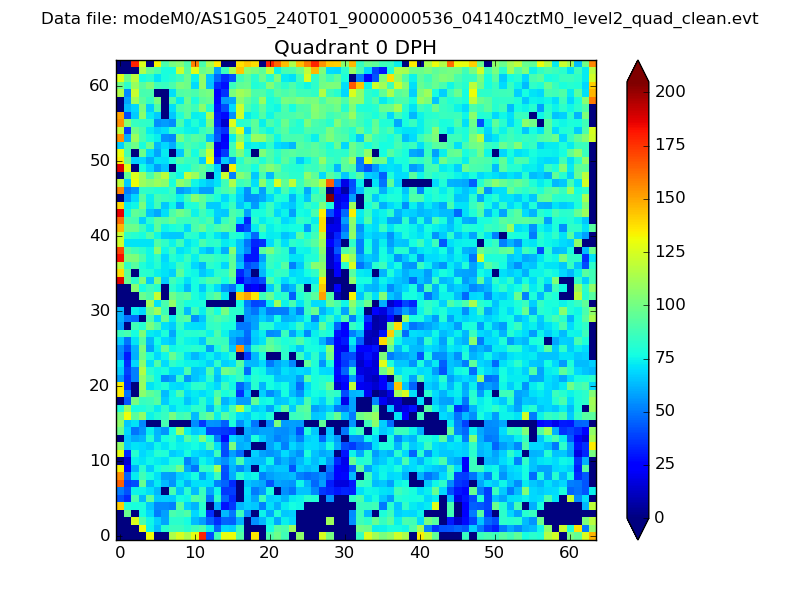 |
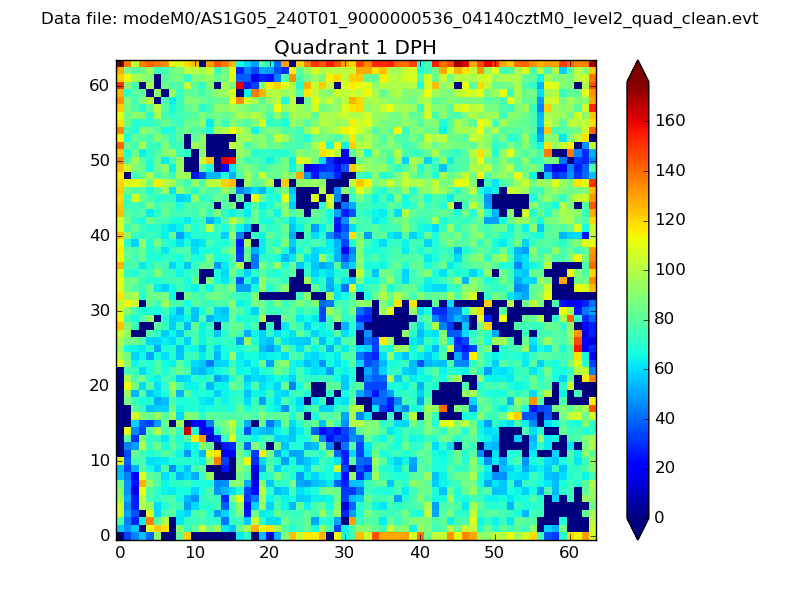 |
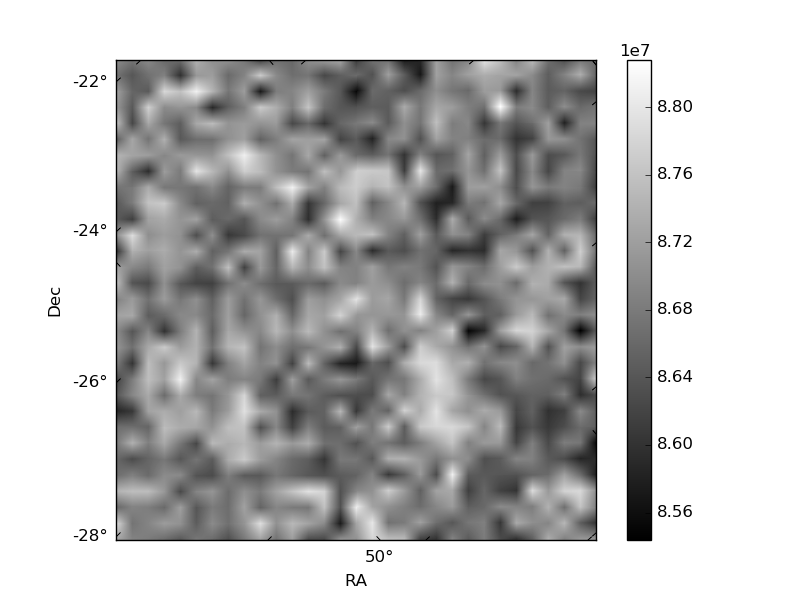
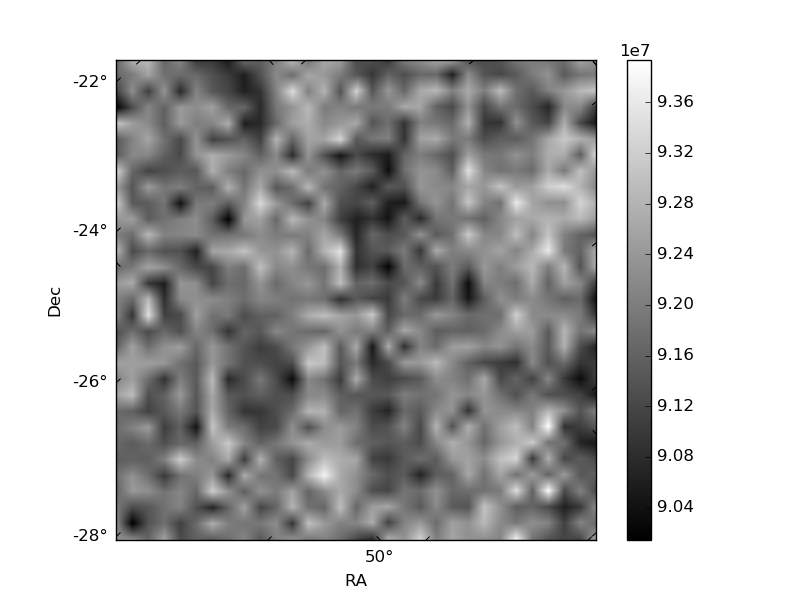
Quadrant B |
|---|---|---|---|
| Quadrant D | 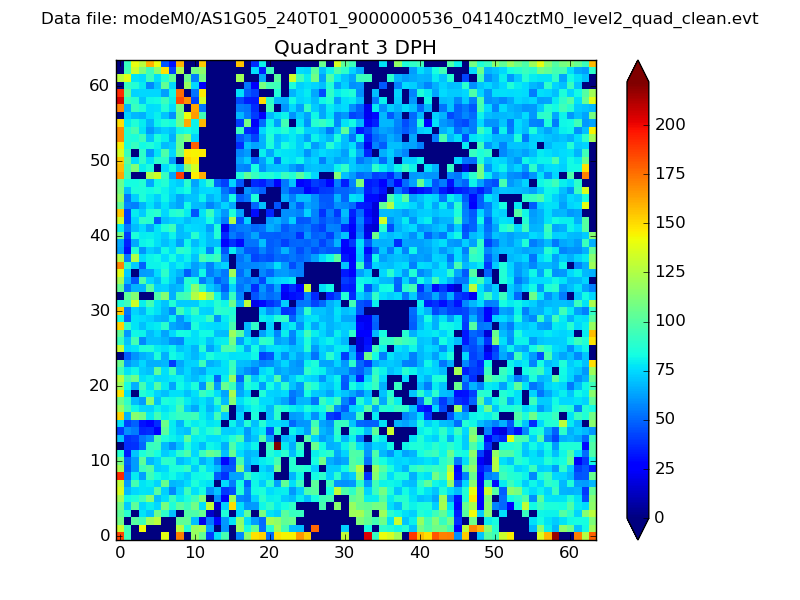 |
 |
Quadrant C |
| Plot type | Count rate plots | Images |
|---|---|---|
| Comparison with Poisson distribution Blue bars denote a histogram of data divided into 1 sec bins. Red curve is a Poisson curve with rate = median count rate of data. |
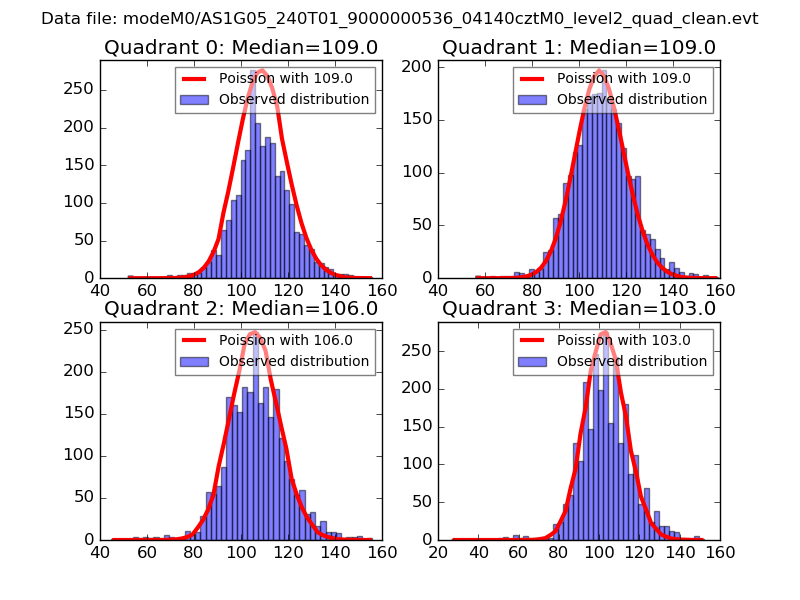 |
 |
| Quadrant-wise count rates Data is divided into 100 sec bins |
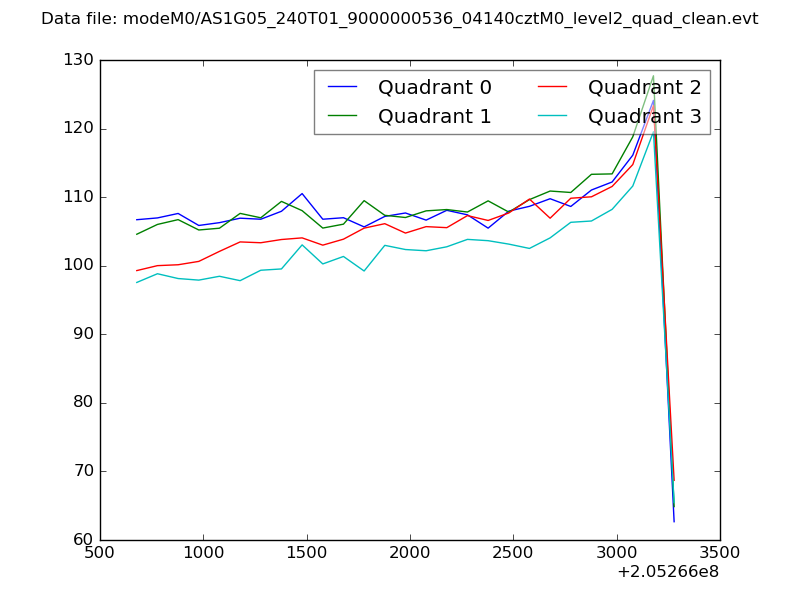 |
|
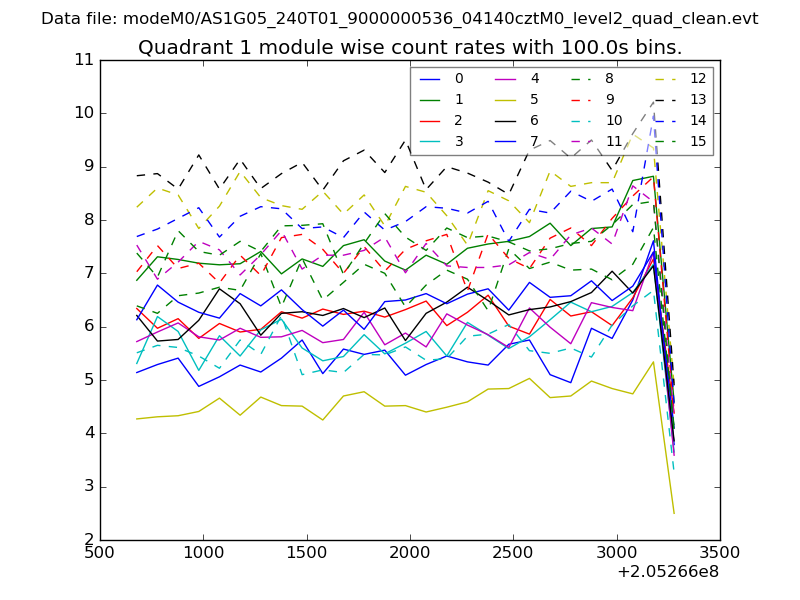
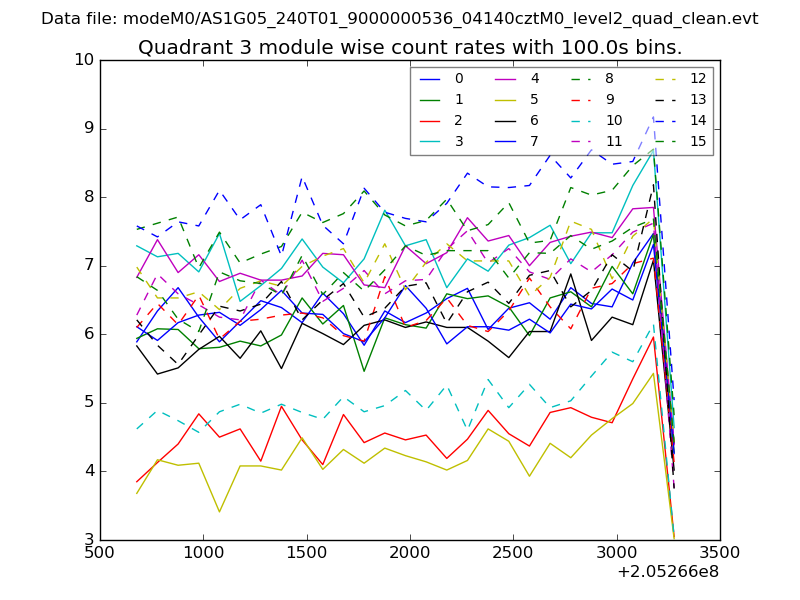
| Module-wise count rates for Quadrant A Data is divided into 100 sec bins |
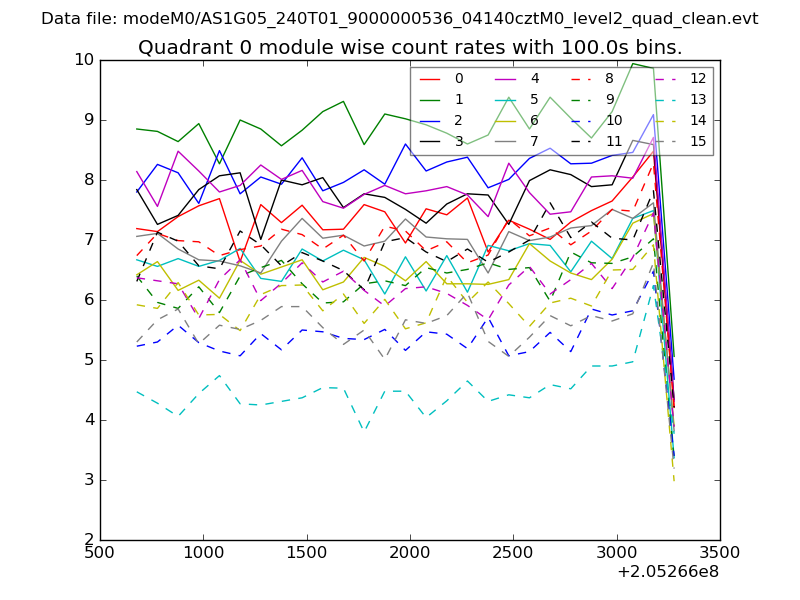 |
 |
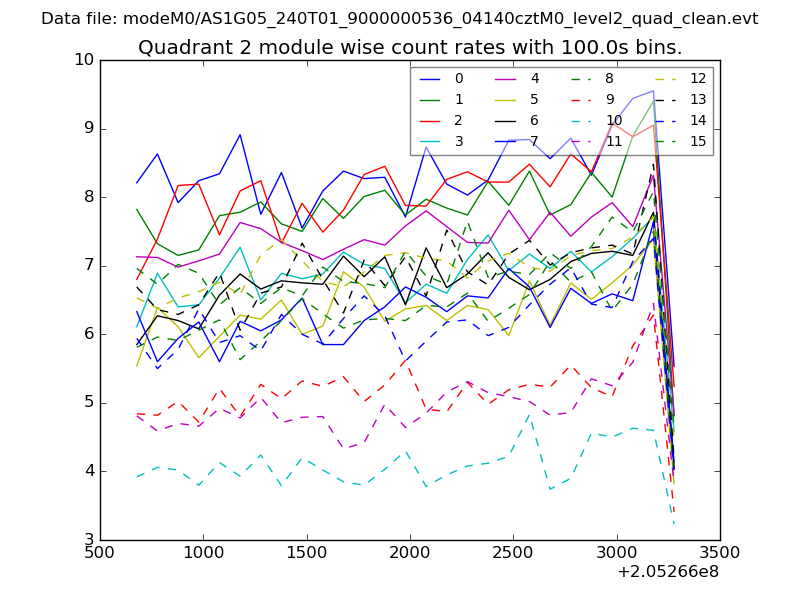
| Module-wise count rates for Quadrant B Data is divided into 100 sec bins |
 |
 |
| Module-wise count rates for Quadrant C Data is divided into 100 sec bins |
 |
 |
| Module-wise count rates for Quadrant D Data is divided into 100 sec bins |
 |
 |
| Parameter | Plot |
|---|---|
| CZT HV Monitor | 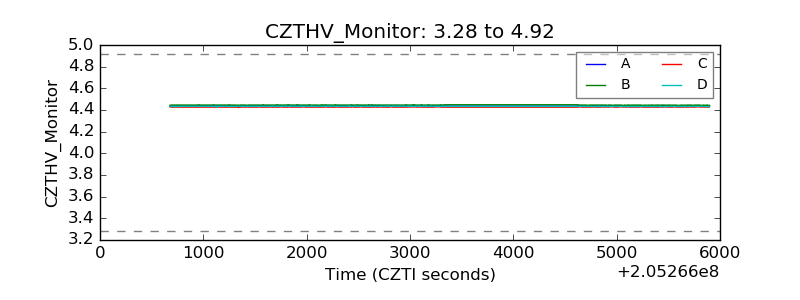 |
| D_VDD | 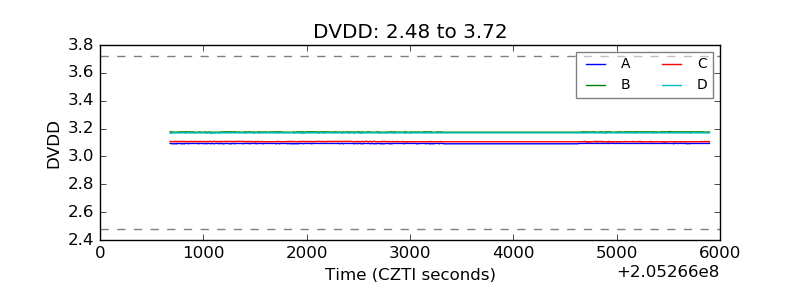 |
| Temperature 1 | 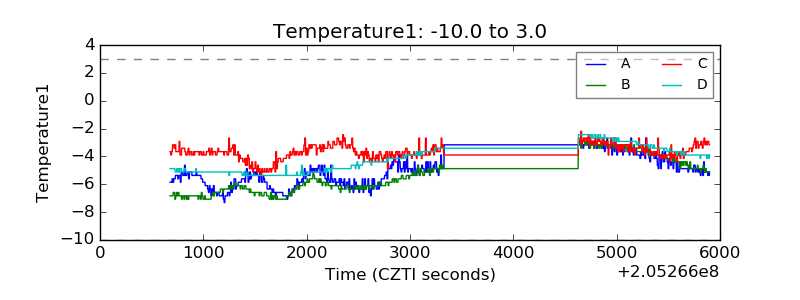 |
| Veto HV Monitor |  |
| Veto LLD | 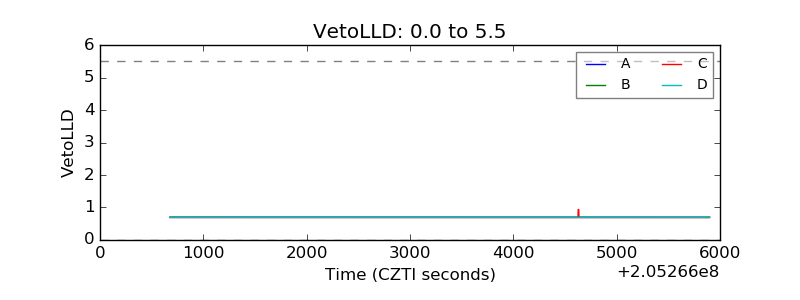 |
| Alpha Counter | 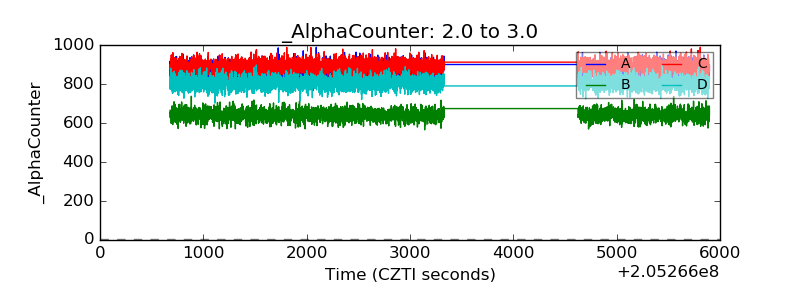 |
| _CPM_Rate | 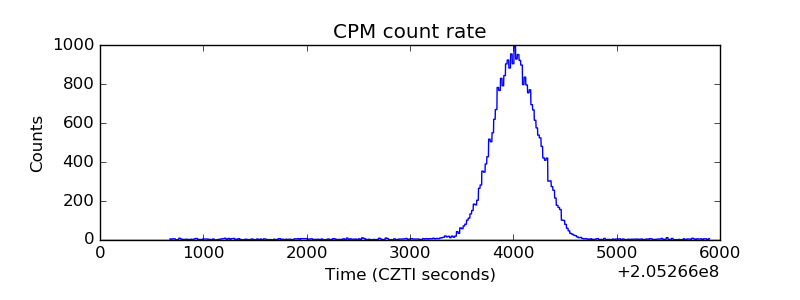 |
| CZT Counter | 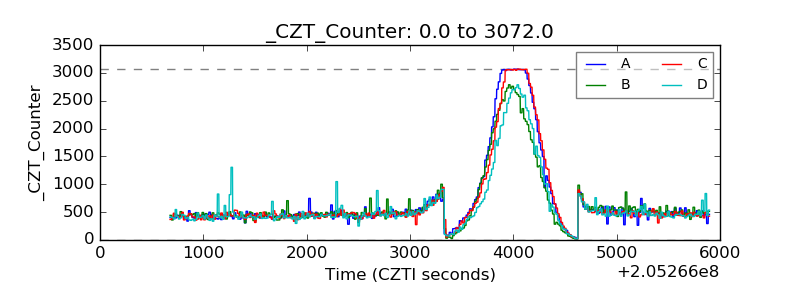 |
| +2.5 Volts monitor |  |
| +5 Volts monitor |  |
| _ROLL_ROT | 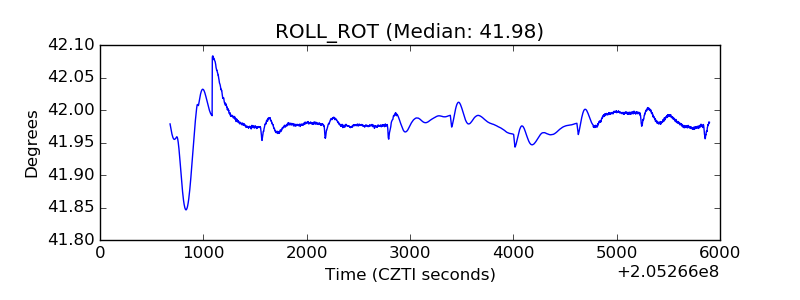 |
| _Roll_DEC | 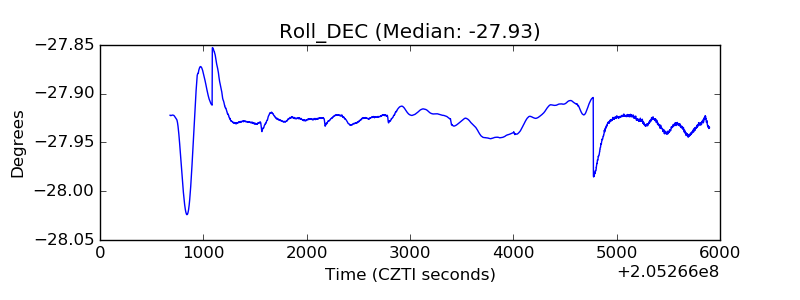 |
| _Roll_RA | 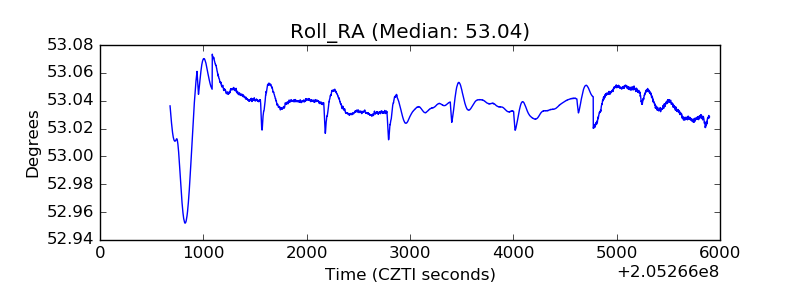 |
| Veto Counter | 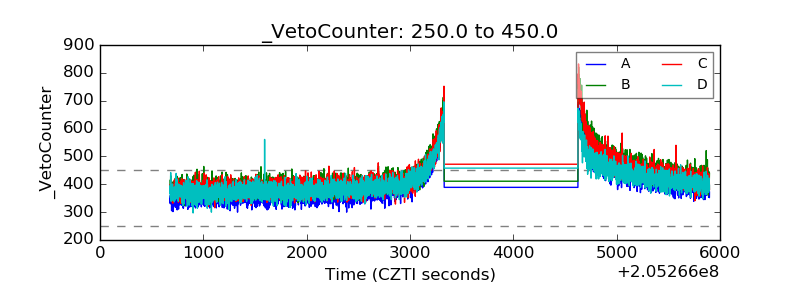 |