| Param | Original file | Final file |
|---|---|---|
| Filename | modeM0/AS1G05_240T01_9000000536_04141cztM0_level2.evt | modeM0/AS1G05_240T01_9000000536_04141cztM0_level2_quad_clean.evt |
| Size (bytes) | 248,489,280 | 35,651,520 |
| Size | 237.0 MB | 34.0 MB |
| Events in quadrant A | 1,687,944 | 209,804 |
| Events in quadrant B | 1,892,337 | 209,101 |
| Events in quadrant C | 1,646,083 | 203,323 |
| Events in quadrant D | 2,045,893 | 195,193 |
| Mode SS | |||
|---|---|---|---|
| Quadrant | BADHDUFLAG | Total packets | Discarded packets |
| A | 0 | 74 | 0 |
| B | 0 | 74 | 0 |
| C | 0 | 74 | 0 |
| D | 0 | 74 | 0 |
| Mode M9 | |||
|---|---|---|---|
| Quadrant | BADHDUFLAG | Total packets | Discarded packets |
| A | 0 | 6 | 0 |
| B | 0 | 6 | 0 |
| C | 0 | 6 | 0 |
| D | 0 | 7 | 0 |
| Mode M0 | |||
|---|---|---|---|
| Quadrant | BADHDUFLAG | Total packets | Discarded packets |
| A | 0 | 7503 | 1 |
| B | 0 | 7949 | 1 |
| C | 0 | 7481 | 1 |
| D | 0 | 8784 | 1 |
| Quadrant | Total seconds | Saturated seconds | Saturation percentage |
|---|---|---|---|
| A | 3697 | 10 | 0.270490% |
| B | 3697 | 30 | 0.811469% |
| C | 3697 | 8 | 0.216392% |
| D | 3697 | 104 | 2.813092% |
Noise dominated data is calculated using 1-second bins in cleaned event files. If a bin has >2000 counts, and if more than 50% of those come from <1% of pixels, then it is considered to be noise-dominated and hence unusable.
| Quadrant | # 1 sec bins | Bins with >0 counts | Bins with >2000 counts | High rate bins dominated by noise | Noise dominated (total time) | Noise dominated (detector-on time) | Marked lightcurve |
|---|---|---|---|---|---|---|---|
| A | 3696 | 3696 | 0 | 0 | 0.00% | 0.00% | 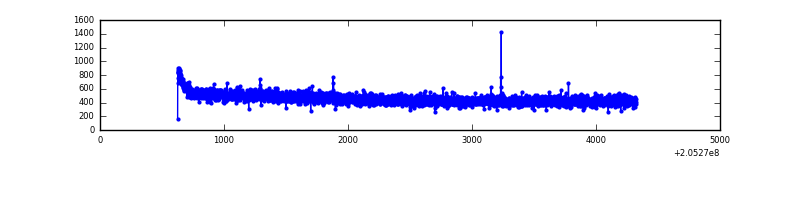 |
| B | 3696 | 3696 | 16 | 16 | 0.43% | 0.43% |  |
| C | 3696 | 3696 | 0 | 0 | 0.00% | 0.00% | 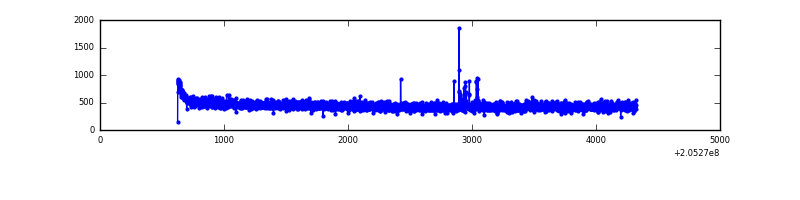 |
| D | 3697 | 3697 | 119 | 119 | 3.22% | 3.22% | 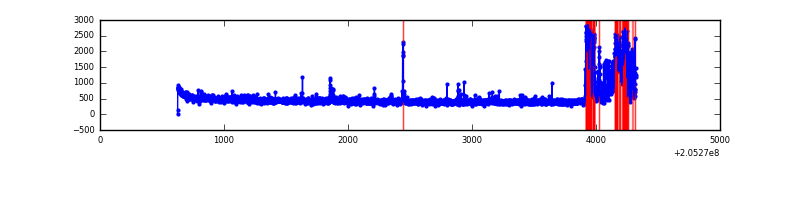 |
Top three noisy pixels from each quadrant. If the there are fewer than three noisy pixels in the level2.evt file, extra rows are filled as -1
| Pixel properties | Quadrant properties | ||||||
|---|---|---|---|---|---|---|---|
| Quadrant | DetID | PixID | Counts | Sigma | Mean | Median | Sigma |
| A | 13 | 14 | 20919 | 234.13 | 429 | 420 | 87.6 |
| A | 15 | 234 | 5036 | 52.72 | 429 | 420 | 87.6 |
| A | 0 | 226 | 4922 | 51.42 | 429 | 420 | 87.6 |
| B | 10 | 16 | 109135 | 1292.77 | 436 | 427 | 84.1 |
| B | 15 | 204 | 34315 | 403.0 | 436 | 427 | 84.1 |
| B | 14 | 167 | 20531 | 239.08 | 436 | 427 | 84.1 |
| C | 10 | 65 | 13714 | 134.53 | 417 | 418 | 98.8 |
| C | 13 | 61 | 3455 | 30.73 | 417 | 418 | 98.8 |
| C | 1 | 16 | 2706 | 23.15 | 417 | 418 | 98.8 |
| D | 13 | 239 | 443384 | 4413.42 | 411 | 400 | 100.4 |
| D | 2 | 63 | 15155 | 147.0 | 411 | 400 | 100.4 |
| D | 10 | 172 | 14442 | 139.9 | 411 | 400 | 100.4 |
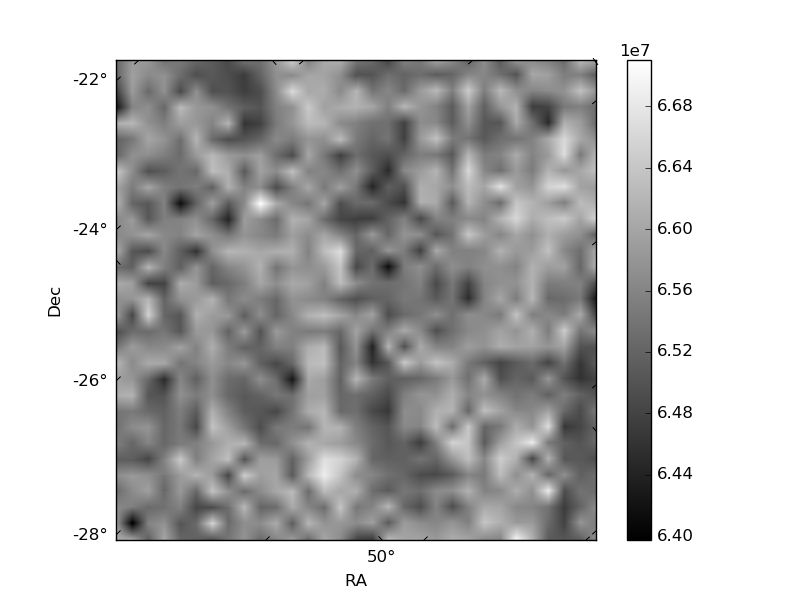
Histogram calculated using DETX and DETY for each event in the final _common_clean file
| Quadrant A |  |
 |
Quadrant B |
|---|---|---|---|
| Quadrant D | 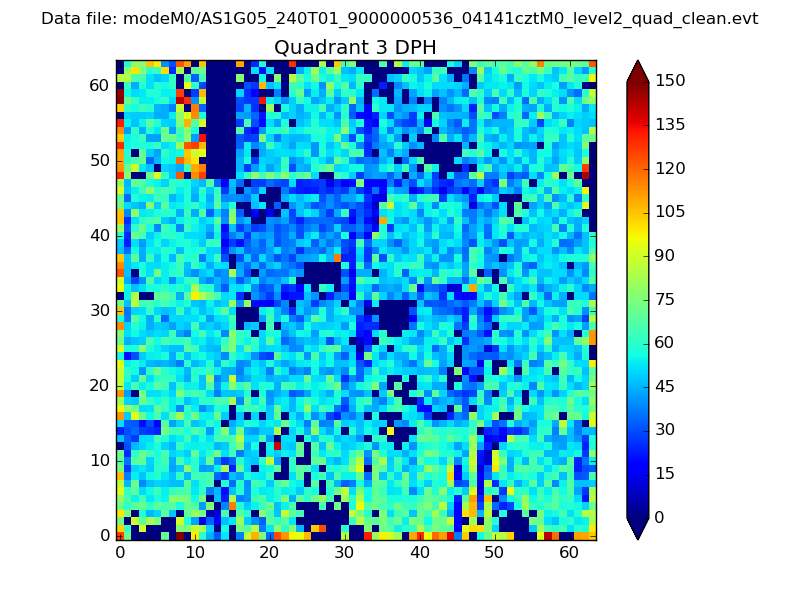 |
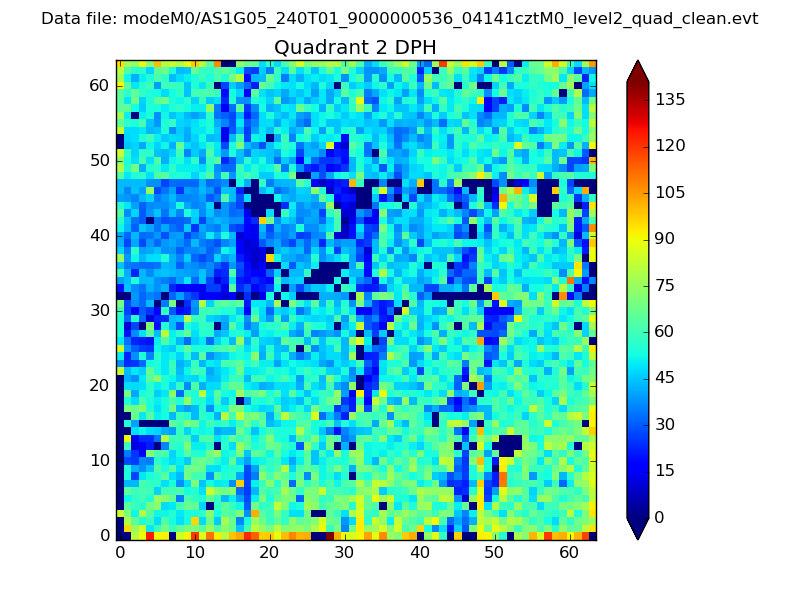 |
Quadrant C |
| Plot type | Count rate plots | Images |
|---|---|---|
| Comparison with Poisson distribution Blue bars denote a histogram of data divided into 1 sec bins. Red curve is a Poisson curve with rate = median count rate of data. |
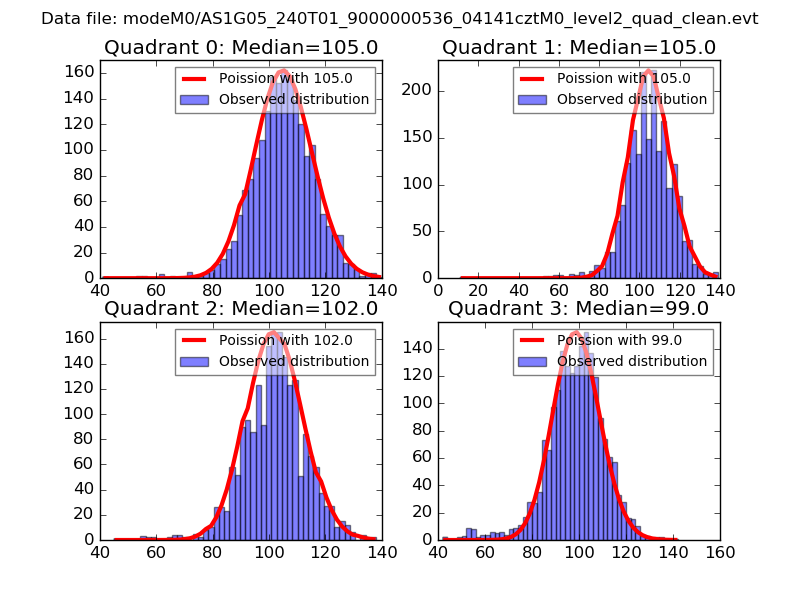 |
 |
| Quadrant-wise count rates Data is divided into 100 sec bins |
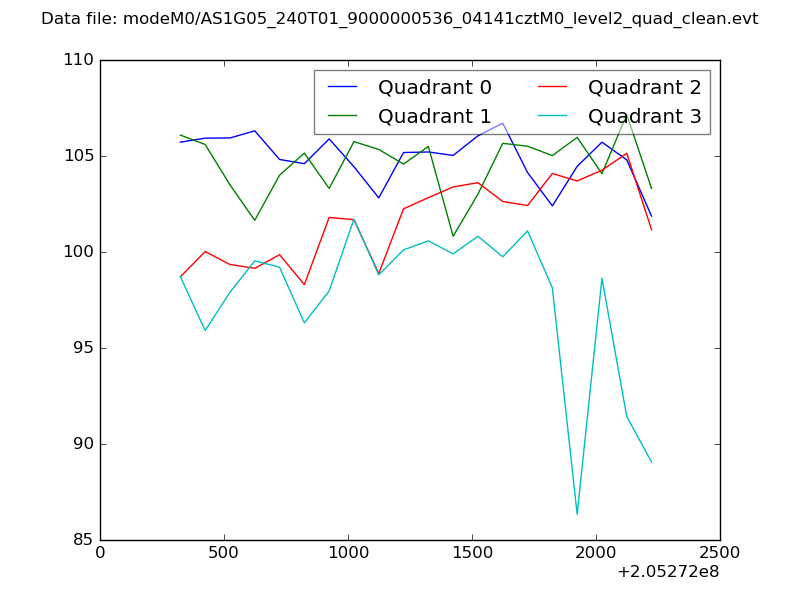 |
|
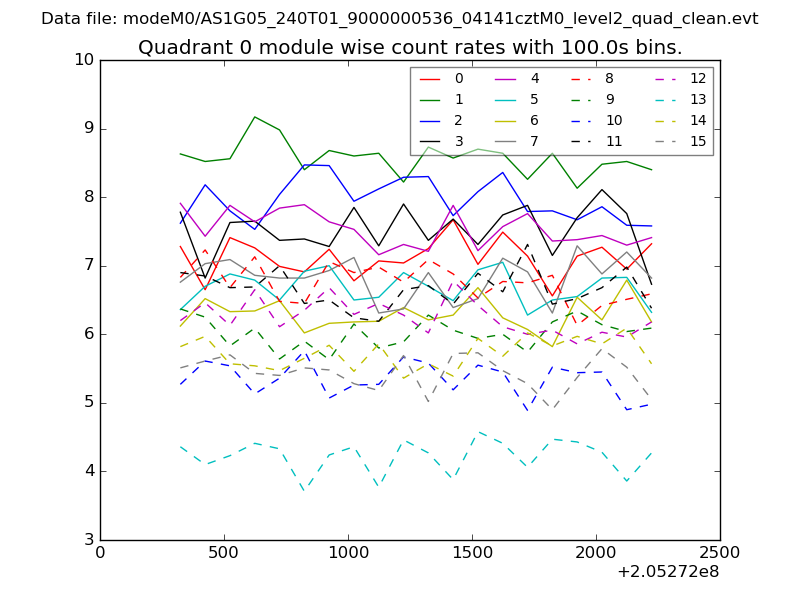
| Module-wise count rates for Quadrant A Data is divided into 100 sec bins |
 |
 |
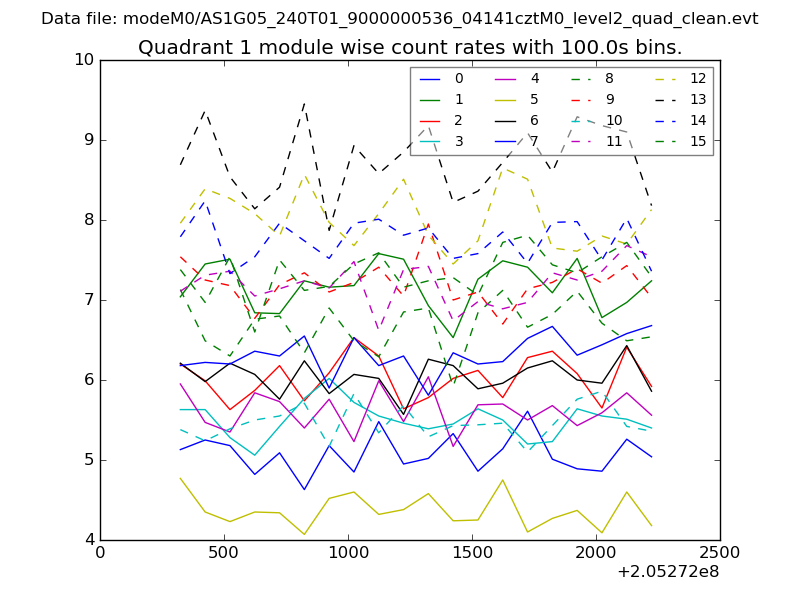
| Module-wise count rates for Quadrant B Data is divided into 100 sec bins |
 |
 |
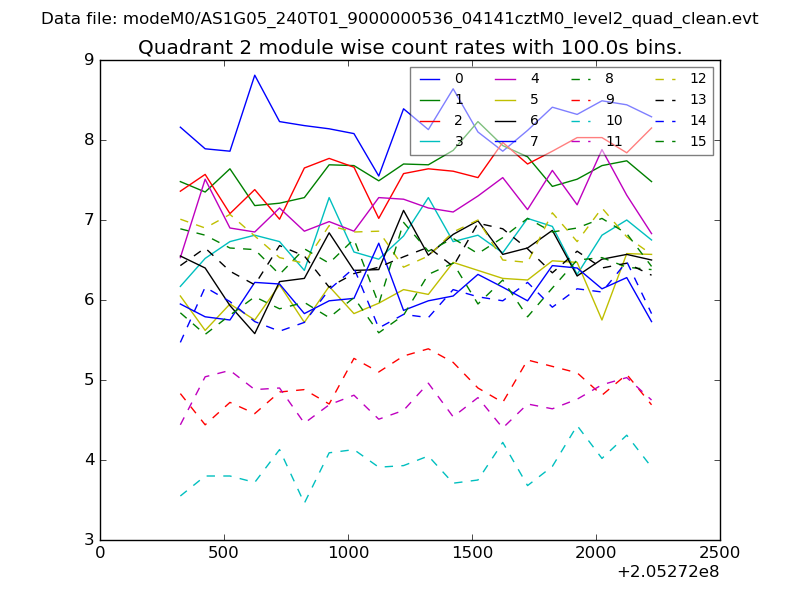
| Module-wise count rates for Quadrant C Data is divided into 100 sec bins |
 |
 |
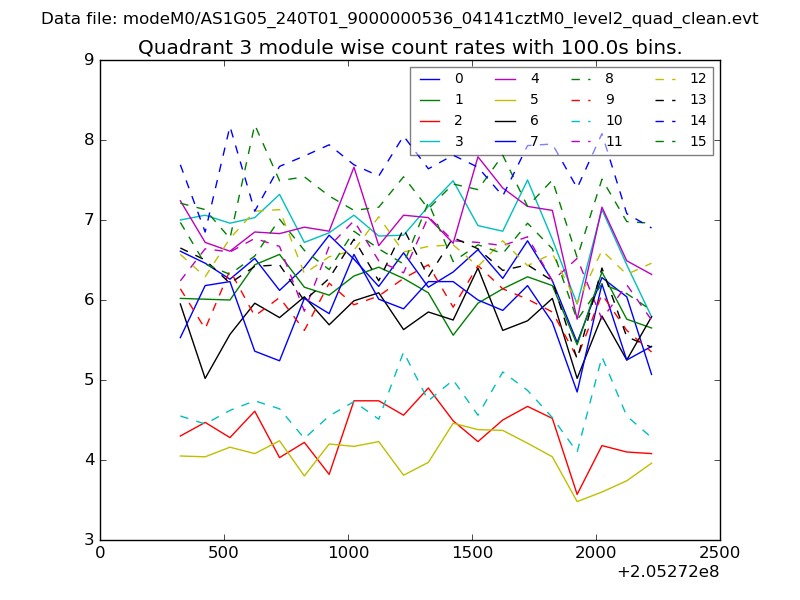
| Module-wise count rates for Quadrant D Data is divided into 100 sec bins |
 |
 |
| Parameter | Plot |
|---|---|
| CZT HV Monitor | 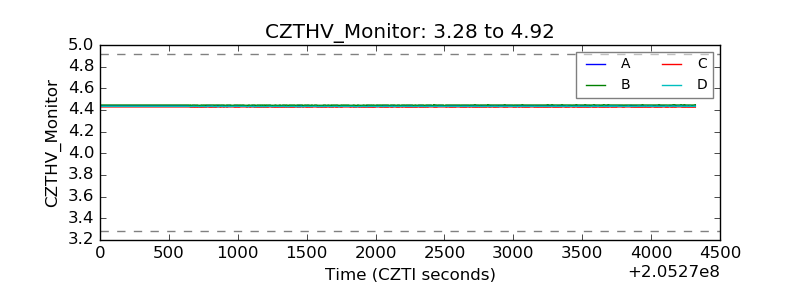 |
| D_VDD | 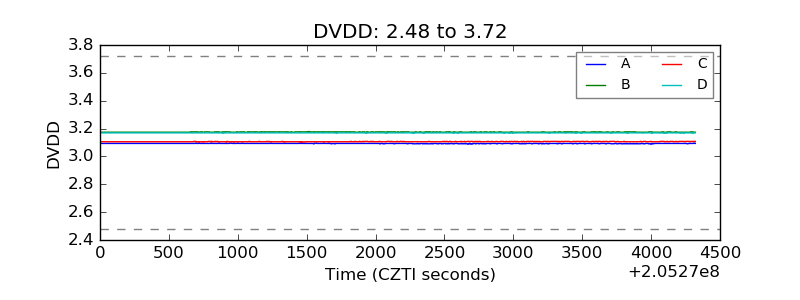 |
| Temperature 1 | 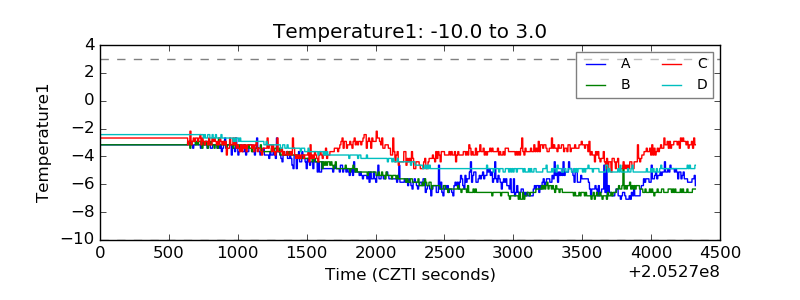 |
| Veto HV Monitor | 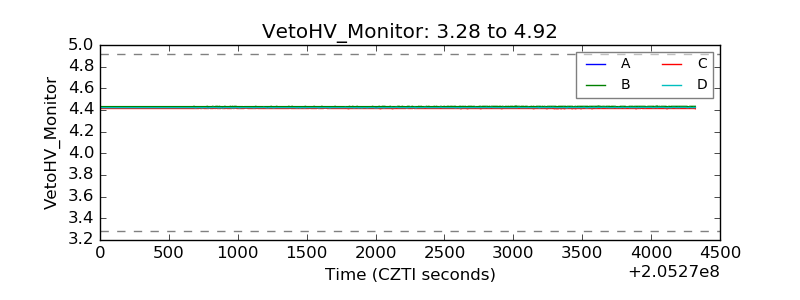 |
| Veto LLD | 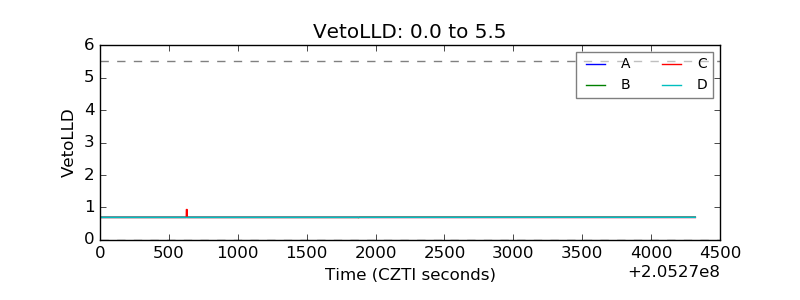 |
| Alpha Counter | 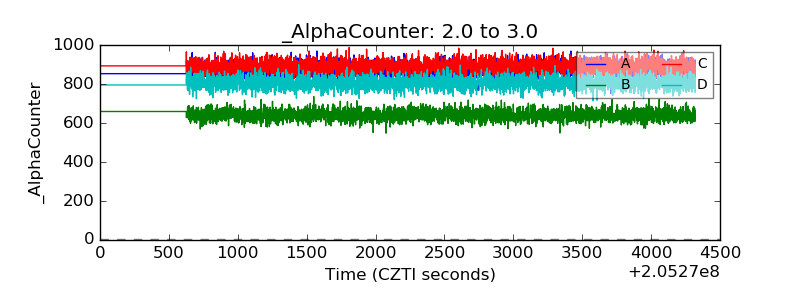 |
| _CPM_Rate | 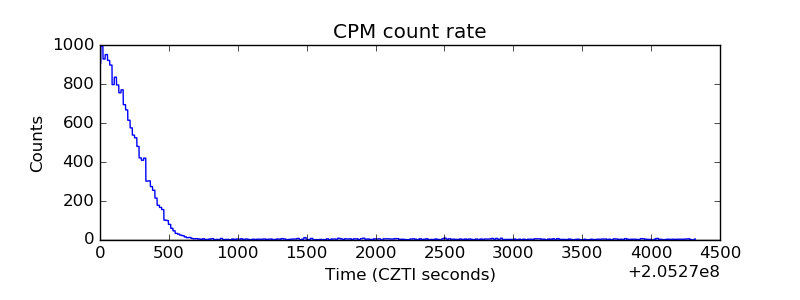 |
| CZT Counter | 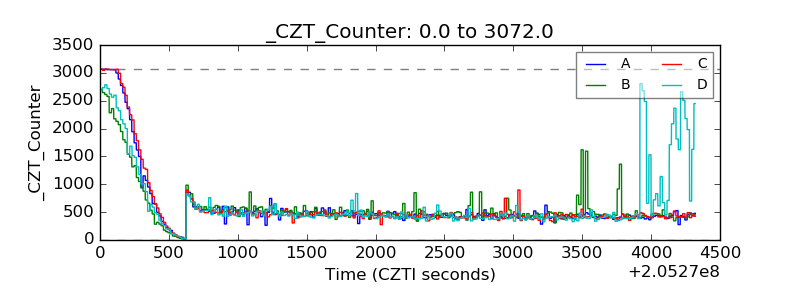 |
| +2.5 Volts monitor |  |
| +5 Volts monitor |  |
| _ROLL_ROT | 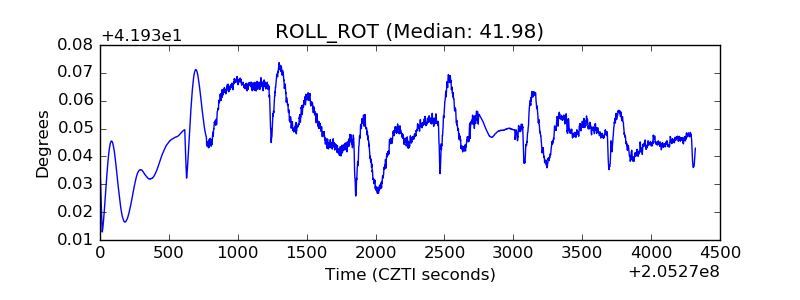 |
| _Roll_DEC | 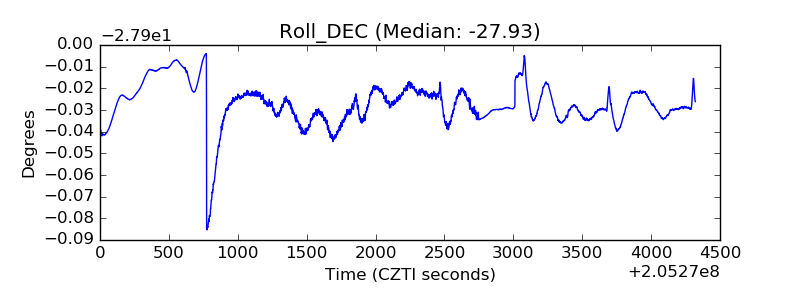 |
| _Roll_RA |  |
| Veto Counter | 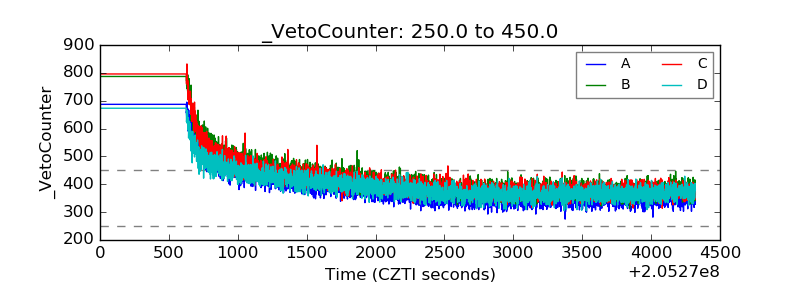 |