| Param | Original file | Final file |
|---|---|---|
| Filename | modeM0/AS1G05_240T01_9000000536_04142cztM0_level2.evt | modeM0/AS1G05_240T01_9000000536_04142cztM0_level2_quad_clean.evt |
| Size (bytes) | 454,440,960 | 70,084,800 |
| Size | 433.4 MB | 66.8 MB |
| Events in quadrant A | 3,301,956 | 417,967 |
| Events in quadrant B | 3,739,060 | 416,964 |
| Events in quadrant C | 3,057,525 | 413,232 |
| Events in quadrant D | 3,200,434 | 398,442 |
| Mode SS | |||
|---|---|---|---|
| Quadrant | BADHDUFLAG | Total packets | Discarded packets |
| A | 0 | 138 | 0 |
| B | 0 | 138 | 0 |
| C | 0 | 138 | 0 |
| D | 0 | 138 | 0 |
| Mode M9 | |||
|---|---|---|---|
| Quadrant | BADHDUFLAG | Total packets | Discarded packets |
| A | 0 | 11 | 0 |
| B | 0 | 11 | 0 |
| C | 0 | 11 | 0 |
| D | 0 | 12 | 0 |
| Mode M0 | |||
|---|---|---|---|
| Quadrant | BADHDUFLAG | Total packets | Discarded packets |
| A | 0 | 14534 | 3 |
| B | 0 | 15579 | 2 |
| C | 0 | 13939 | 2 |
| D | 0 | 14466 | 2 |
| Quadrant | Total seconds | Saturated seconds | Saturation percentage |
|---|---|---|---|
| A | 6823 | 110 | 1.612194% |
| B | 6823 | 153 | 2.242415% |
| C | 6823 | 47 | 0.688847% |
| D | 6823 | 72 | 1.055254% |
Noise dominated data is calculated using 1-second bins in cleaned event files. If a bin has >2000 counts, and if more than 50% of those come from <1% of pixels, then it is considered to be noise-dominated and hence unusable.
| Quadrant | # 1 sec bins | Bins with >0 counts | Bins with >2000 counts | High rate bins dominated by noise | Noise dominated (total time) | Noise dominated (detector-on time) | Marked lightcurve |
|---|---|---|---|---|---|---|---|
| A | 7617 | 6823 | 18 | 18 | 0.24% | 0.26% | 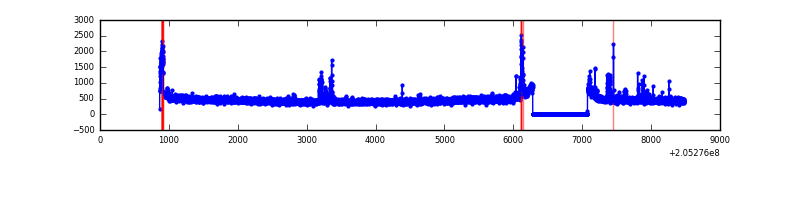 |
| B | 7618 | 6824 | 71 | 71 | 0.93% | 1.04% | 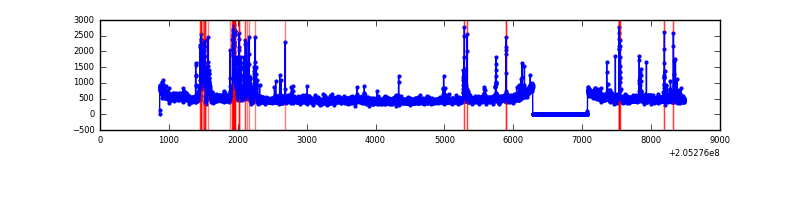 |
| C | 7618 | 6824 | 0 | 0 | 0.00% | 0.00% | 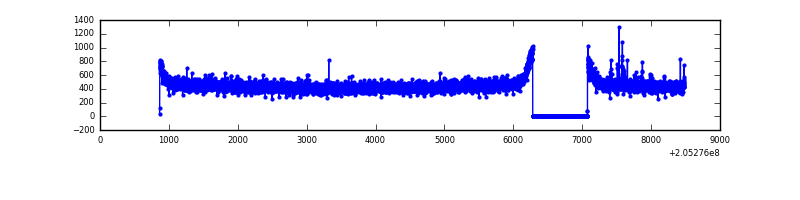 |
| D | 7618 | 6824 | 35 | 35 | 0.46% | 0.51% | 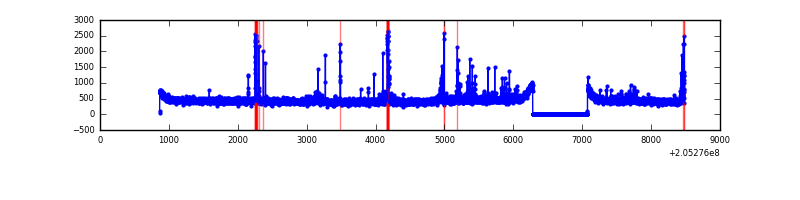 |
Top three noisy pixels from each quadrant. If the there are fewer than three noisy pixels in the level2.evt file, extra rows are filled as -1
| Pixel properties | Quadrant properties | ||||||
|---|---|---|---|---|---|---|---|
| Quadrant | DetID | PixID | Counts | Sigma | Mean | Median | Sigma |
| A | 0 | 118 | 120510 | 731.04 | 797 | 778 | 163.8 |
| A | 14 | 111 | 69730 | 421.0 | 797 | 778 | 163.8 |
| A | 13 | 14 | 20068 | 117.78 | 797 | 778 | 163.8 |
| B | 10 | 16 | 474825 | 3020.66 | 804 | 786 | 156.9 |
| B | 15 | 204 | 74782 | 471.52 | 804 | 786 | 156.9 |
| B | 4 | 81 | 30478 | 189.2 | 804 | 786 | 156.9 |
| C | 10 | 65 | 16817 | 88.76 | 776 | 779 | 180.7 |
| C | 13 | 61 | 6545 | 31.91 | 776 | 779 | 180.7 |
| C | 12 | 4 | 4554 | 20.89 | 776 | 779 | 180.7 |
| D | 2 | 14 | 81826 | 428.88 | 773 | 749 | 189.0 |
| D | 2 | 232 | 62387 | 326.06 | 773 | 749 | 189.0 |
| D | 13 | 239 | 52080 | 271.53 | 773 | 749 | 189.0 |
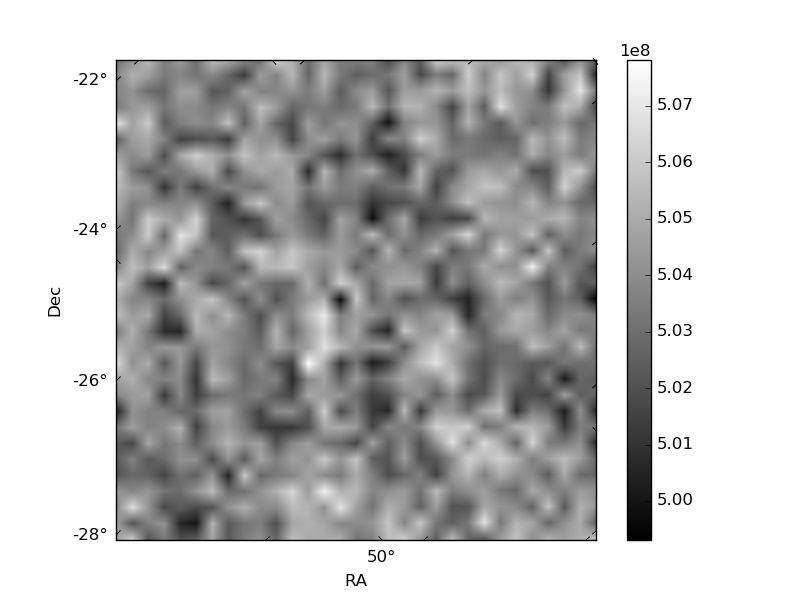
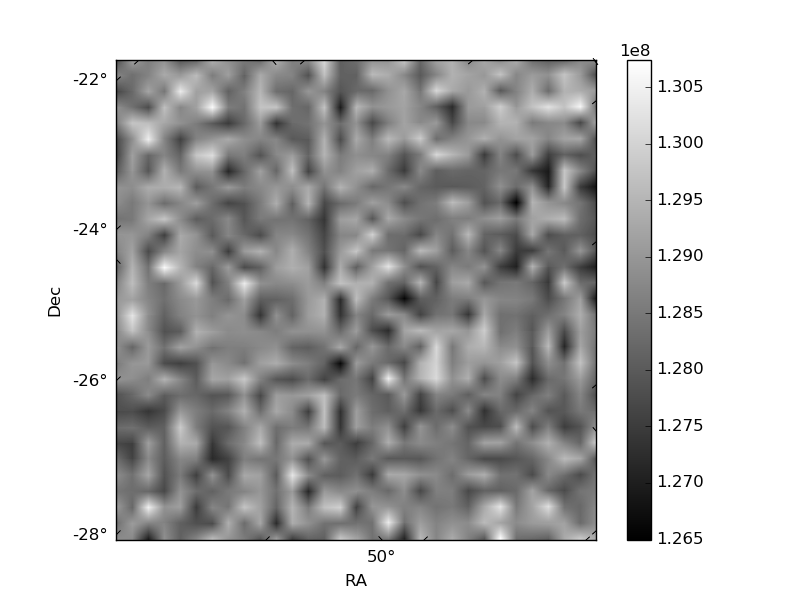
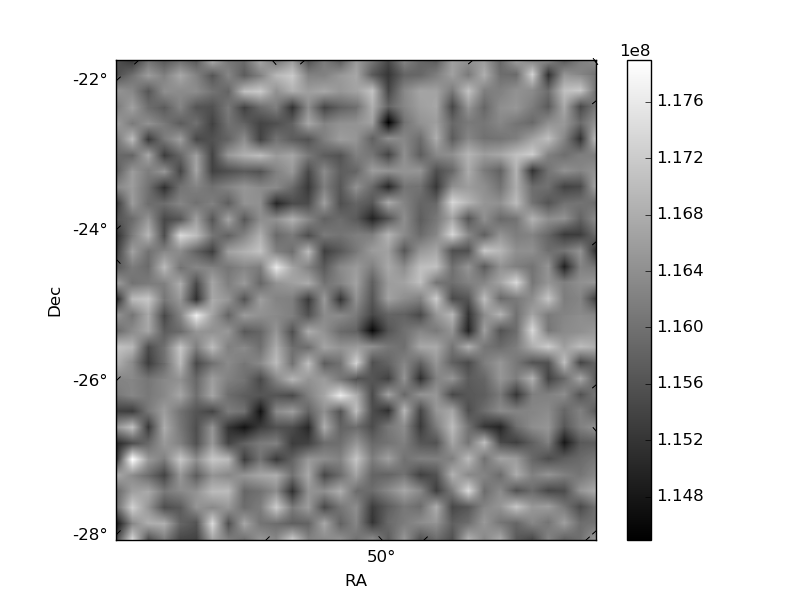
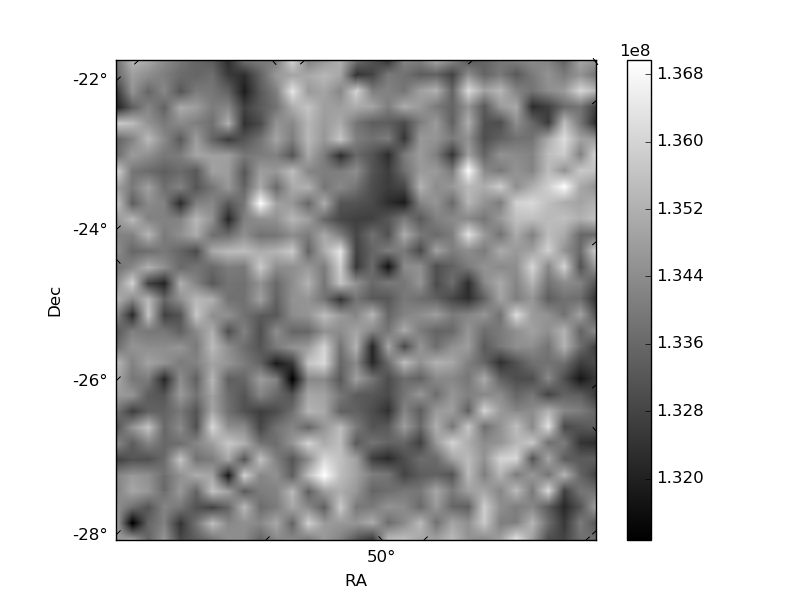
Histogram calculated using DETX and DETY for each event in the final _common_clean file
| Quadrant A | 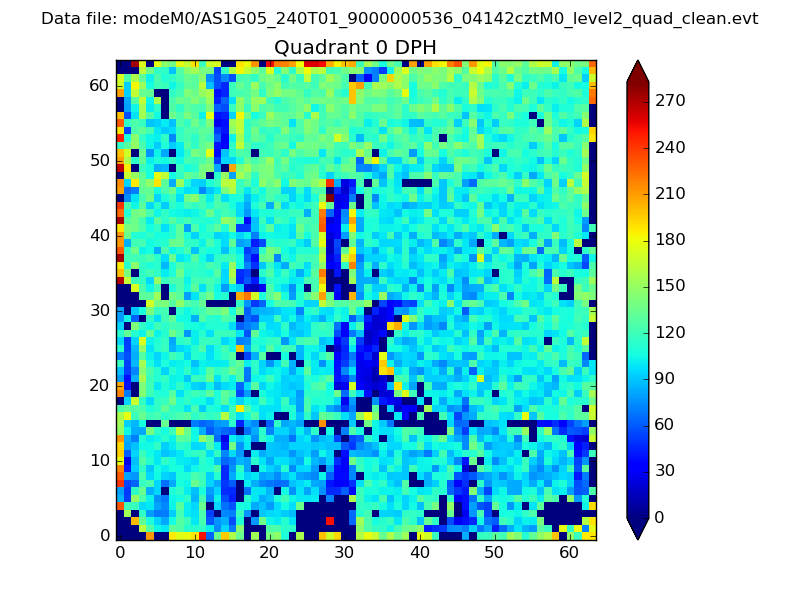 |
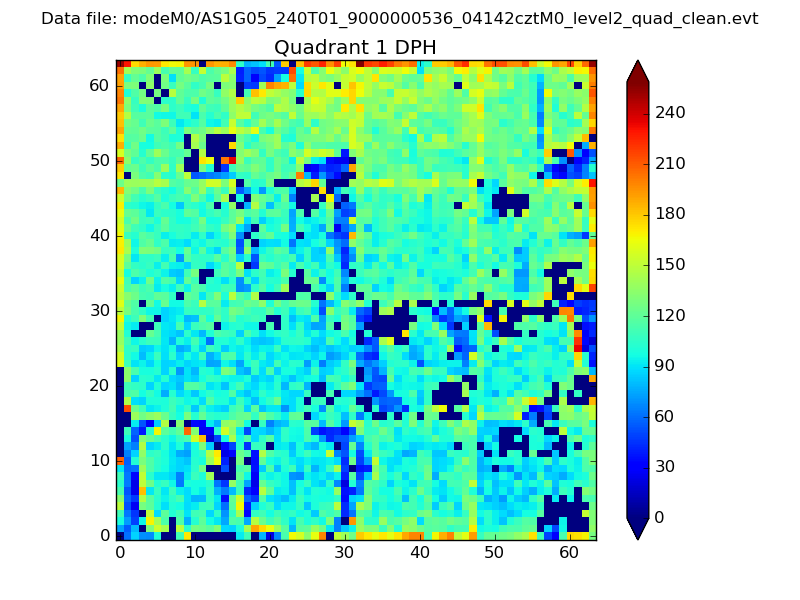 |
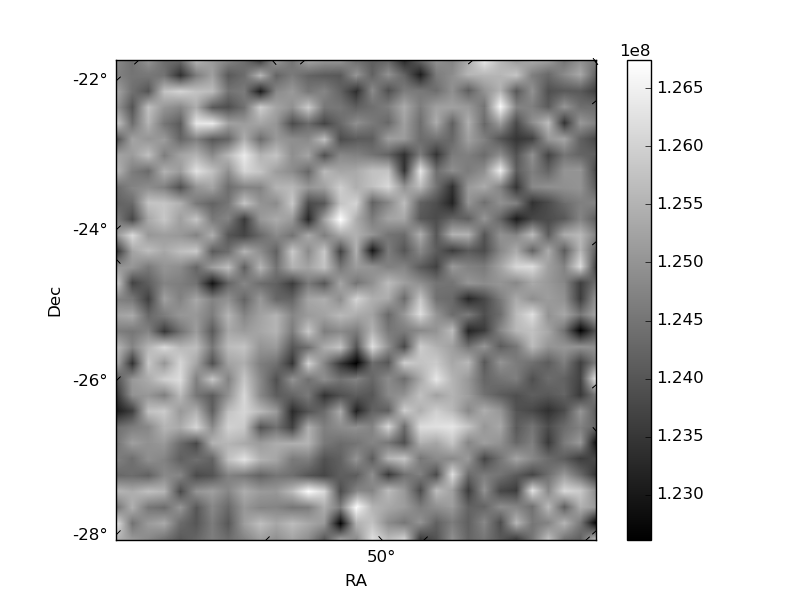
Quadrant B |
|---|---|---|---|
| Quadrant D | 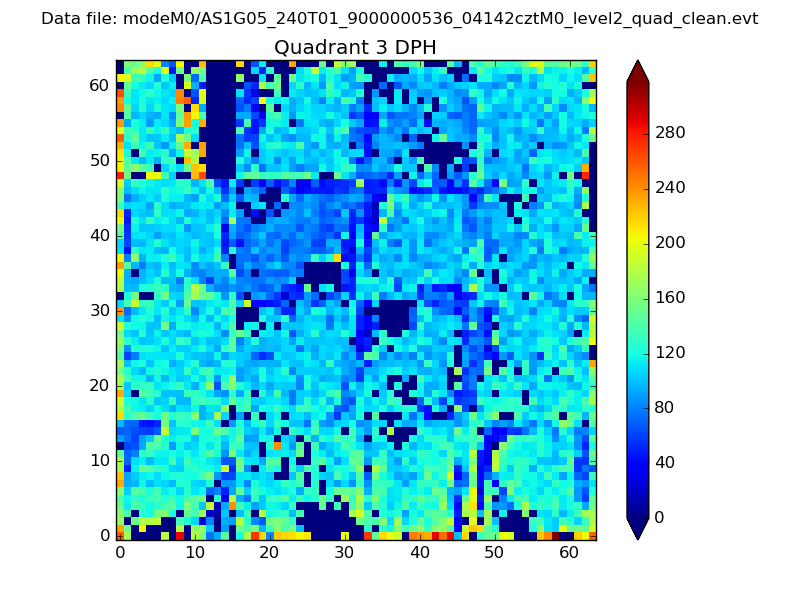 |
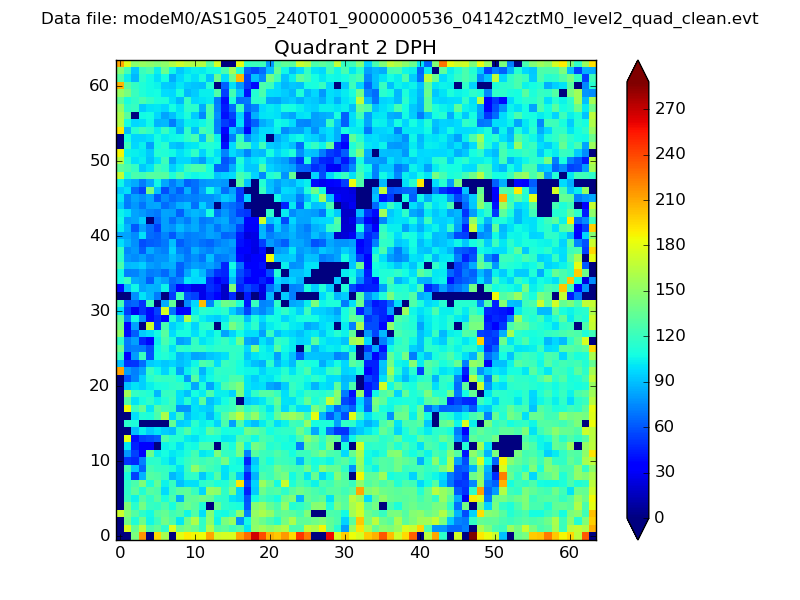 |
Quadrant C |
| Plot type | Count rate plots | Images |
|---|---|---|
| Comparison with Poisson distribution Blue bars denote a histogram of data divided into 1 sec bins. Red curve is a Poisson curve with rate = median count rate of data. |
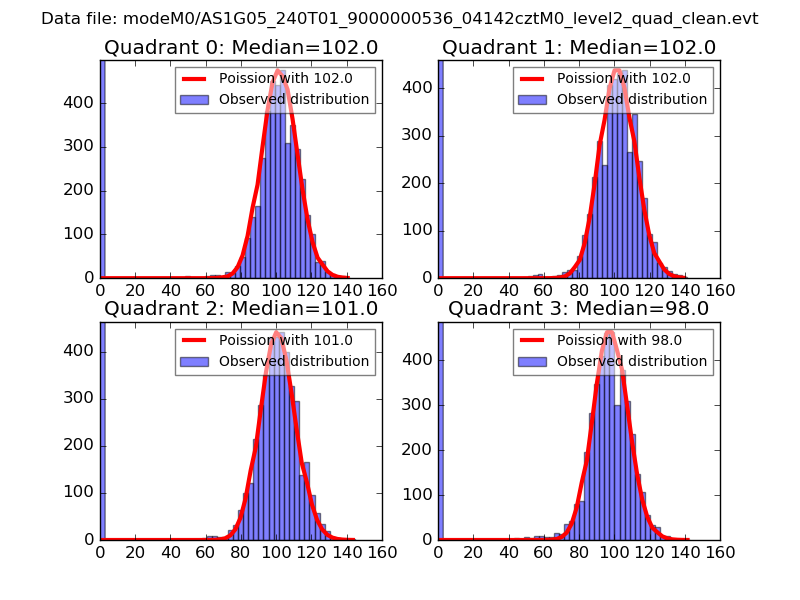 |
 |
| Quadrant-wise count rates Data is divided into 100 sec bins |
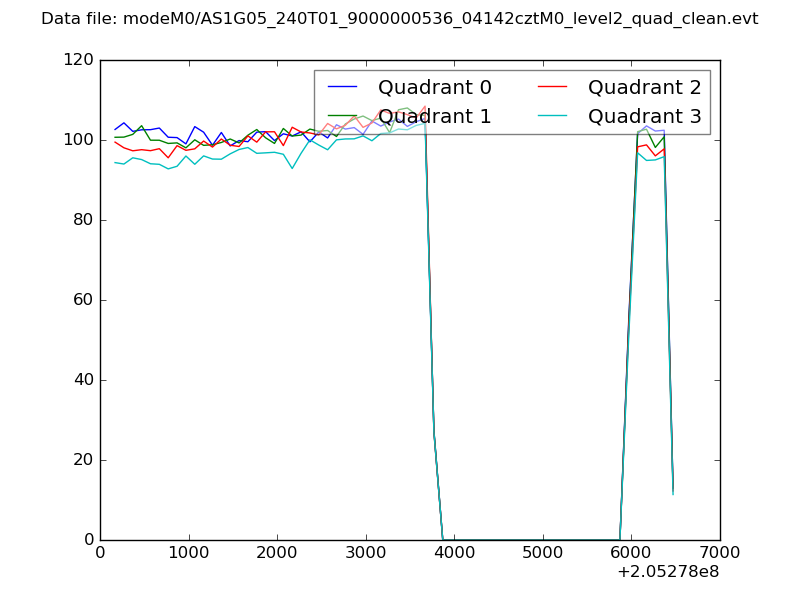 |
|
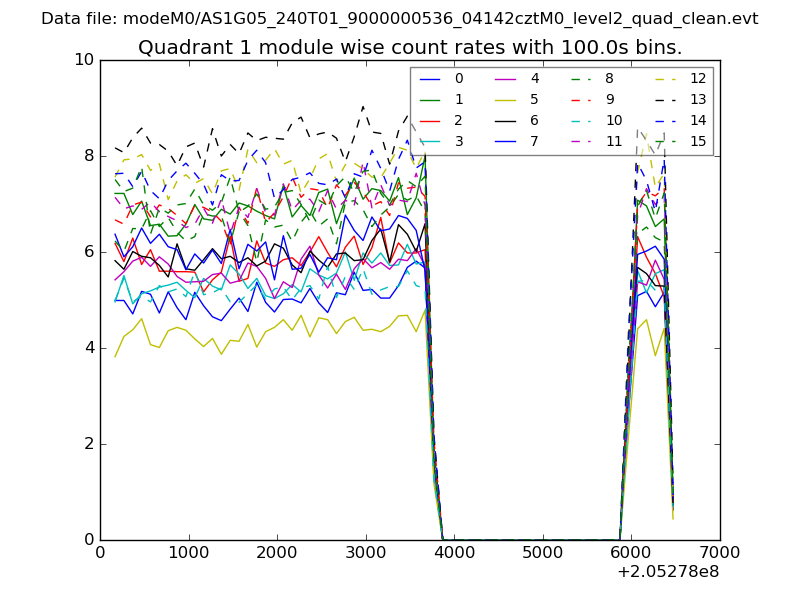
| Module-wise count rates for Quadrant A Data is divided into 100 sec bins |
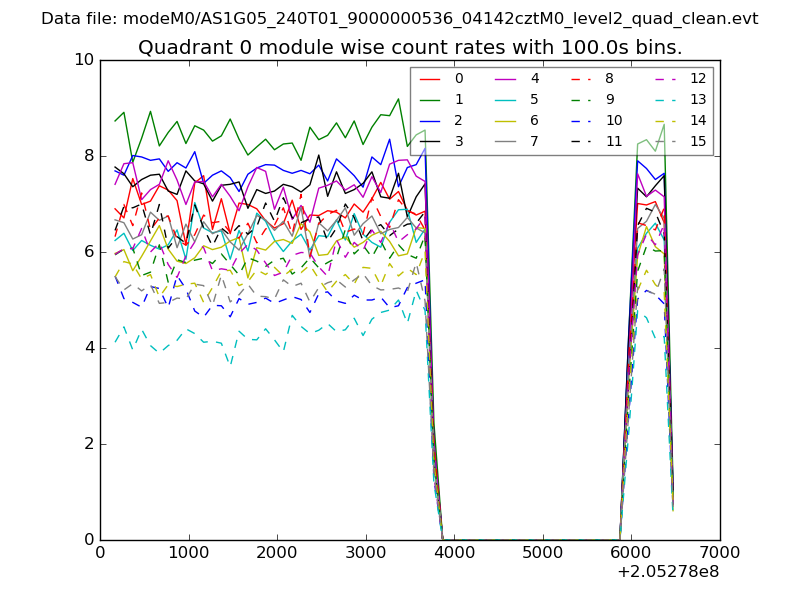 |
 |
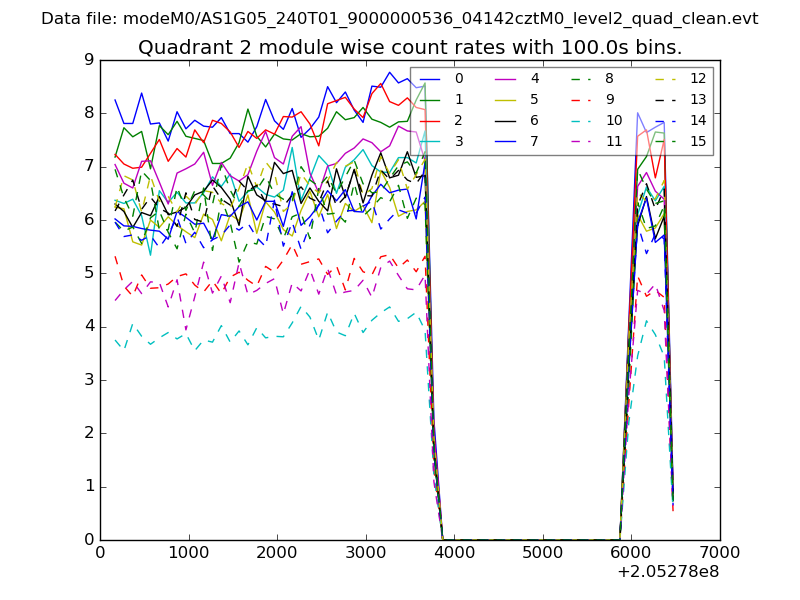
| Module-wise count rates for Quadrant B Data is divided into 100 sec bins |
 |
 |
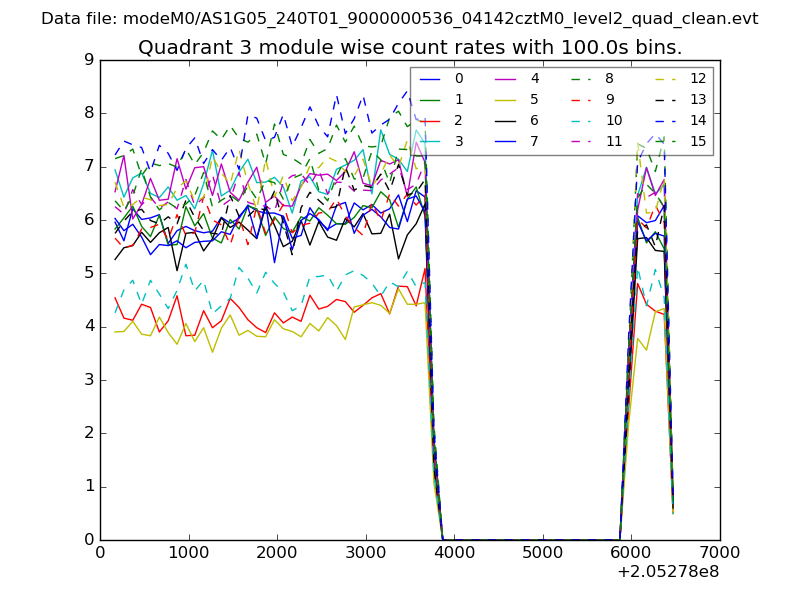
| Module-wise count rates for Quadrant C Data is divided into 100 sec bins |
 |
 |
| Module-wise count rates for Quadrant D Data is divided into 100 sec bins |
 |
 |
| Parameter | Plot |
|---|---|
| CZT HV Monitor | 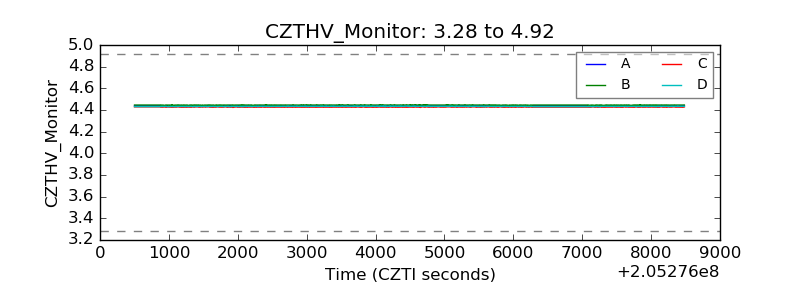 |
| D_VDD | 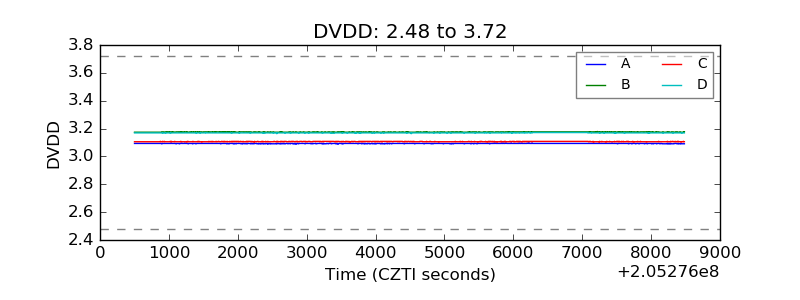 |
| Temperature 1 | 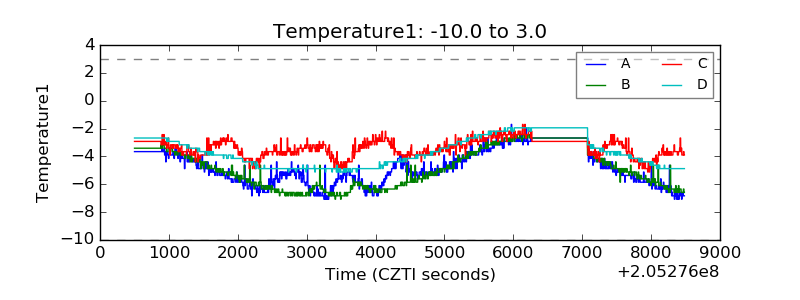 |
| Veto HV Monitor |  |
| Veto LLD | 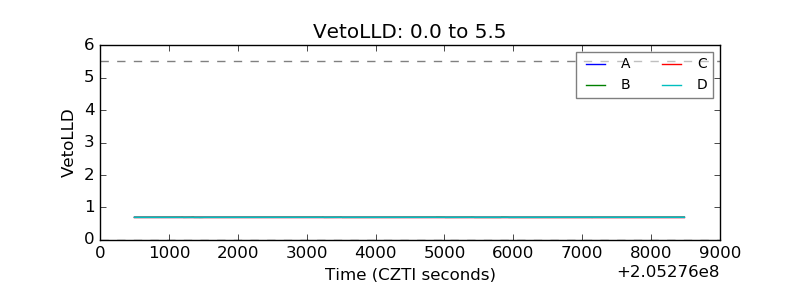 |
| Alpha Counter | 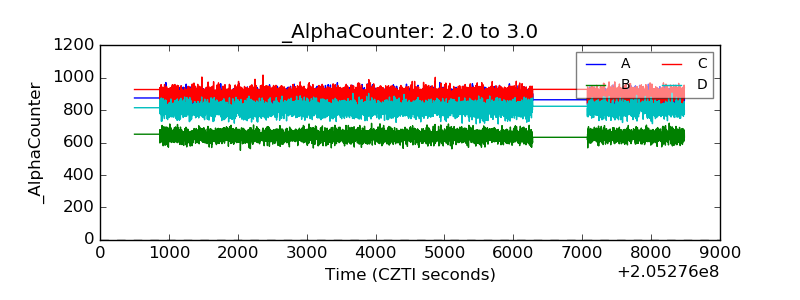 |
| _CPM_Rate | 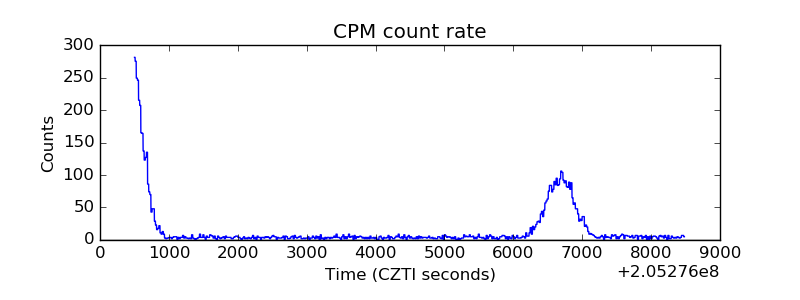 |
| CZT Counter | 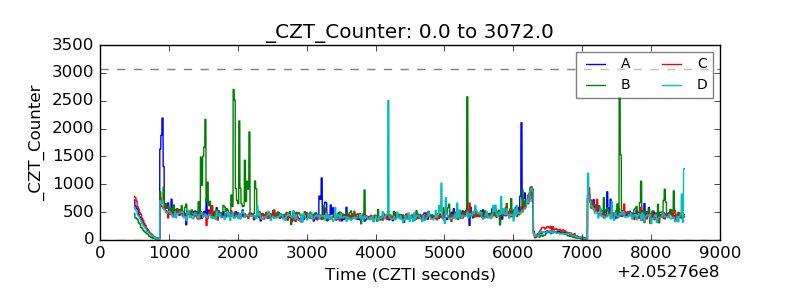 |
| +2.5 Volts monitor |  |
| +5 Volts monitor |  |
| _ROLL_ROT | 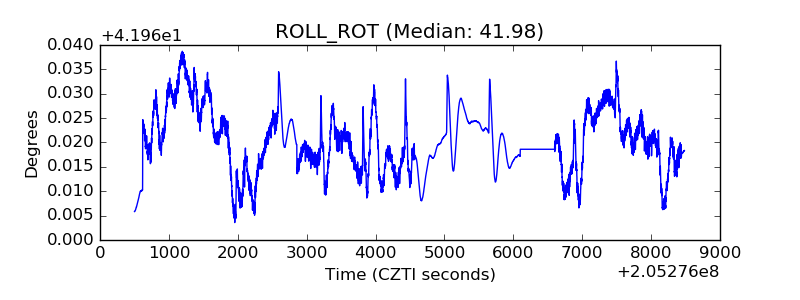 |
| _Roll_DEC | 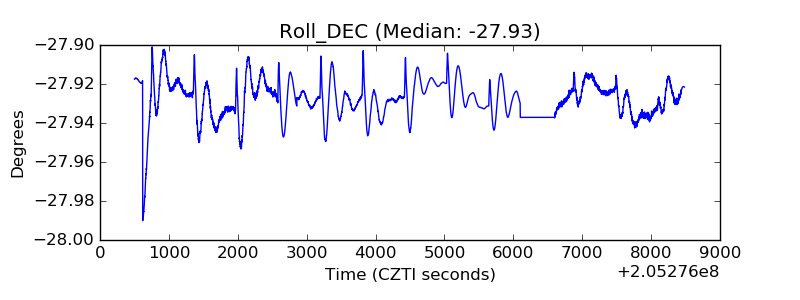 |
| _Roll_RA | 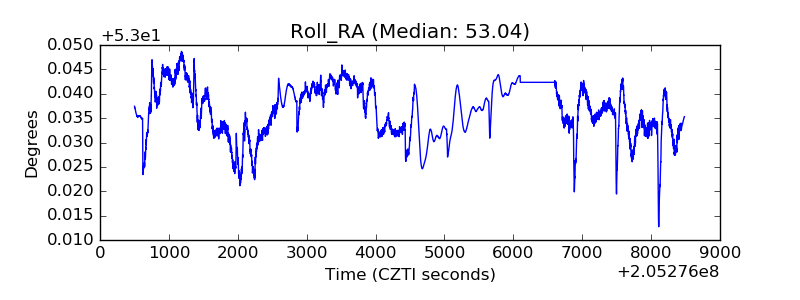 |
| Veto Counter | 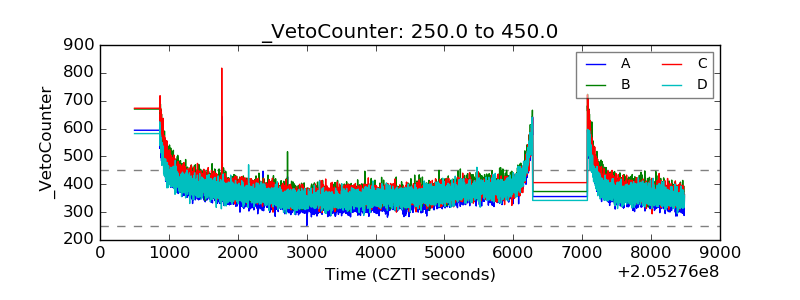 |