| Param | Original file | Final file |
|---|---|---|
| Filename | modeM0/AS1G05_240T01_9000000536_04143cztM0_level2.evt | modeM0/AS1G05_240T01_9000000536_04143cztM0_level2_quad_clean.evt |
| Size (bytes) | 474,727,680 | 75,801,600 |
| Size | 452.7 MB | 72.3 MB |
| Events in quadrant A | 3,347,789 | 454,578 |
| Events in quadrant B | 3,684,553 | 453,918 |
| Events in quadrant C | 3,268,201 | 446,947 |
| Events in quadrant D | 3,580,670 | 431,801 |
| Mode SS | |||
|---|---|---|---|
| Quadrant | BADHDUFLAG | Total packets | Discarded packets |
| A | 0 | 148 | 0 |
| B | 0 | 148 | 0 |
| C | 0 | 148 | 0 |
| D | 0 | 148 | 0 |
| Mode M9 | |||
|---|---|---|---|
| Quadrant | BADHDUFLAG | Total packets | Discarded packets |
| A | 0 | 9 | 0 |
| B | 0 | 9 | 0 |
| C | 0 | 9 | 0 |
| D | 0 | 10 | 0 |
| Mode M0 | |||
|---|---|---|---|
| Quadrant | BADHDUFLAG | Total packets | Discarded packets |
| A | 0 | 15129 | 3 |
| B | 0 | 15832 | 2 |
| C | 0 | 14939 | 2 |
| D | 0 | 16009 | 2 |
| Quadrant | Total seconds | Saturated seconds | Saturation percentage |
|---|---|---|---|
| A | 7296 | 68 | 0.932018% |
| B | 7296 | 91 | 1.247259% |
| C | 7296 | 37 | 0.507127% |
| D | 7296 | 83 | 1.137610% |
Noise dominated data is calculated using 1-second bins in cleaned event files. If a bin has >2000 counts, and if more than 50% of those come from <1% of pixels, then it is considered to be noise-dominated and hence unusable.
| Quadrant | # 1 sec bins | Bins with >0 counts | Bins with >2000 counts | High rate bins dominated by noise | Noise dominated (total time) | Noise dominated (detector-on time) | Marked lightcurve |
|---|---|---|---|---|---|---|---|
| A | 7726 | 7296 | 3 | 3 | 0.04% | 0.04% | 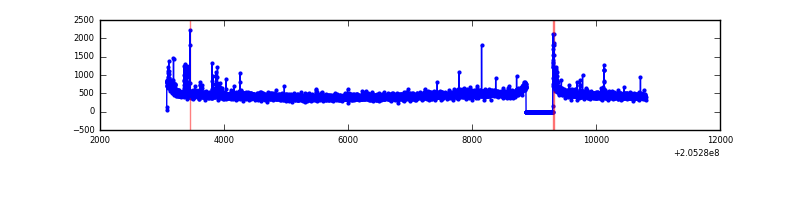 |
| B | 7726 | 7297 | 19 | 19 | 0.25% | 0.26% | 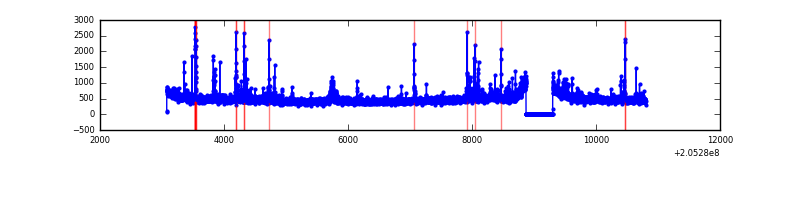 |
| C | 7726 | 7296 | 0 | 0 | 0.00% | 0.00% | 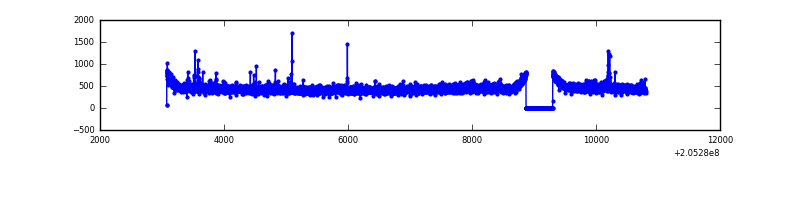 |
| D | 7726 | 7296 | 72 | 72 | 0.93% | 0.99% |  |
Top three noisy pixels from each quadrant. If the there are fewer than three noisy pixels in the level2.evt file, extra rows are filled as -1
| Pixel properties | Quadrant properties | ||||||
|---|---|---|---|---|---|---|---|
| Quadrant | DetID | PixID | Counts | Sigma | Mean | Median | Sigma |
| A | 0 | 118 | 47542 | 271.3 | 841 | 822 | 172.2 |
| A | 15 | 234 | 20299 | 113.1 | 841 | 822 | 172.2 |
| A | 0 | 226 | 13848 | 75.64 | 841 | 822 | 172.2 |
| B | 10 | 16 | 183196 | 1105.88 | 852 | 832 | 164.9 |
| B | 14 | 167 | 110619 | 665.76 | 852 | 832 | 164.9 |
| B | 4 | 81 | 38832 | 230.44 | 852 | 832 | 164.9 |
| C | 10 | 65 | 43726 | 223.26 | 821 | 824 | 192.2 |
| C | 12 | 4 | 15645 | 77.13 | 821 | 824 | 192.2 |
| C | 13 | 61 | 6872 | 31.47 | 821 | 824 | 192.2 |
| D | 2 | 232 | 286751 | 1449.02 | 813 | 787 | 197.4 |
| D | 12 | 233 | 70063 | 351.03 | 813 | 787 | 197.4 |
| D | 10 | 172 | 55191 | 275.67 | 813 | 787 | 197.4 |
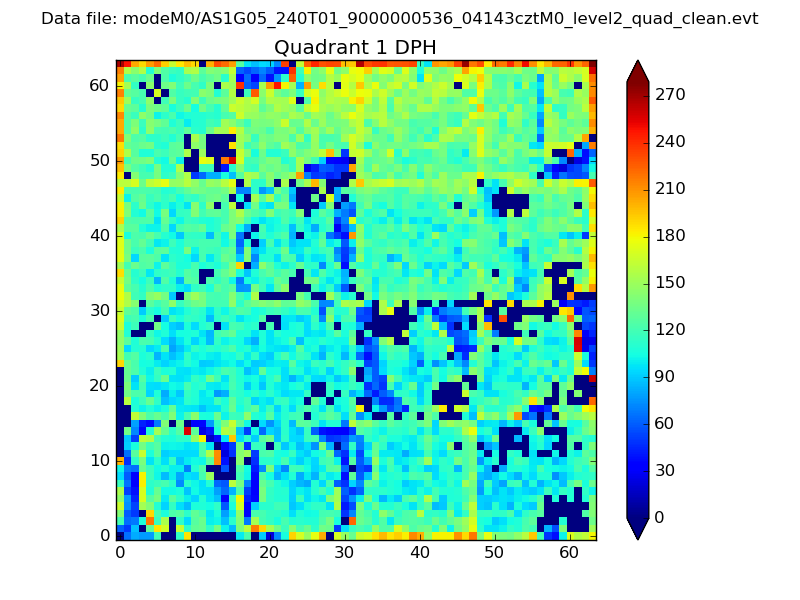
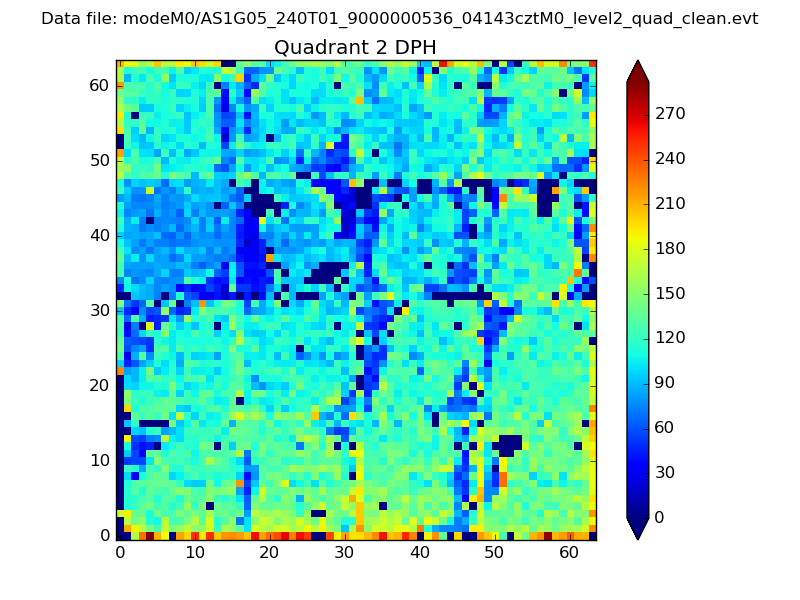
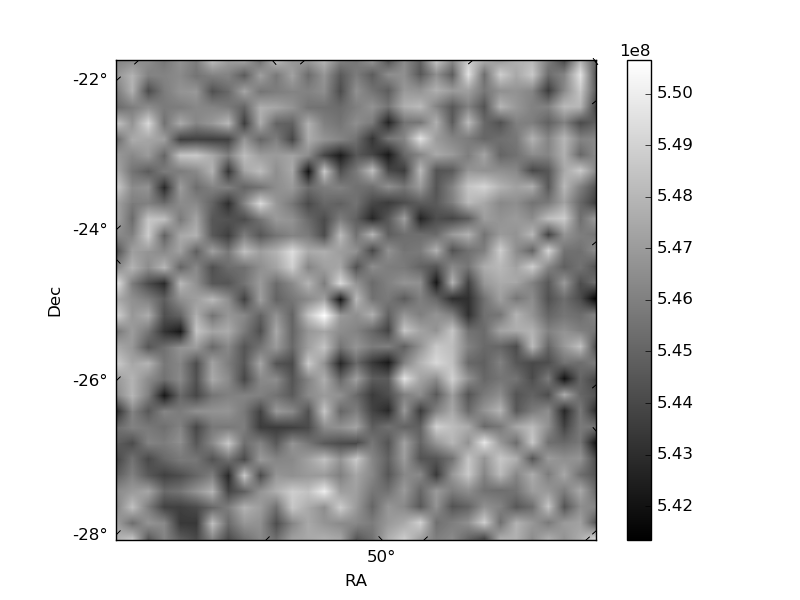
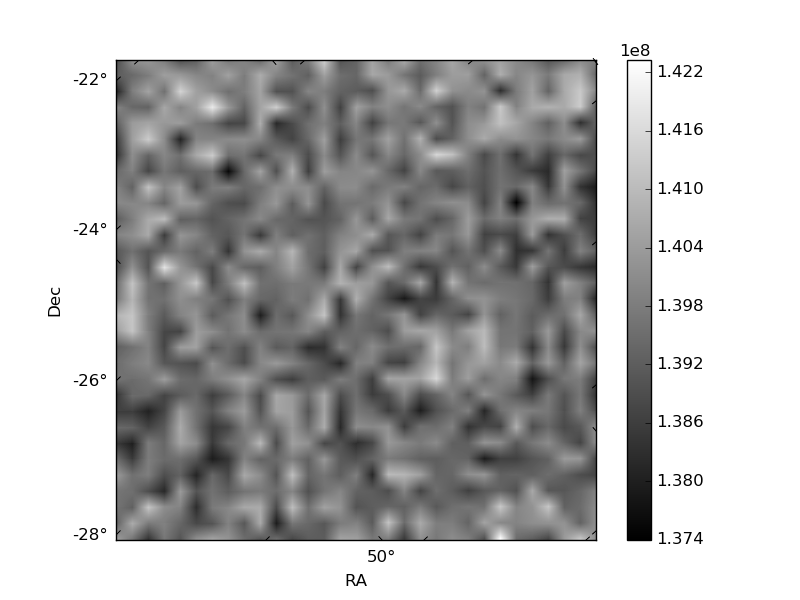
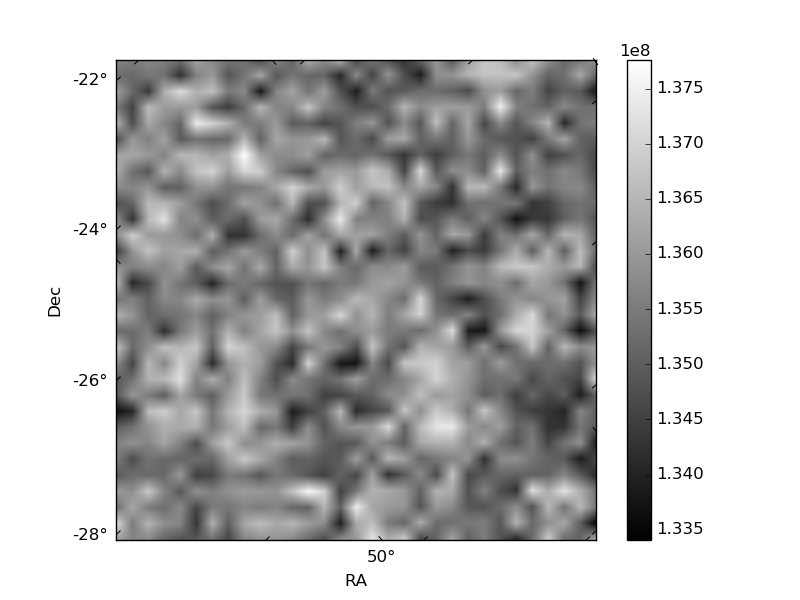
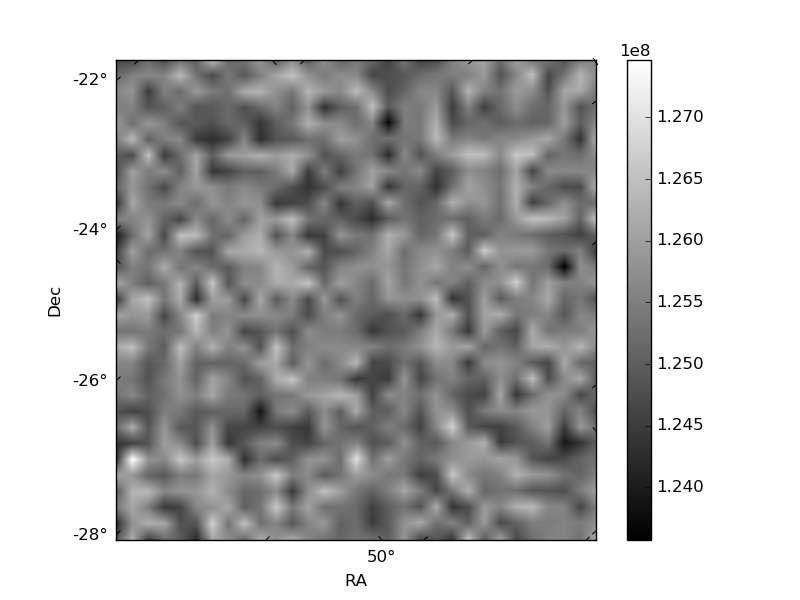
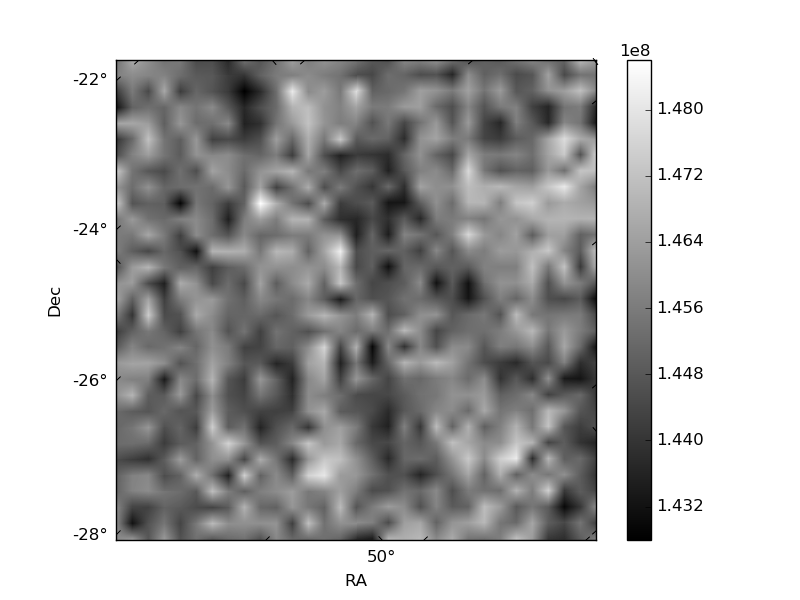
Histogram calculated using DETX and DETY for each event in the final _common_clean file
| Quadrant A | 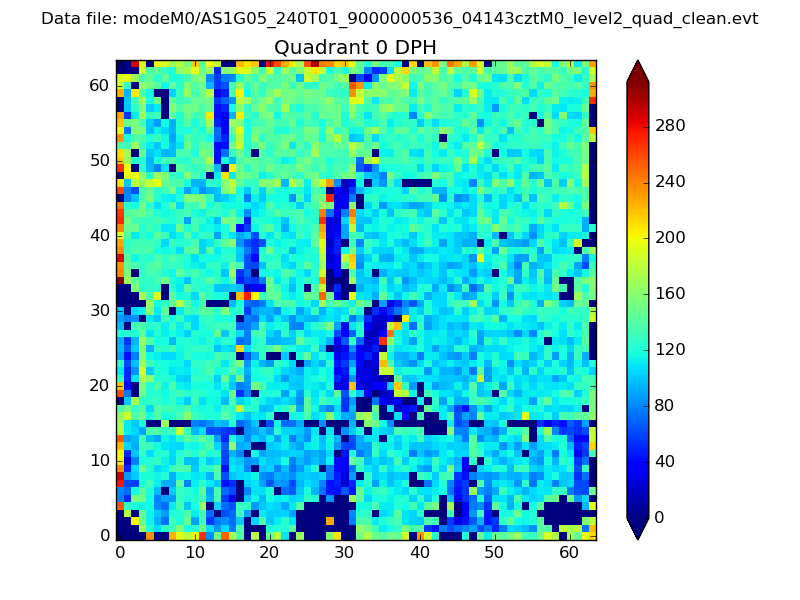 |
 |
Quadrant B |
|---|---|---|---|
| Quadrant D | 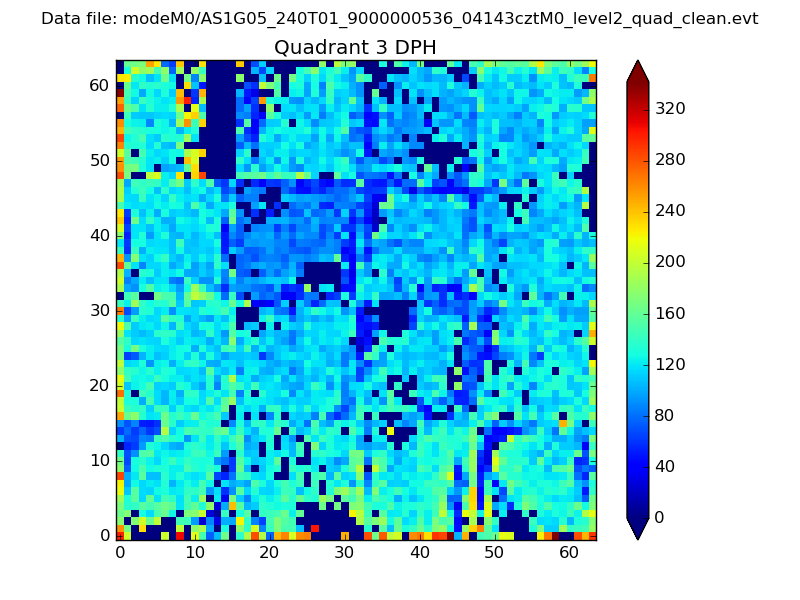 |
 |
Quadrant C |
| Plot type | Count rate plots | Images |
|---|---|---|
| Comparison with Poisson distribution Blue bars denote a histogram of data divided into 1 sec bins. Red curve is a Poisson curve with rate = median count rate of data. |
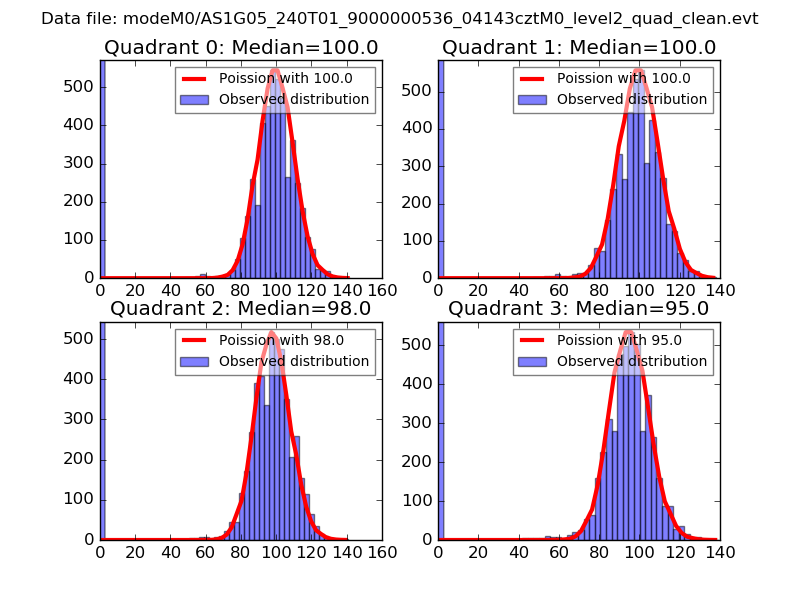 |
 |
| Quadrant-wise count rates Data is divided into 100 sec bins |
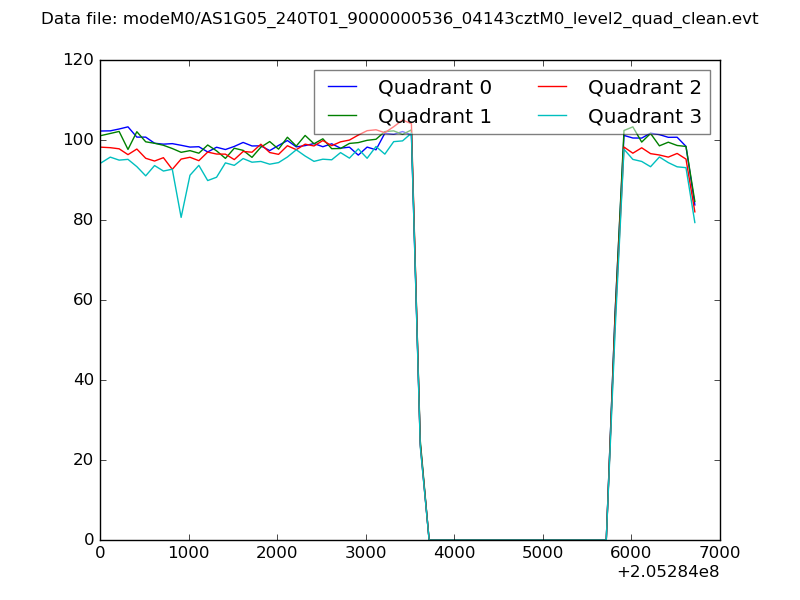 |
|
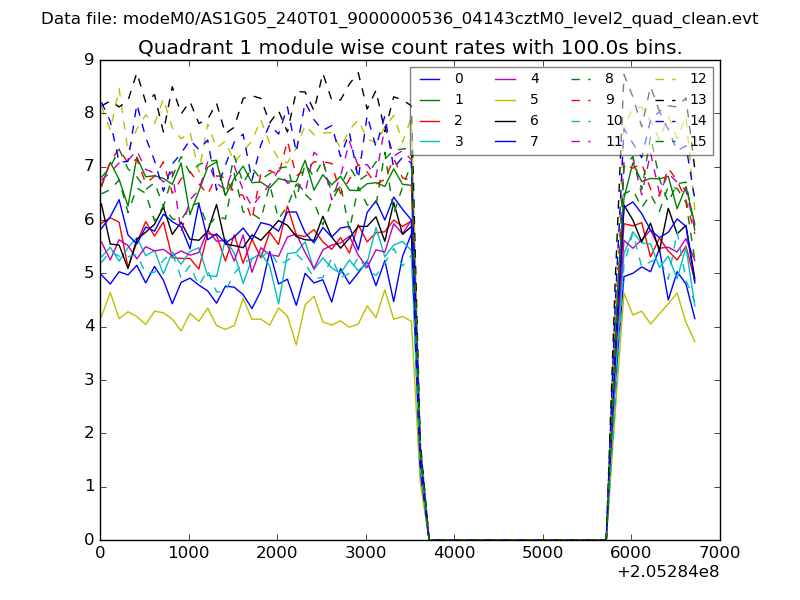
| Module-wise count rates for Quadrant A Data is divided into 100 sec bins |
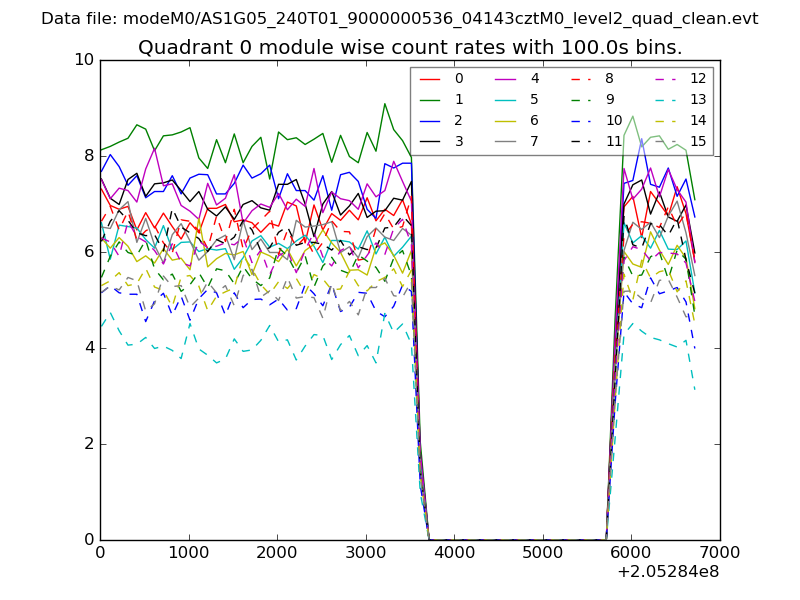 |
 |
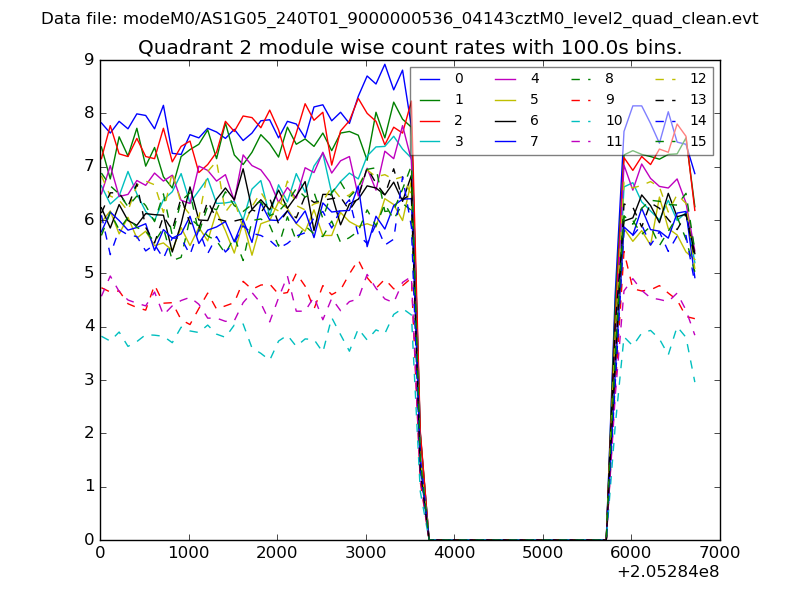
| Module-wise count rates for Quadrant B Data is divided into 100 sec bins |
 |
 |
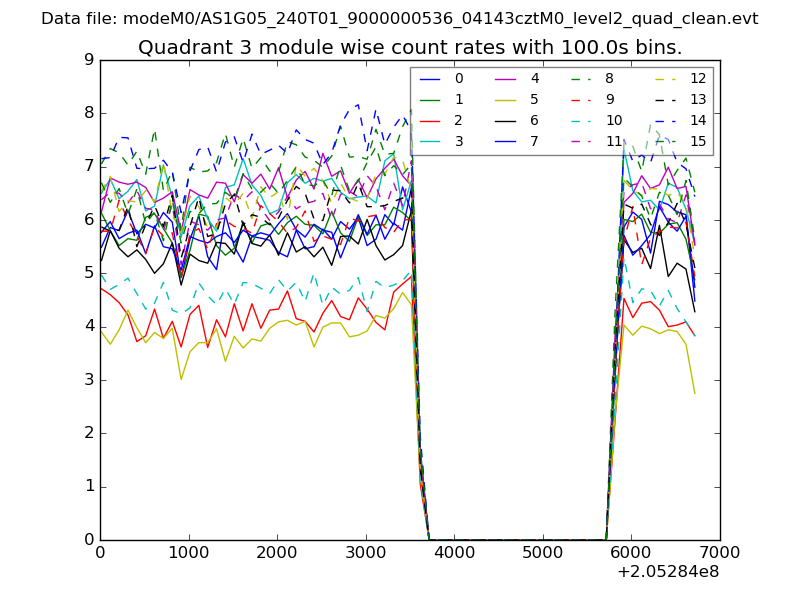
| Module-wise count rates for Quadrant C Data is divided into 100 sec bins |
 |
 |
| Module-wise count rates for Quadrant D Data is divided into 100 sec bins |
 |
 |
| Parameter | Plot |
|---|---|
| CZT HV Monitor | 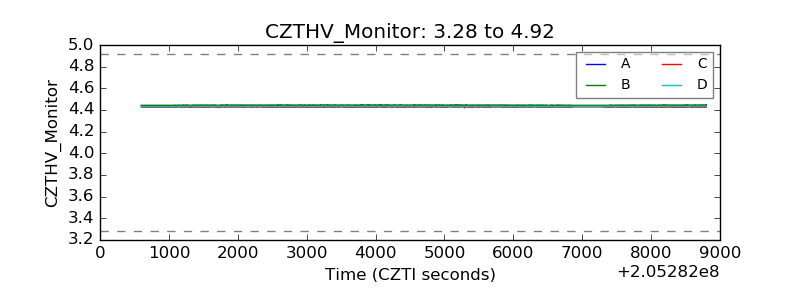 |
| D_VDD | 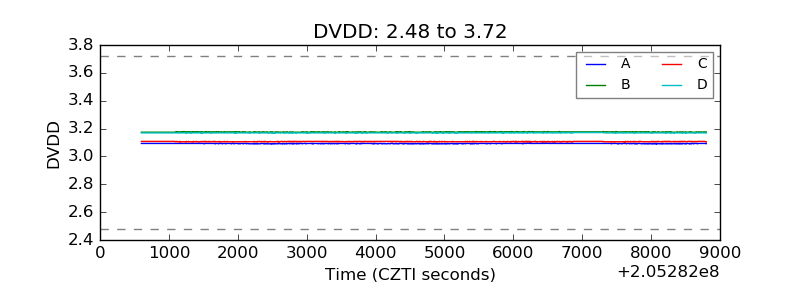 |
| Temperature 1 | 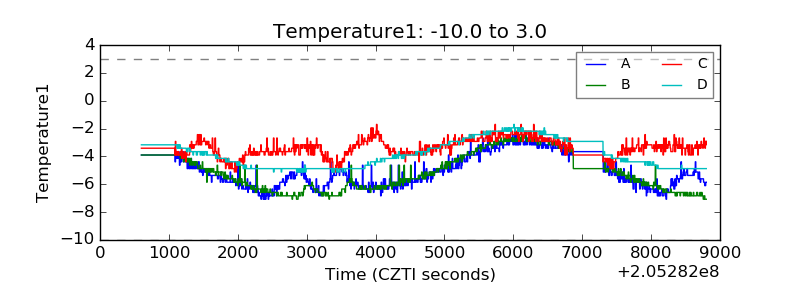 |
| Veto HV Monitor | 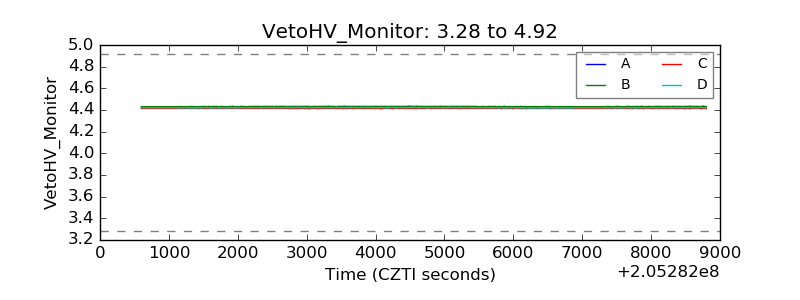 |
| Veto LLD | 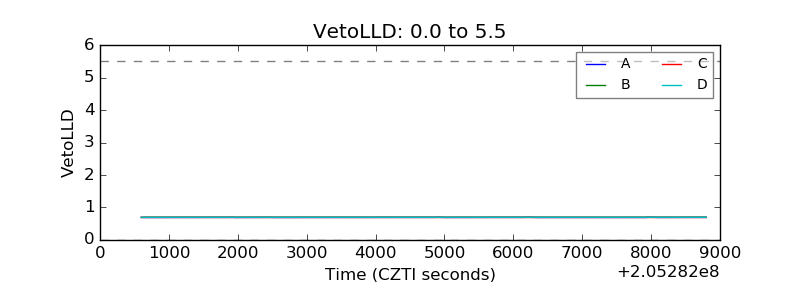 |
| Alpha Counter | 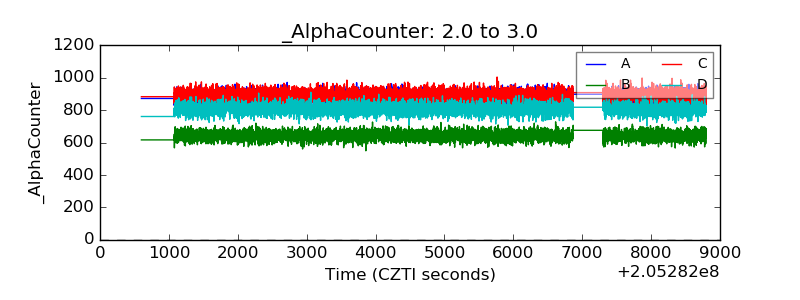 |
| _CPM_Rate | 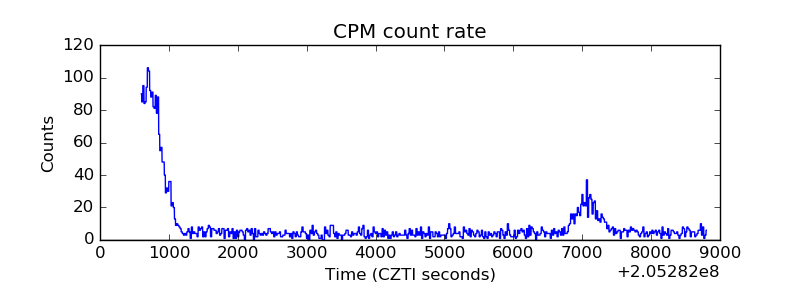 |
| CZT Counter | 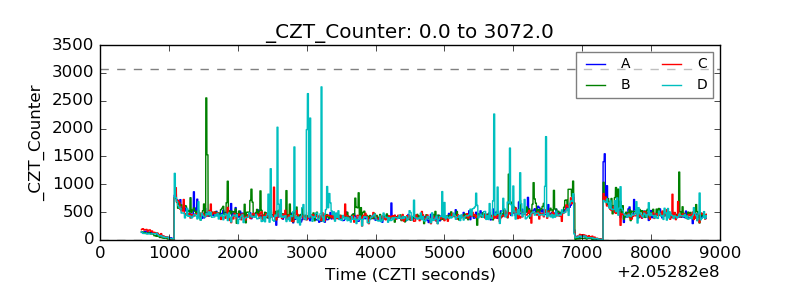 |
| +2.5 Volts monitor |  |
| +5 Volts monitor |  |
| _ROLL_ROT | 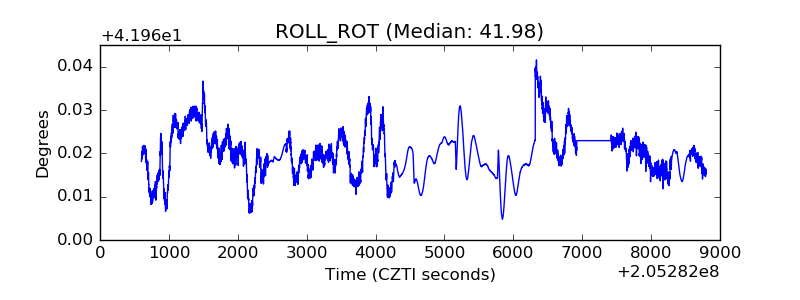 |
| _Roll_DEC | 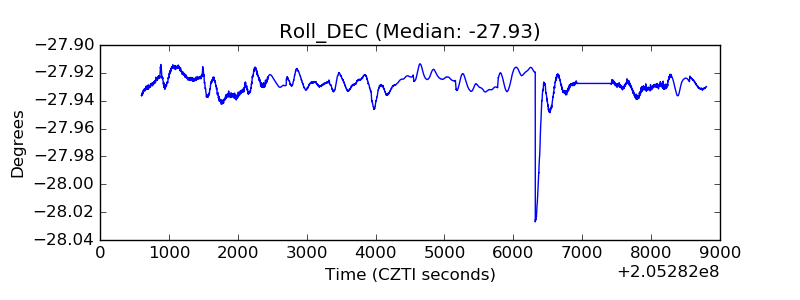 |
| _Roll_RA | 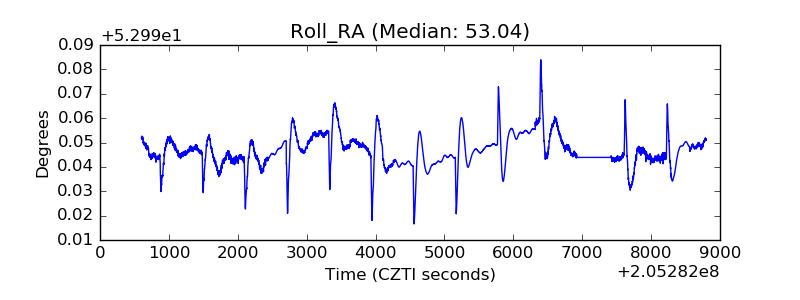 |
| Veto Counter | 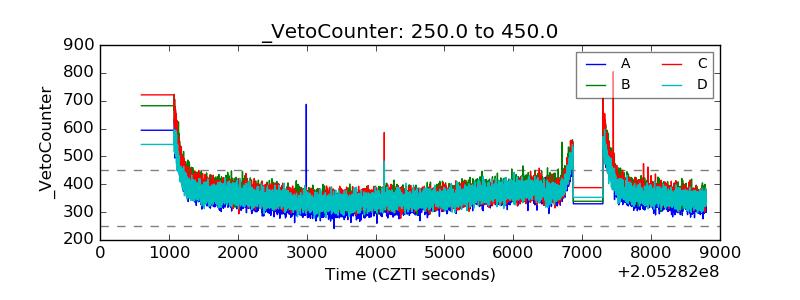 |