| Param | Original file | Final file |
|---|---|---|
| Filename | modeM0/AS1G05_240T01_9000000536_04144cztM0_level2.evt | modeM0/AS1G05_240T01_9000000536_04144cztM0_level2_quad_clean.evt |
| Size (bytes) | 498,660,480 | 82,123,200 |
| Size | 475.6 MB | 78.3 MB |
| Events in quadrant A | 3,514,850 | 498,270 |
| Events in quadrant B | 3,900,142 | 497,014 |
| Events in quadrant C | 3,469,025 | 489,605 |
| Events in quadrant D | 3,700,892 | 472,592 |
| Mode SS | |||
|---|---|---|---|
| Quadrant | BADHDUFLAG | Total packets | Discarded packets |
| A | 0 | 154 | 0 |
| B | 0 | 154 | 0 |
| C | 0 | 154 | 0 |
| D | 0 | 154 | 0 |
| Mode M9 | |||
|---|---|---|---|
| Quadrant | BADHDUFLAG | Total packets | Discarded packets |
| A | 0 | 1 | 0 |
| B | 0 | 1 | 0 |
| C | 0 | 1 | 0 |
| D | 0 | 1 | 0 |
| Mode M0 | |||
|---|---|---|---|
| Quadrant | BADHDUFLAG | Total packets | Discarded packets |
| A | 0 | 15759 | 2 |
| B | 0 | 16637 | 1 |
| C | 0 | 15741 | 1 |
| D | 0 | 16577 | 1 |
| Quadrant | Total seconds | Saturated seconds | Saturation percentage |
|---|---|---|---|
| A | 7608 | 80 | 1.051525% |
| B | 7608 | 134 | 1.761304% |
| C | 7608 | 82 | 1.077813% |
| D | 7608 | 122 | 1.603575% |
Noise dominated data is calculated using 1-second bins in cleaned event files. If a bin has >2000 counts, and if more than 50% of those come from <1% of pixels, then it is considered to be noise-dominated and hence unusable.
| Quadrant | # 1 sec bins | Bins with >0 counts | Bins with >2000 counts | High rate bins dominated by noise | Noise dominated (total time) | Noise dominated (detector-on time) | Marked lightcurve |
|---|---|---|---|---|---|---|---|
| A | 7703 | 7609 | 0 | 0 | 0.00% | 0.00% | 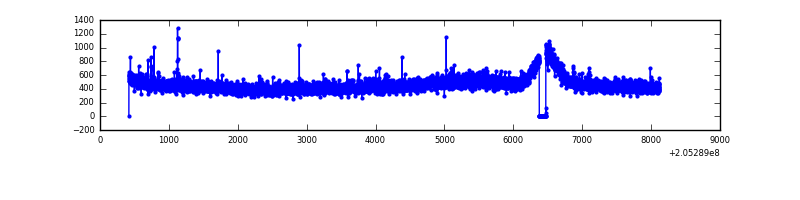 |
| B | 7703 | 7609 | 20 | 20 | 0.26% | 0.26% | 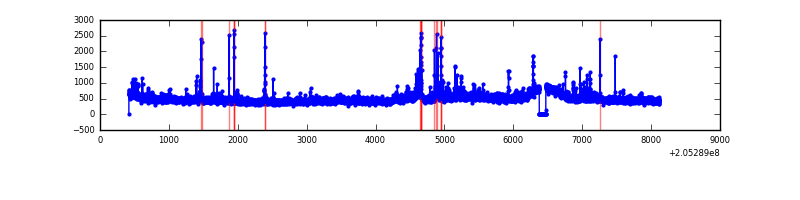 |
| C | 7703 | 7609 | 2 | 2 | 0.03% | 0.03% | 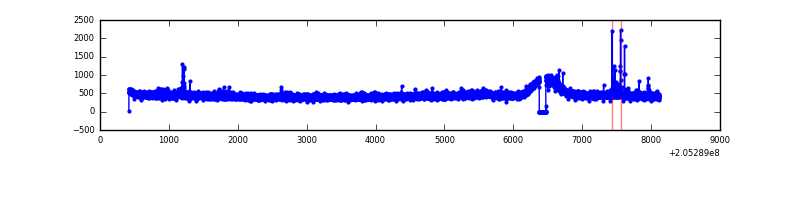 |
| D | 7703 | 7609 | 51 | 51 | 0.66% | 0.67% | 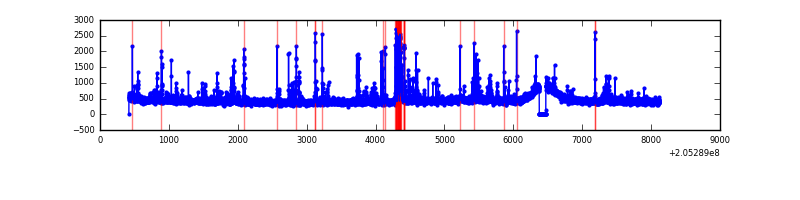 |
Top three noisy pixels from each quadrant. If the there are fewer than three noisy pixels in the level2.evt file, extra rows are filled as -1
| Pixel properties | Quadrant properties | ||||||
|---|---|---|---|---|---|---|---|
| Quadrant | DetID | PixID | Counts | Sigma | Mean | Median | Sigma |
| A | 3 | 1 | 56522 | 303.33 | 889 | 866 | 183.5 |
| A | 15 | 234 | 14703 | 75.41 | 889 | 866 | 183.5 |
| A | 0 | 50 | 10122 | 50.45 | 889 | 866 | 183.5 |
| B | 14 | 167 | 172206 | 975.58 | 900 | 878 | 175.6 |
| B | 10 | 16 | 145105 | 821.26 | 900 | 878 | 175.6 |
| B | 15 | 204 | 33116 | 183.57 | 900 | 878 | 175.6 |
| C | 10 | 65 | 45770 | 219.3 | 870 | 871 | 204.7 |
| C | 12 | 4 | 14140 | 64.81 | 870 | 871 | 204.7 |
| C | 13 | 61 | 7138 | 30.61 | 870 | 871 | 204.7 |
| D | 2 | 232 | 290370 | 1362.28 | 862 | 833 | 212.5 |
| D | 12 | 233 | 38687 | 178.1 | 862 | 833 | 212.5 |
| D | 13 | 239 | 34035 | 156.22 | 862 | 833 | 212.5 |
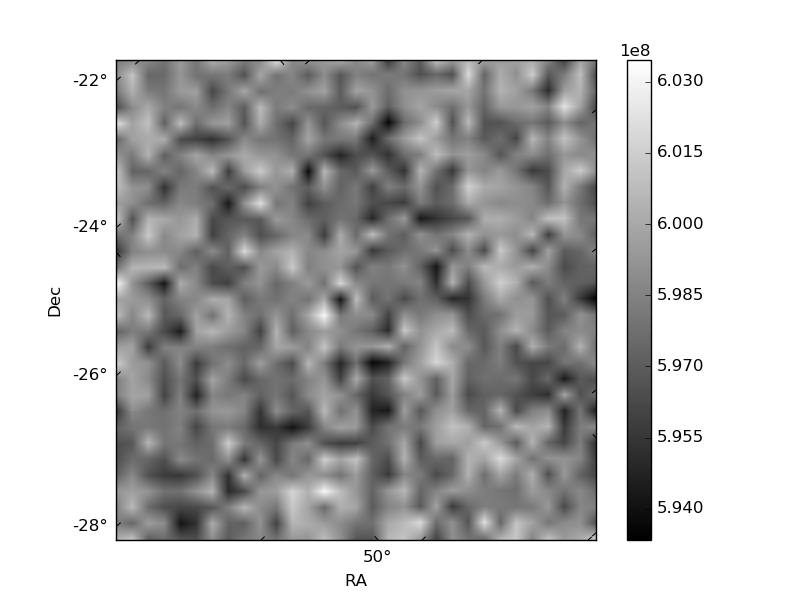
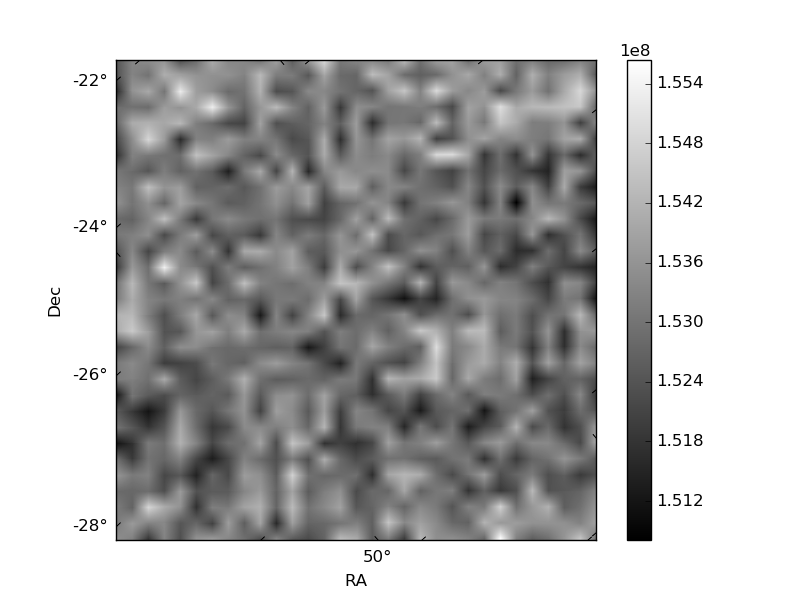
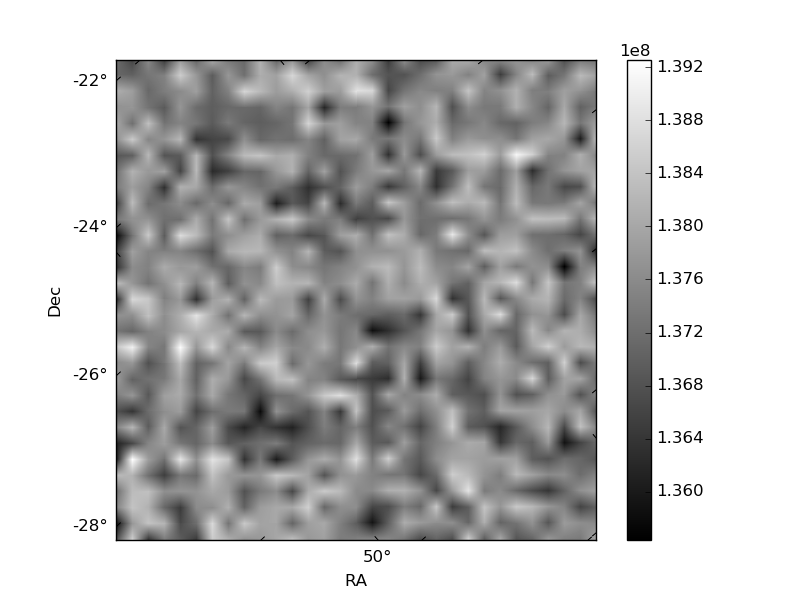
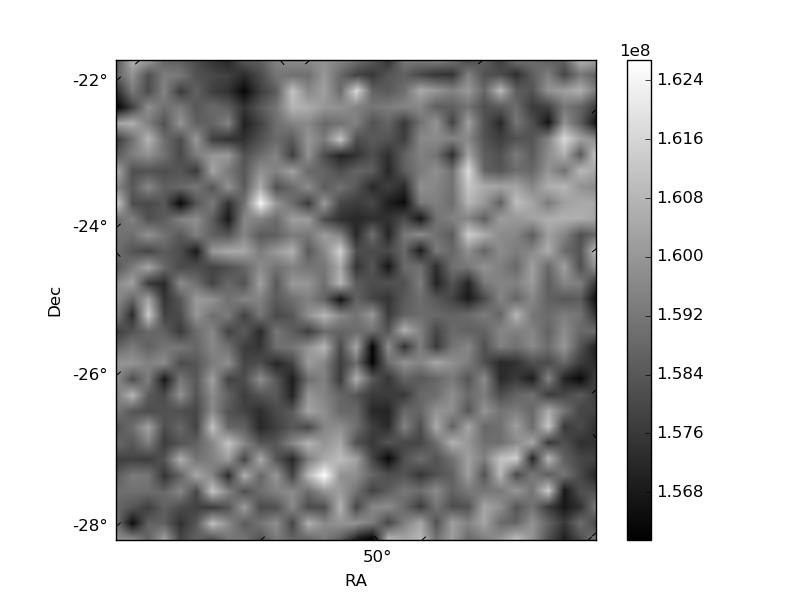
Histogram calculated using DETX and DETY for each event in the final _common_clean file
| Quadrant A | 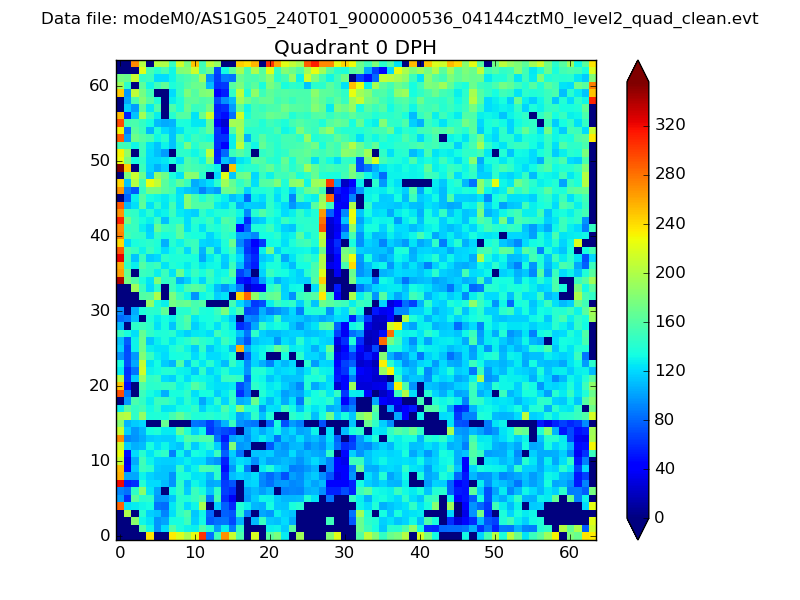 |
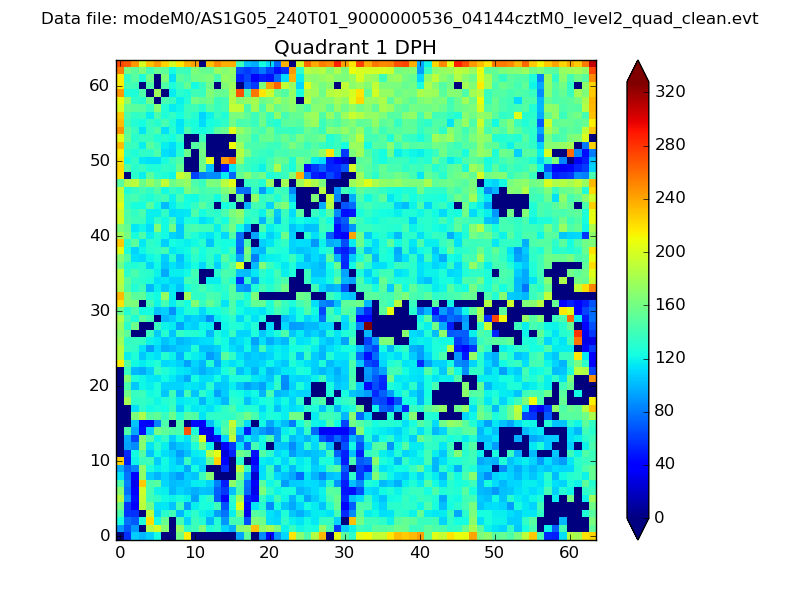 |
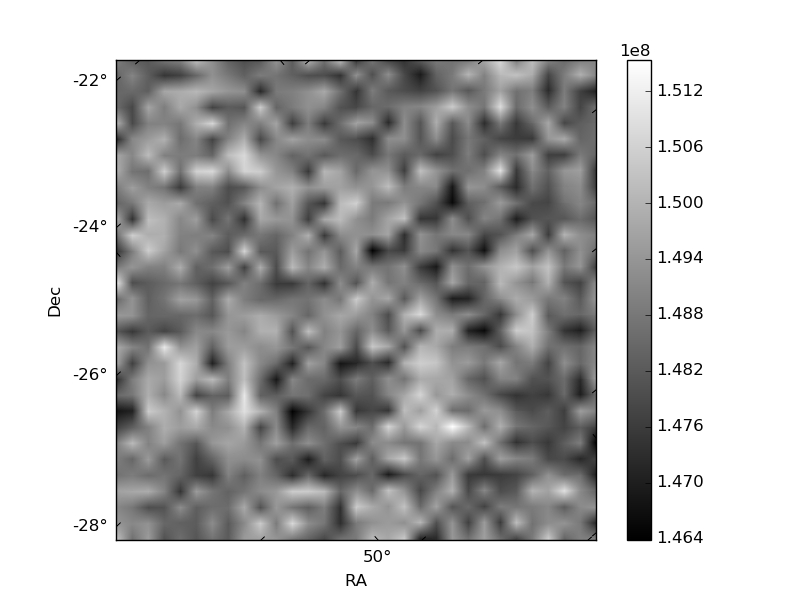
Quadrant B |
|---|---|---|---|
| Quadrant D | 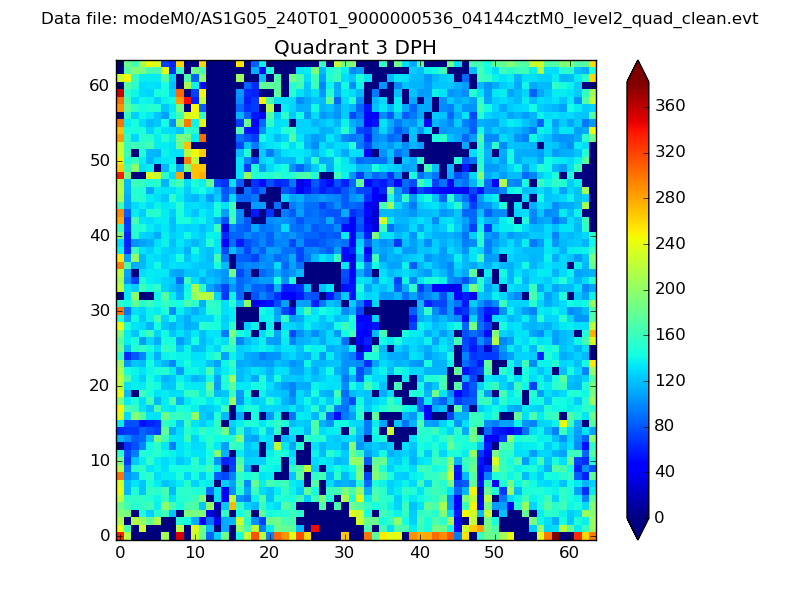 |
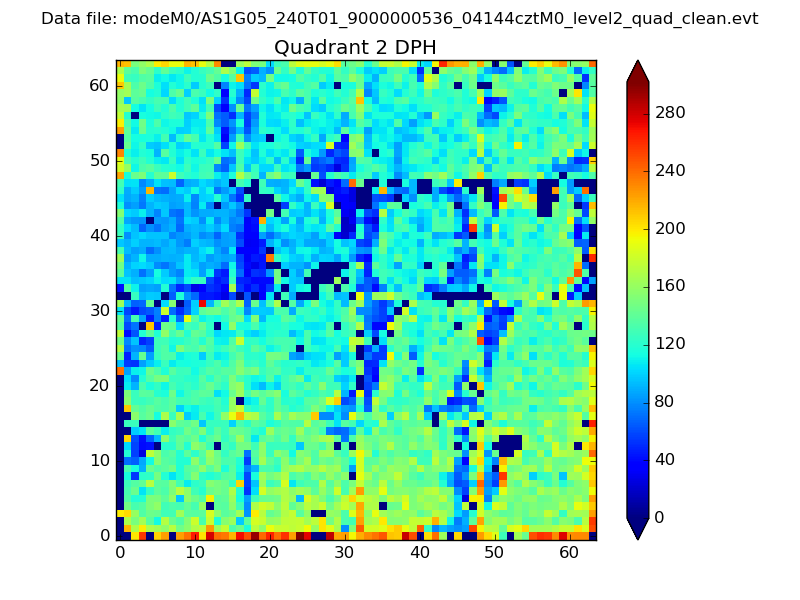 |
Quadrant C |
| Plot type | Count rate plots | Images |
|---|---|---|
| Comparison with Poisson distribution Blue bars denote a histogram of data divided into 1 sec bins. Red curve is a Poisson curve with rate = median count rate of data. |
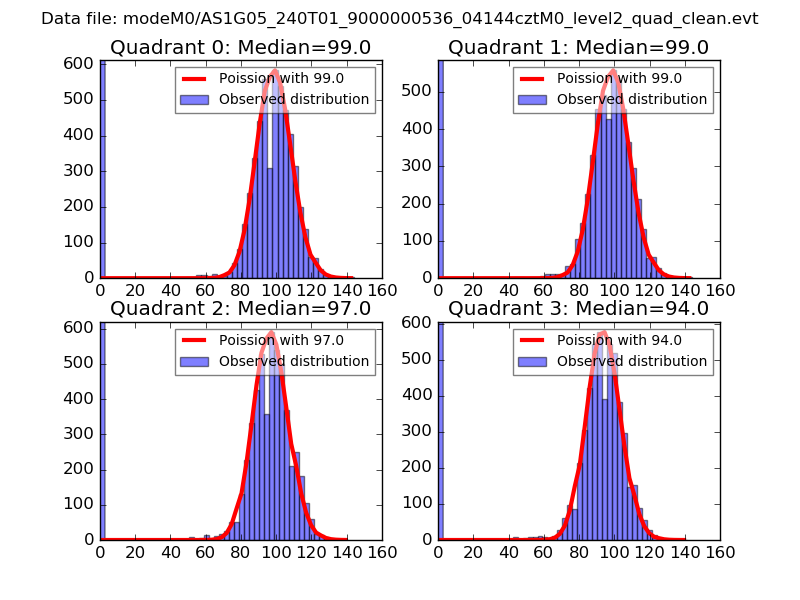 |
 |
| Quadrant-wise count rates Data is divided into 100 sec bins |
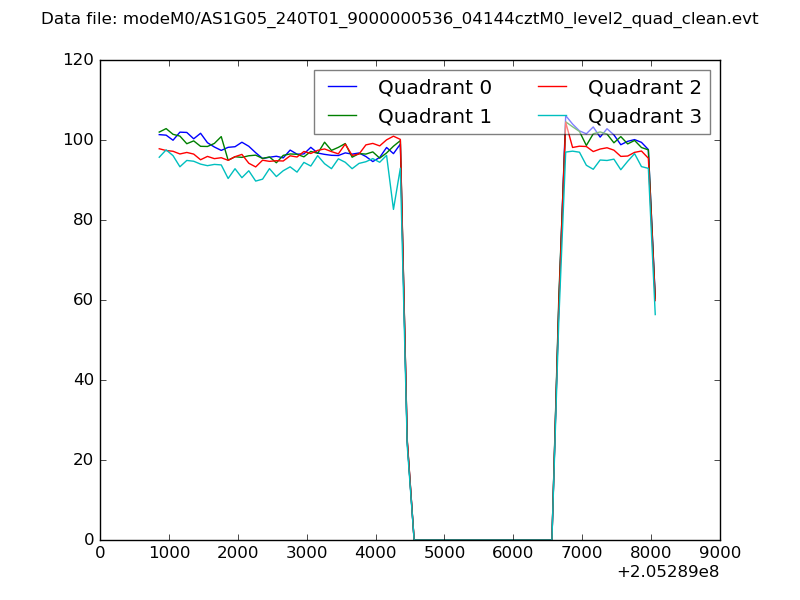 |
|
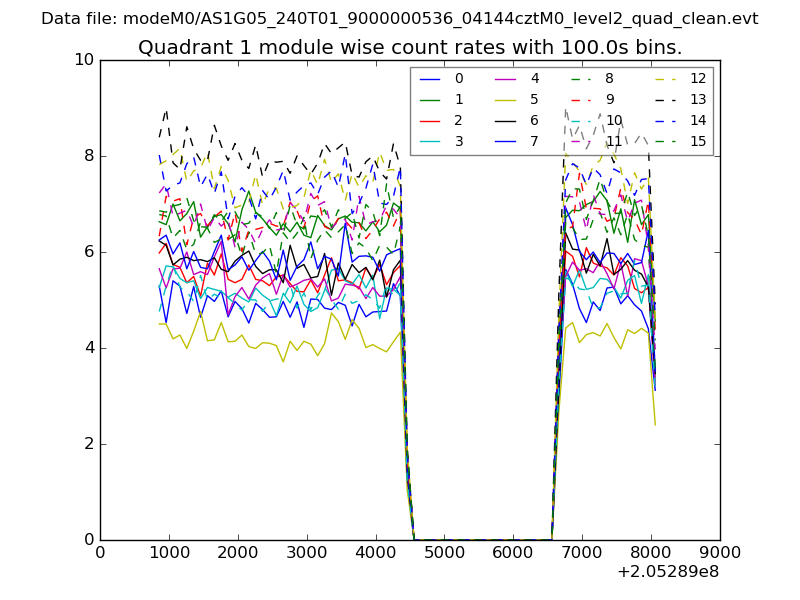
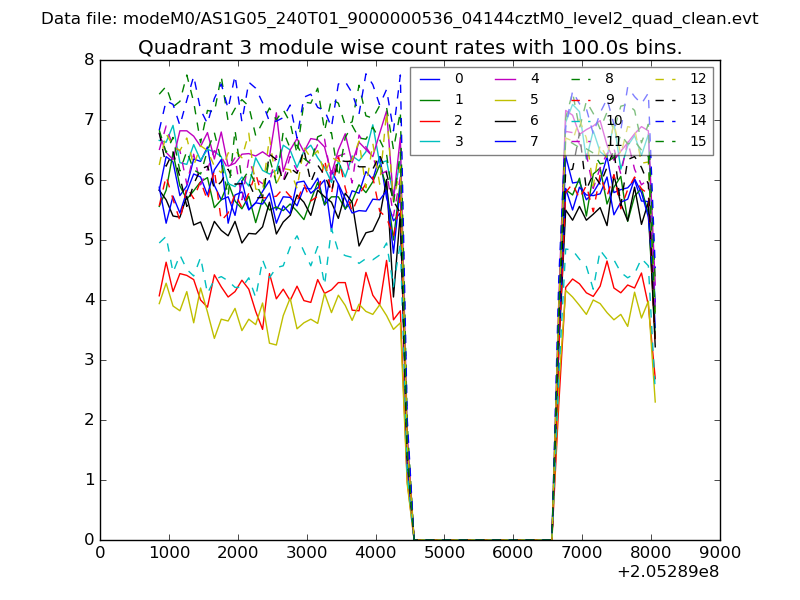
| Module-wise count rates for Quadrant A Data is divided into 100 sec bins |
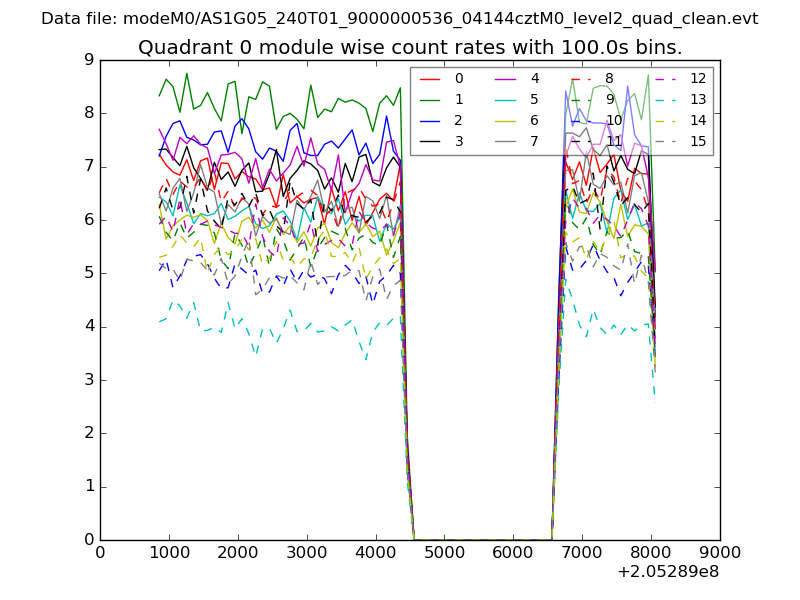 |
 |
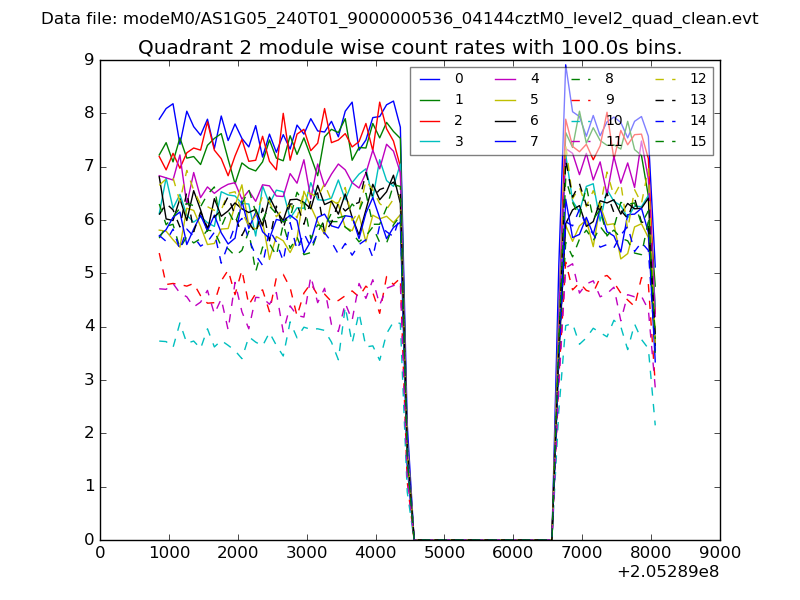
| Module-wise count rates for Quadrant B Data is divided into 100 sec bins |
 |
 |
| Module-wise count rates for Quadrant C Data is divided into 100 sec bins |
 |
 |
| Module-wise count rates for Quadrant D Data is divided into 100 sec bins |
 |
 |
| Parameter | Plot |
|---|---|
| CZT HV Monitor | 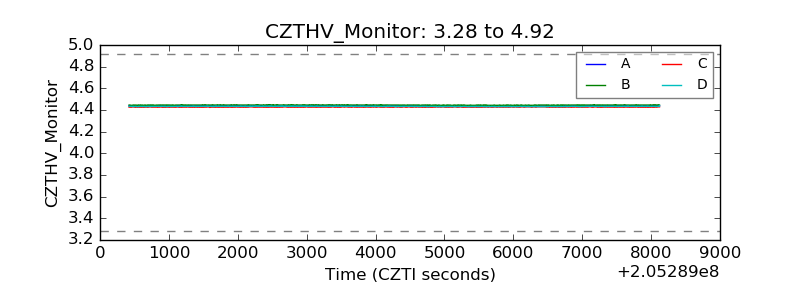 |
| D_VDD | 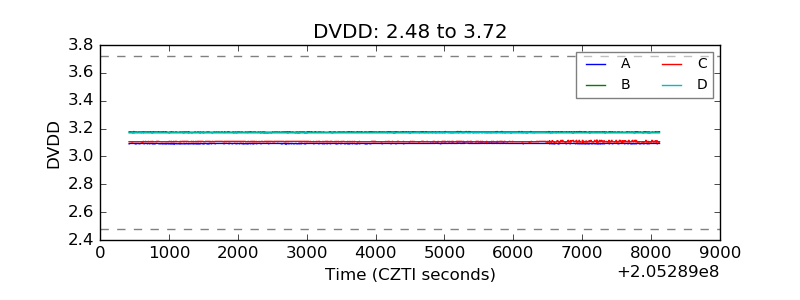 |
| Temperature 1 | 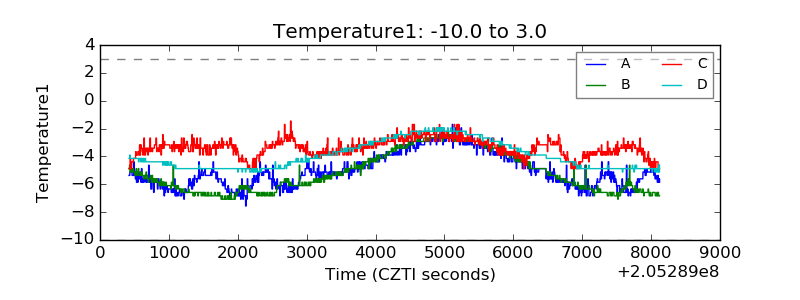 |
| Veto HV Monitor | 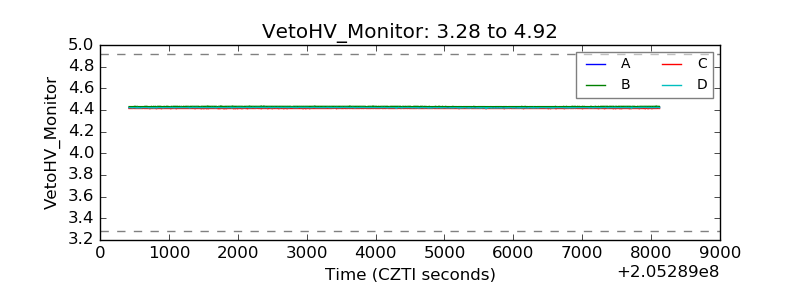 |
| Veto LLD | 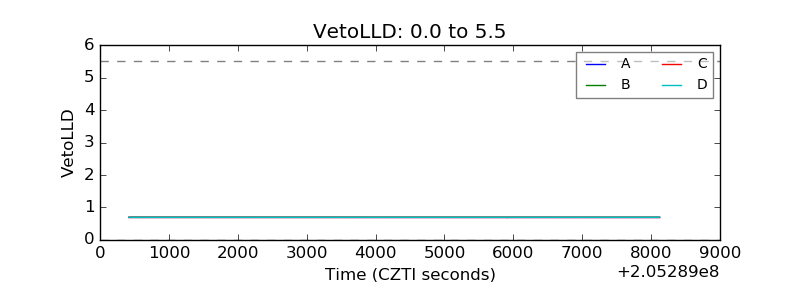 |
| Alpha Counter | 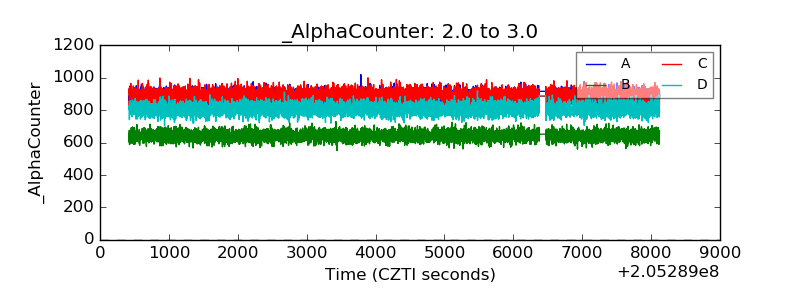 |
| _CPM_Rate | 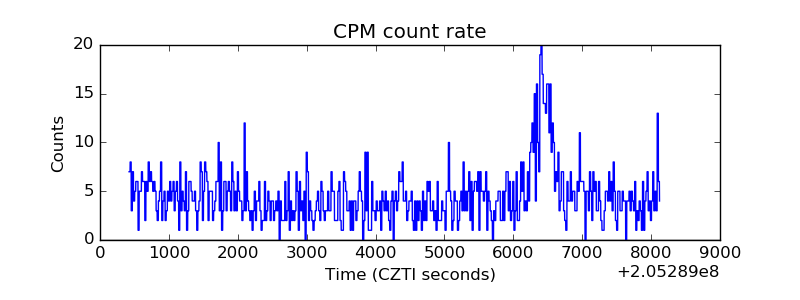 |
| CZT Counter | 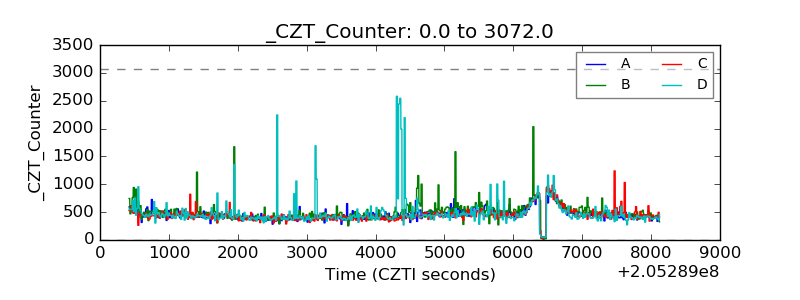 |
| +2.5 Volts monitor |  |
| +5 Volts monitor |  |
| _ROLL_ROT | 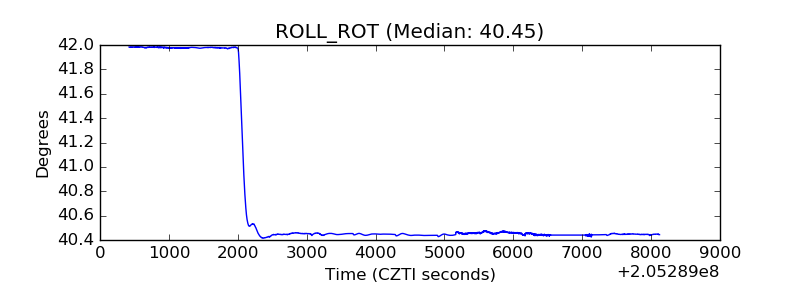 |
| _Roll_DEC | 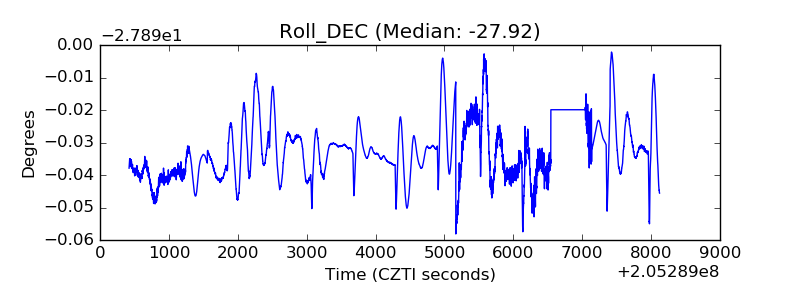 |
| _Roll_RA | 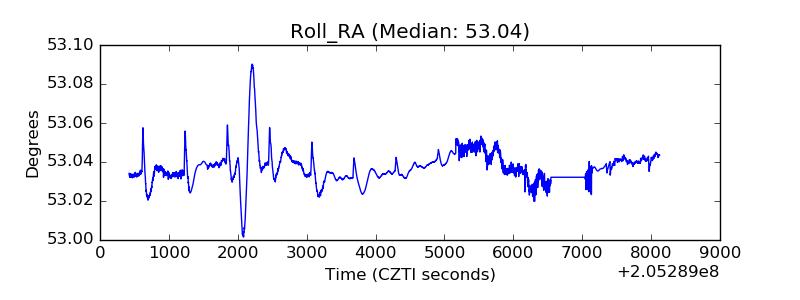 |
| Veto Counter |  |