| Param | Original file | Final file |
|---|---|---|
| Filename | modeM0/AS1G05_240T01_9000000536_04148cztM0_level2.evt | modeM0/AS1G05_240T01_9000000536_04148cztM0_level2_quad_clean.evt |
| Size (bytes) | 1,180,301,760 | 187,456,320 |
| Size | 1.1 GB | 178.8 MB |
| Events in quadrant A | 8,360,309 | 1,122,882 |
| Events in quadrant B | 8,494,564 | 1,125,540 |
| Events in quadrant C | 7,841,984 | 1,122,659 |
| Events in quadrant D | 9,834,086 | 1,068,829 |
| Mode SS | |||
|---|---|---|---|
| Quadrant | BADHDUFLAG | Total packets | Discarded packets |
| A | 0 | 364 | 0 |
| B | 0 | 364 | 0 |
| C | 0 | 364 | 0 |
| D | 0 | 364 | 0 |
| Mode M9 | |||
|---|---|---|---|
| Quadrant | BADHDUFLAG | Total packets | Discarded packets |
| A | 0 | 20 | 0 |
| B | 0 | 20 | 0 |
| C | 0 | 20 | 0 |
| D | 0 | 20 | 0 |
| Mode M0 | |||
|---|---|---|---|
| Quadrant | BADHDUFLAG | Total packets | Discarded packets |
| A | 0 | 37163 | 4 |
| B | 0 | 37220 | 3 |
| C | 0 | 36350 | 3 |
| D | 0 | 42162 | 3 |
| Quadrant | Total seconds | Saturated seconds | Saturation percentage |
|---|---|---|---|
| A | 17951 | 158 | 0.880174% |
| B | 17951 | 148 | 0.824467% |
| C | 17951 | 79 | 0.440087% |
| D | 17951 | 403 | 2.245000% |
Noise dominated data is calculated using 1-second bins in cleaned event files. If a bin has >2000 counts, and if more than 50% of those come from <1% of pixels, then it is considered to be noise-dominated and hence unusable.
| Quadrant | # 1 sec bins | Bins with >0 counts | Bins with >2000 counts | High rate bins dominated by noise | Noise dominated (total time) | Noise dominated (detector-on time) | Marked lightcurve |
|---|---|---|---|---|---|---|---|
| A | 19976 | 17954 | 44 | 44 | 0.22% | 0.25% | 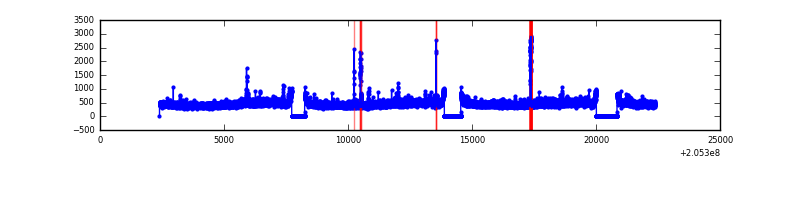 |
| B | 19976 | 17954 | 12 | 12 | 0.06% | 0.07% | 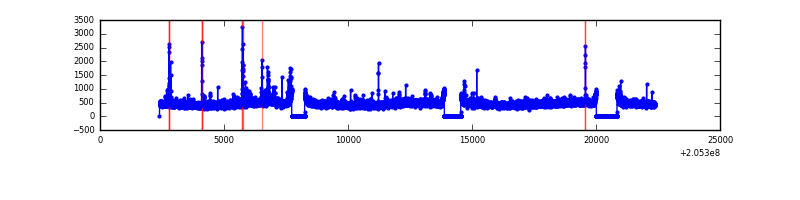 |
| C | 19976 | 17954 | 1 | 1 | 0.01% | 0.01% | 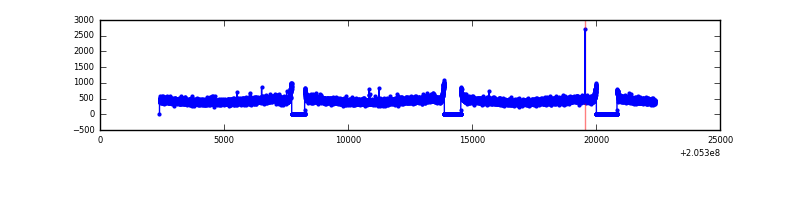 |
| D | 19976 | 17954 | 337 | 337 | 1.69% | 1.88% | 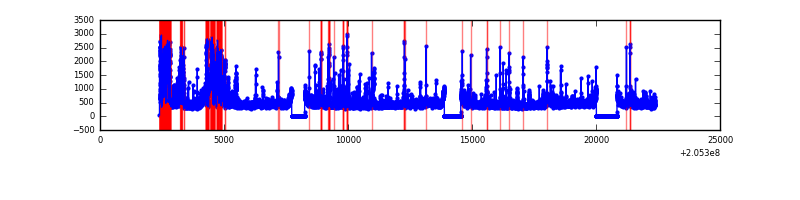 |
Top three noisy pixels from each quadrant. If the there are fewer than three noisy pixels in the level2.evt file, extra rows are filled as -1
| Pixel properties | Quadrant properties | ||||||
|---|---|---|---|---|---|---|---|
| Quadrant | DetID | PixID | Counts | Sigma | Mean | Median | Sigma |
| A | 3 | 1 | 195033 | 459.22 | 2049 | 2003 | 420.3 |
| A | 15 | 174 | 99877 | 232.84 | 2049 | 2003 | 420.3 |
| A | 0 | 118 | 88284 | 205.26 | 2049 | 2003 | 420.3 |
| B | 15 | 204 | 142136 | 350.2 | 2068 | 2018 | 400.1 |
| B | 14 | 167 | 125289 | 308.09 | 2068 | 2018 | 400.1 |
| B | 10 | 16 | 102464 | 251.04 | 2068 | 2018 | 400.1 |
| C | 8 | 128 | 16524 | 31.14 | 1996 | 2002 | 466.3 |
| C | 13 | 61 | 16350 | 30.77 | 1996 | 2002 | 466.3 |
| C | 9 | 144 | 12790 | 23.14 | 1996 | 2002 | 466.3 |
| D | 2 | 232 | 1798607 | 3742.53 | 1985 | 1923 | 480.1 |
| D | 13 | 239 | 154056 | 316.9 | 1985 | 1923 | 480.1 |
| D | 13 | 53 | 117189 | 240.1 | 1985 | 1923 | 480.1 |
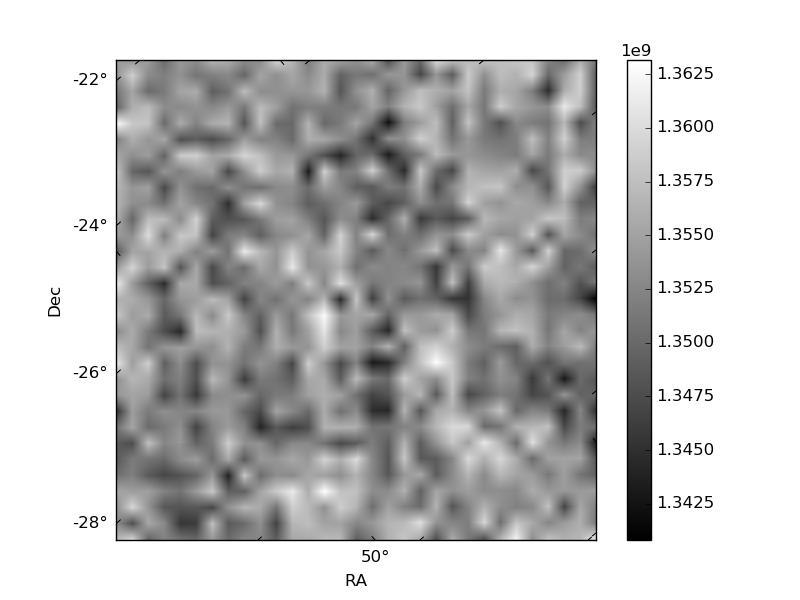
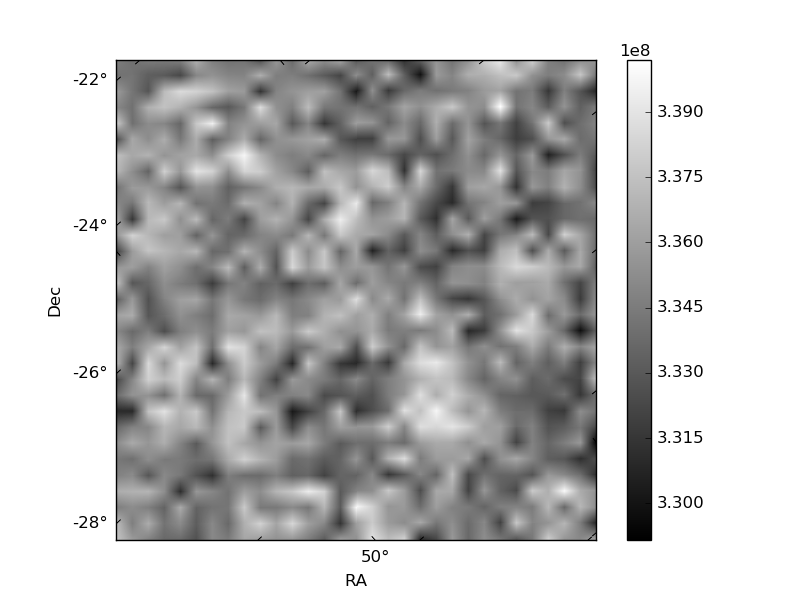
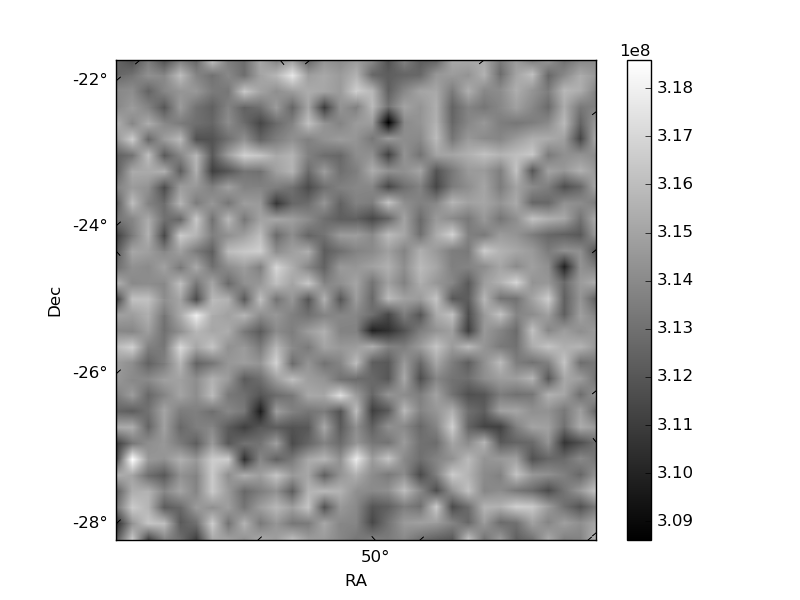
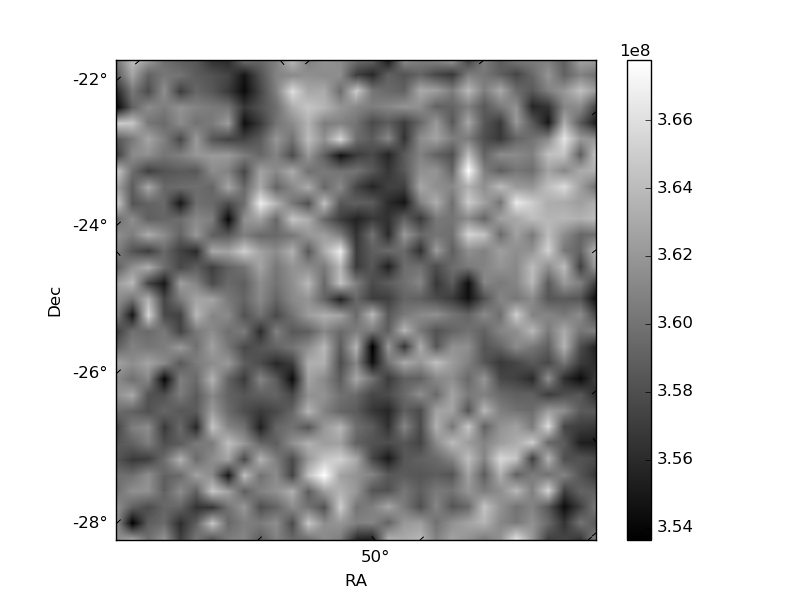
Histogram calculated using DETX and DETY for each event in the final _common_clean file
| Quadrant A | 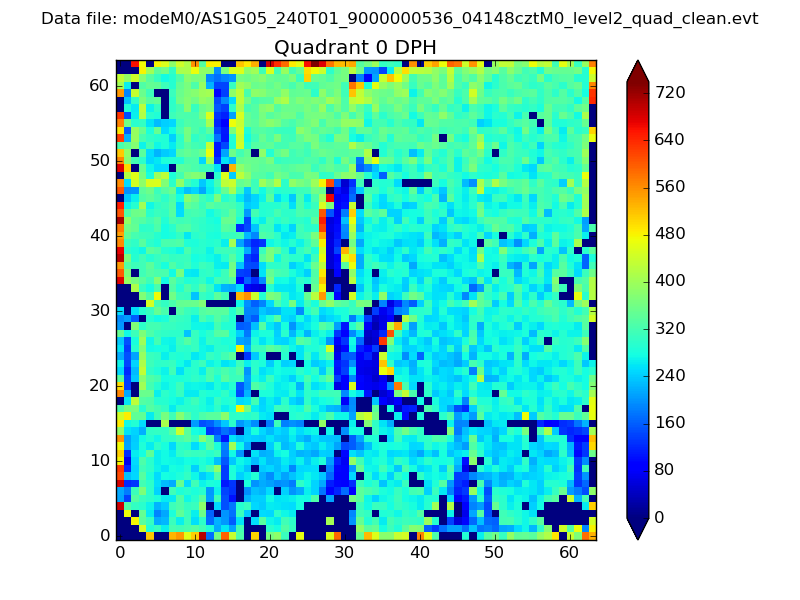 |
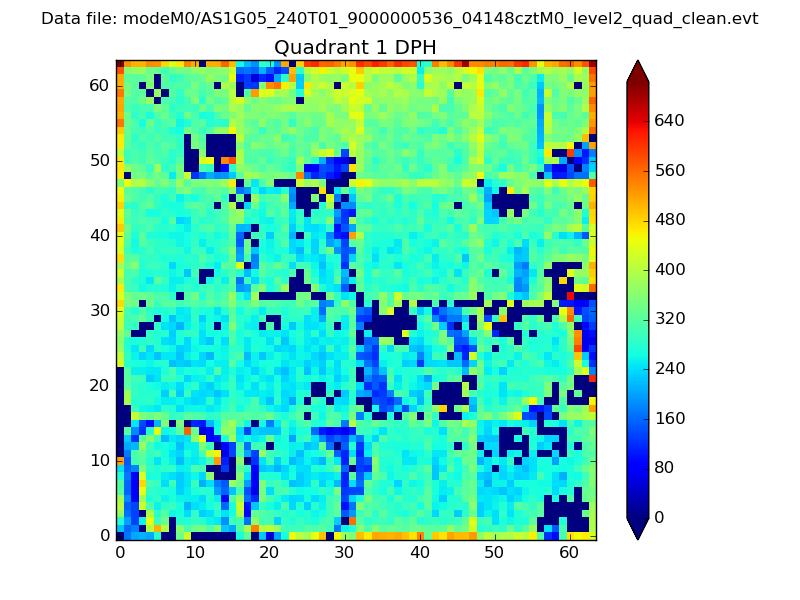 |
Quadrant B |
|---|---|---|---|
| Quadrant D | 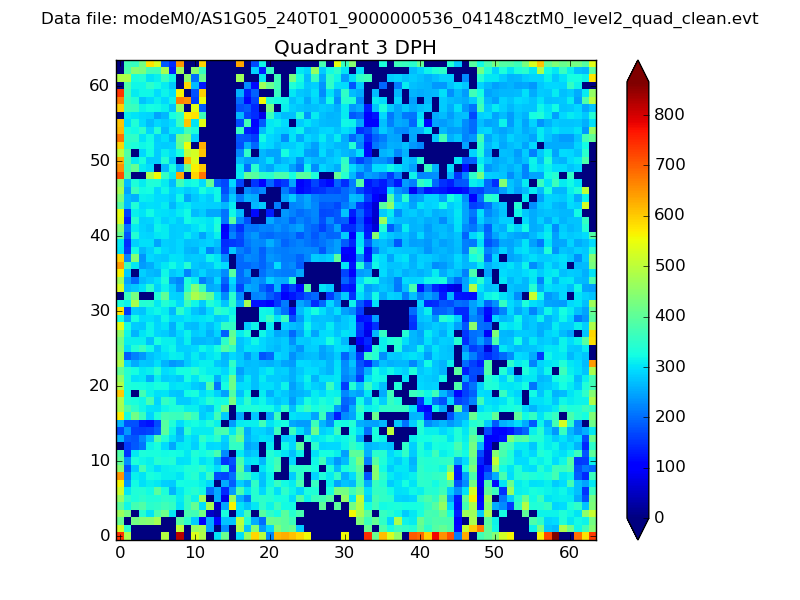 |
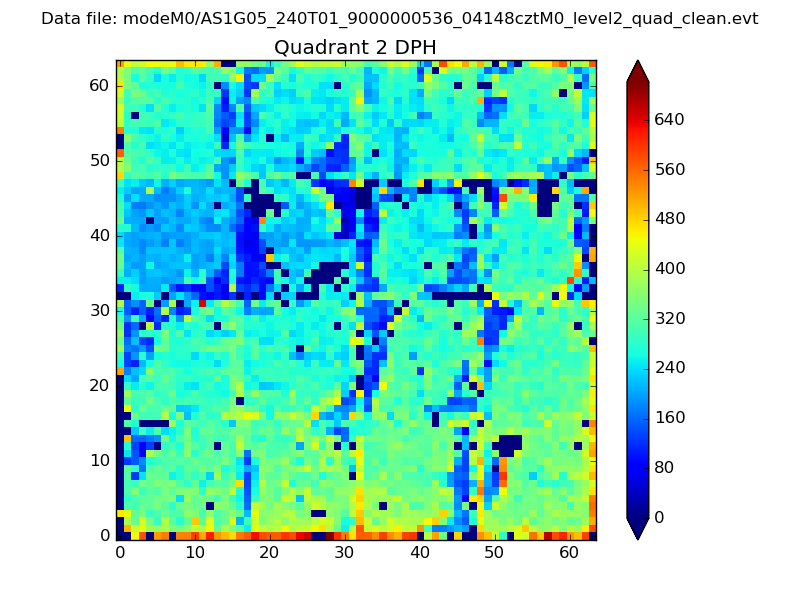 |
Quadrant C |
| Plot type | Count rate plots | Images |
|---|---|---|
| Comparison with Poisson distribution Blue bars denote a histogram of data divided into 1 sec bins. Red curve is a Poisson curve with rate = median count rate of data. |
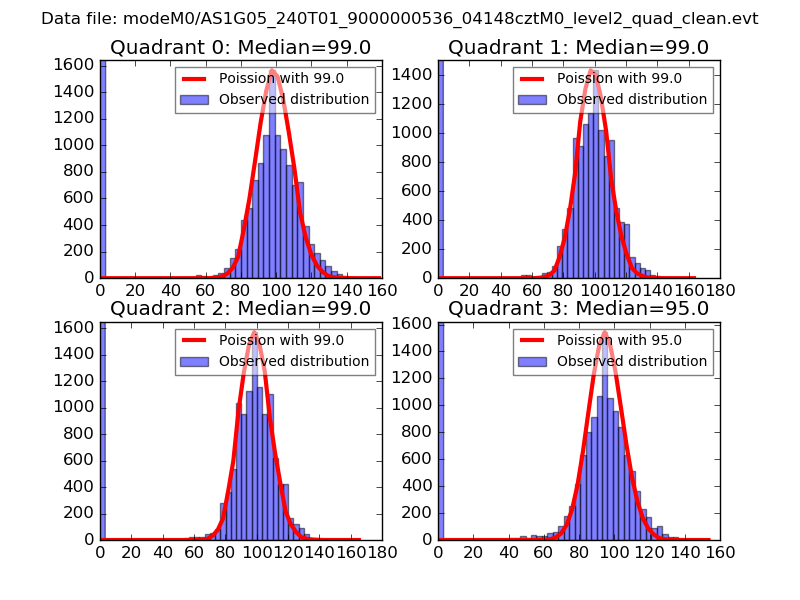 |
 |
| Quadrant-wise count rates Data is divided into 100 sec bins |
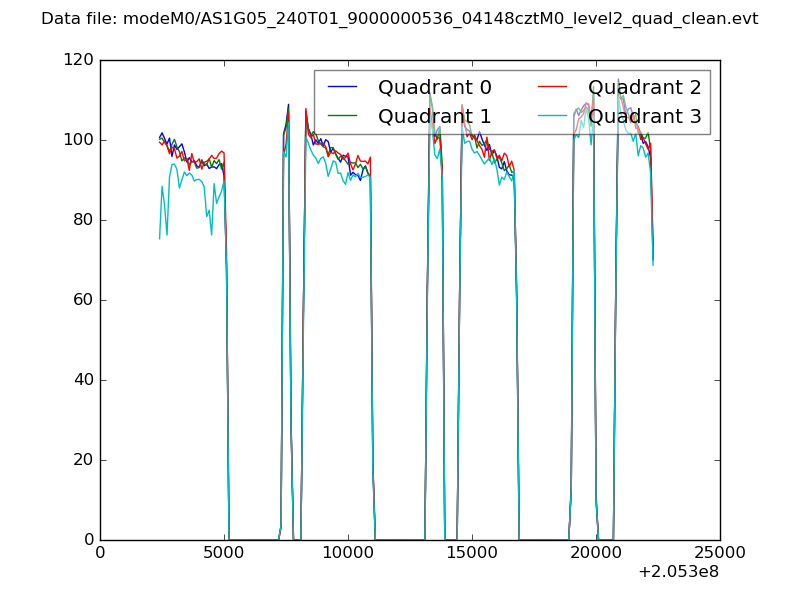 |
|
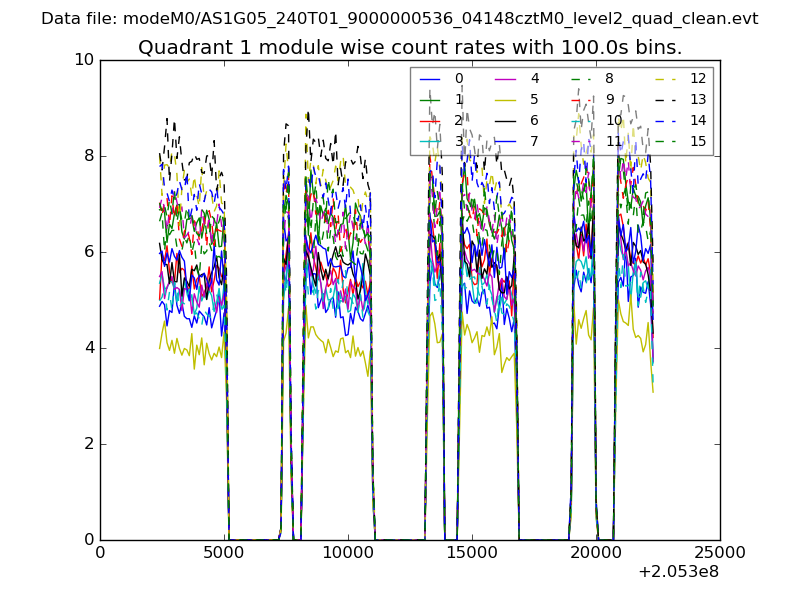
| Module-wise count rates for Quadrant A Data is divided into 100 sec bins |
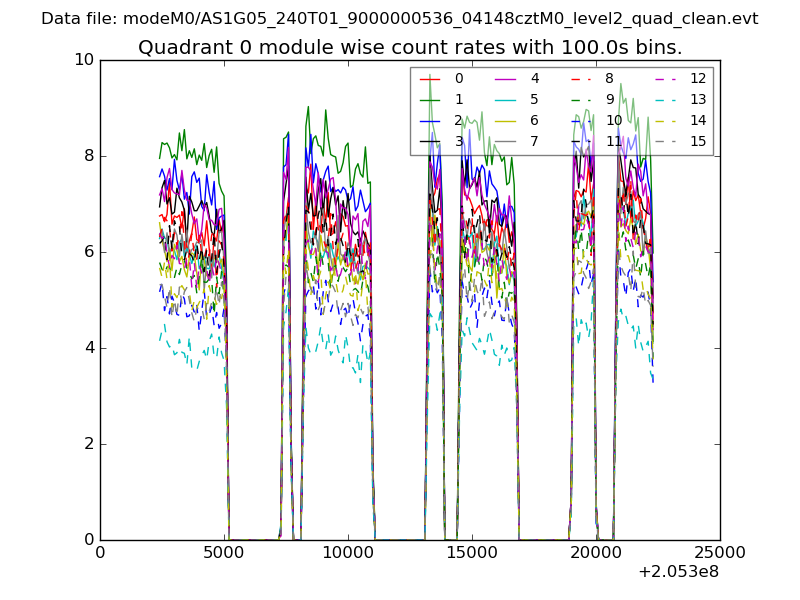 |
 |
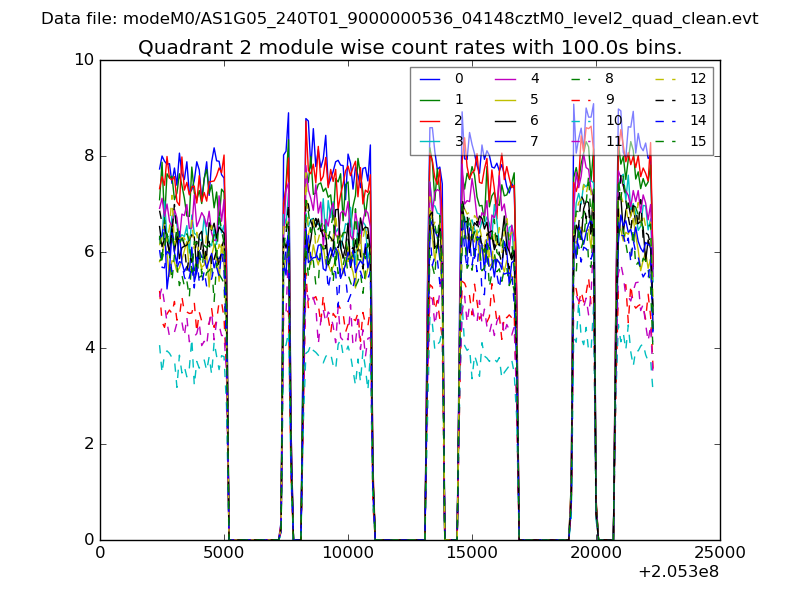
| Module-wise count rates for Quadrant B Data is divided into 100 sec bins |
 |
 |
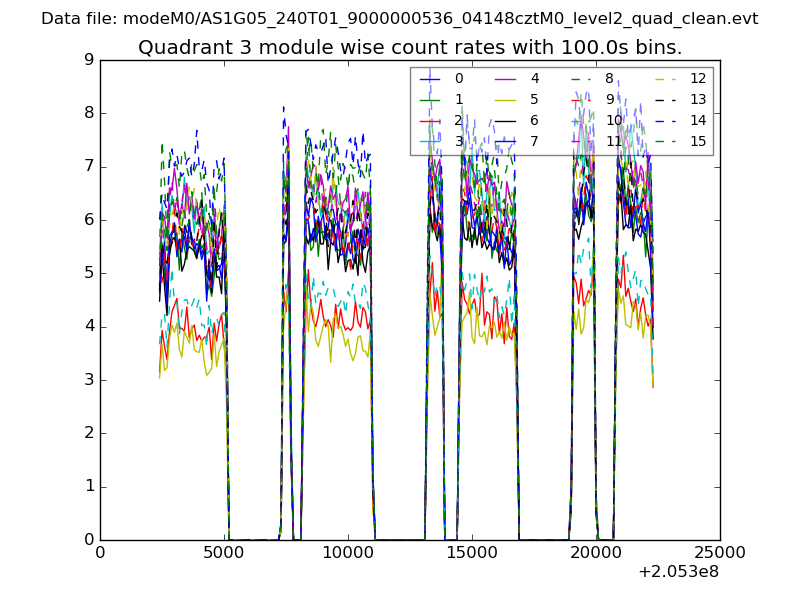
| Module-wise count rates for Quadrant C Data is divided into 100 sec bins |
 |
 |
| Module-wise count rates for Quadrant D Data is divided into 100 sec bins |
 |
 |
| Parameter | Plot |
|---|---|
| CZT HV Monitor | 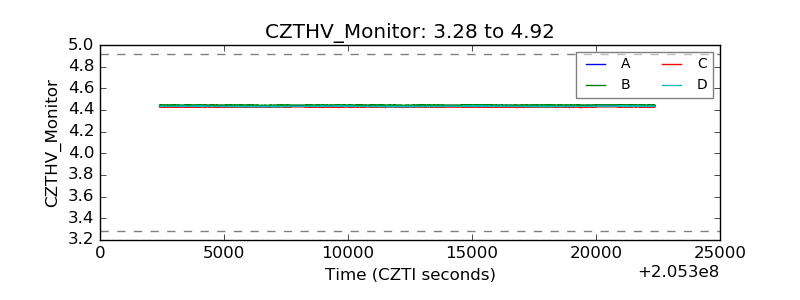 |
| D_VDD | 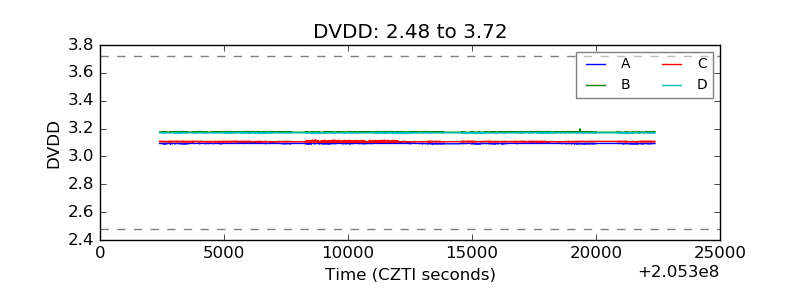 |
| Temperature 1 | 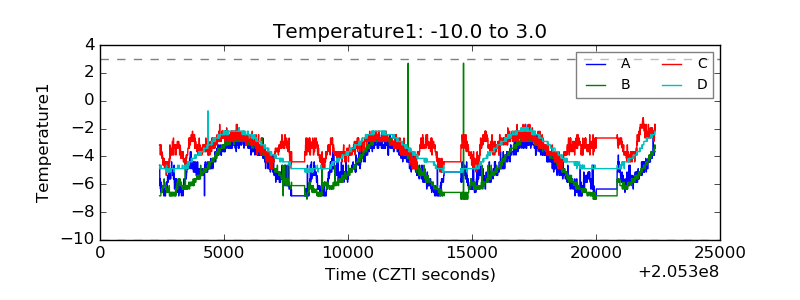 |
| Veto HV Monitor | 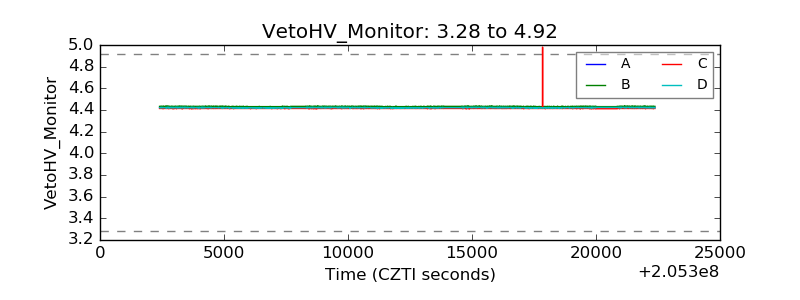 |
| Veto LLD | 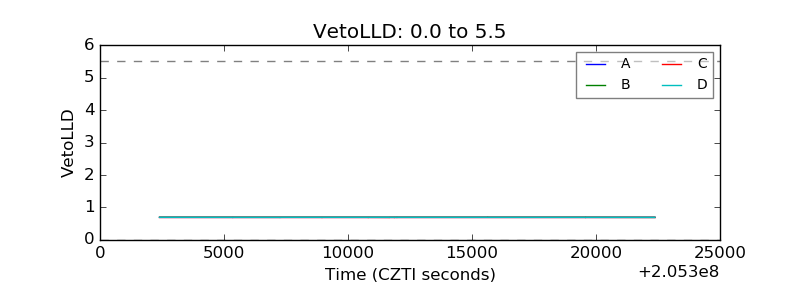 |
| Alpha Counter | 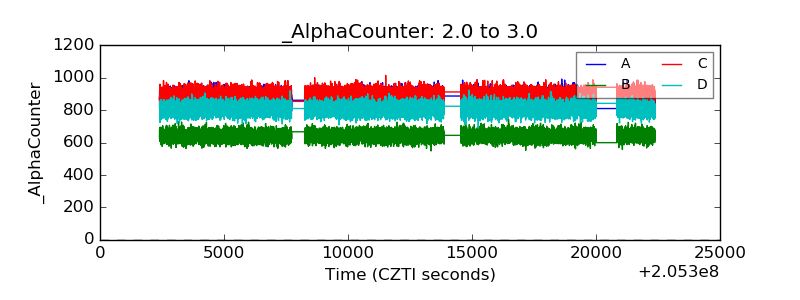 |
| _CPM_Rate | 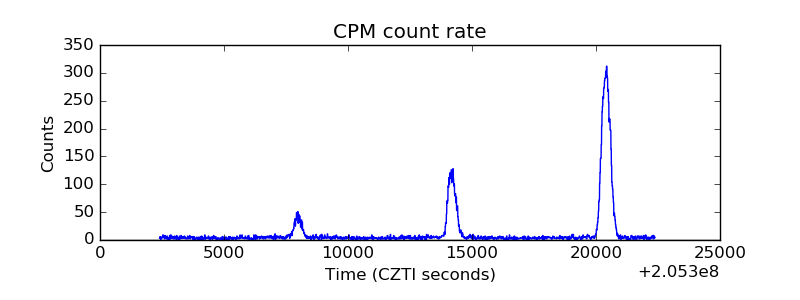 |
| CZT Counter | 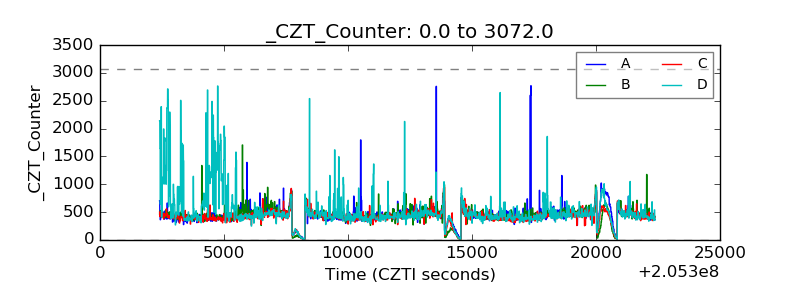 |
| +2.5 Volts monitor | 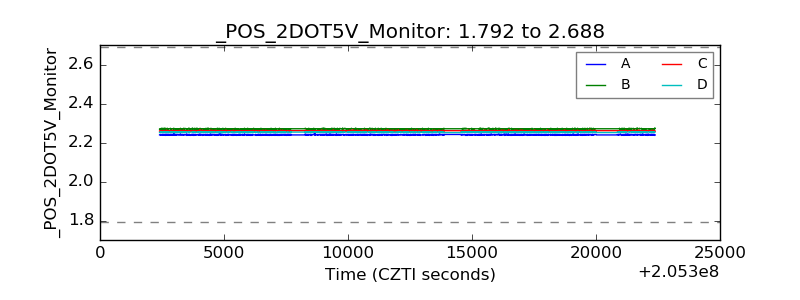 |
| +5 Volts monitor | 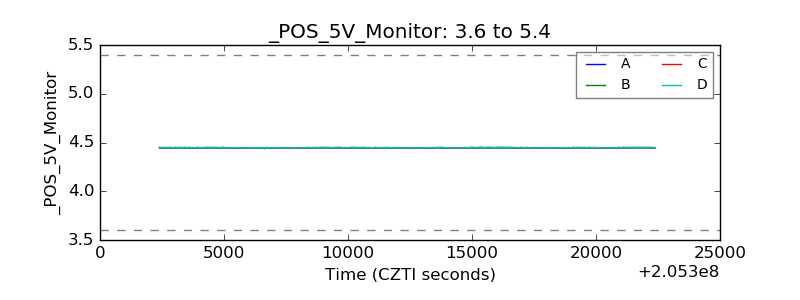 |
| _ROLL_ROT | 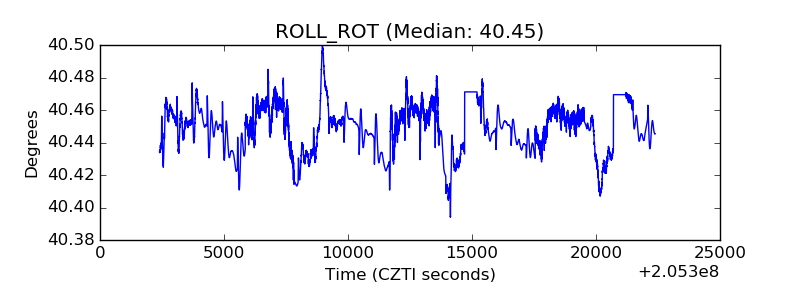 |
| _Roll_DEC | 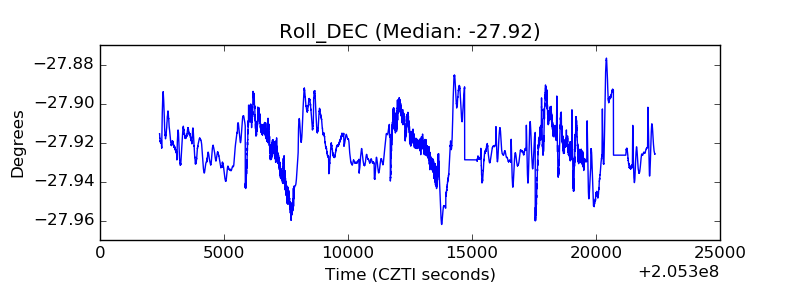 |
| _Roll_RA | 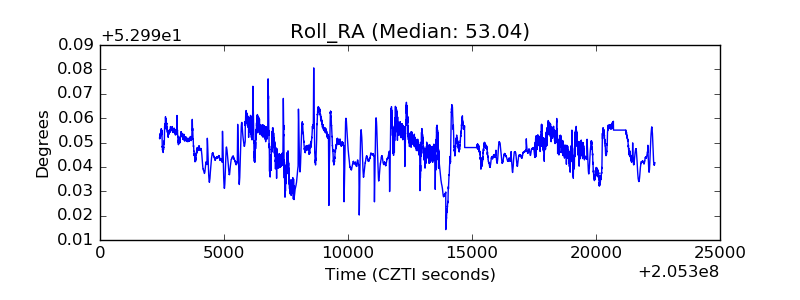 |
| Veto Counter | 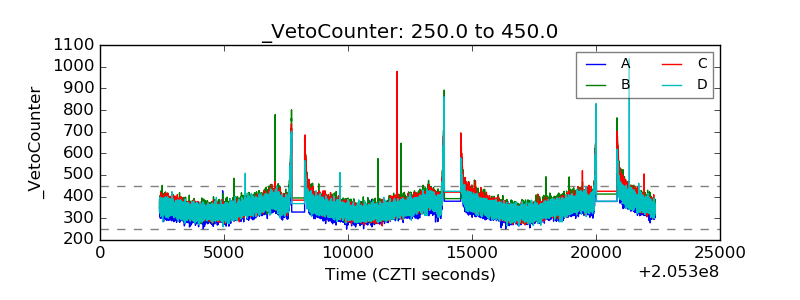 |