| Param | Original file | Final file |
|---|---|---|
| Filename | modeM0/AS1G05_240T01_9000000536_04149cztM0_level2.evt | modeM0/AS1G05_240T01_9000000536_04149cztM0_level2_quad_clean.evt |
| Size (bytes) | 401,351,040 | 72,040,320 |
| Size | 382.8 MB | 68.7 MB |
| Events in quadrant A | 3,027,543 | 438,822 |
| Events in quadrant B | 3,021,920 | 441,224 |
| Events in quadrant C | 2,780,386 | 434,757 |
| Events in quadrant D | 2,892,960 | 423,529 |
| Mode SS | |||
|---|---|---|---|
| Quadrant | BADHDUFLAG | Total packets | Discarded packets |
| A | 0 | 128 | 0 |
| B | 0 | 128 | 0 |
| C | 0 | 128 | 0 |
| D | 0 | 128 | 0 |
| Mode M9 | |||
|---|---|---|---|
| Quadrant | BADHDUFLAG | Total packets | Discarded packets |
| A | 0 | 10 | 0 |
| B | 0 | 10 | 0 |
| C | 0 | 10 | 0 |
| D | 0 | 10 | 0 |
| Mode M0 | |||
|---|---|---|---|
| Quadrant | BADHDUFLAG | Total packets | Discarded packets |
| A | 0 | 13136 | 2 |
| B | 0 | 13108 | 1 |
| C | 0 | 12818 | 1 |
| D | 0 | 13226 | 1 |
| Quadrant | Total seconds | Saturated seconds | Saturation percentage |
|---|---|---|---|
| A | 6352 | 52 | 0.818640% |
| B | 6352 | 39 | 0.613980% |
| C | 6352 | 17 | 0.267632% |
| D | 6352 | 47 | 0.739924% |
Noise dominated data is calculated using 1-second bins in cleaned event files. If a bin has >2000 counts, and if more than 50% of those come from <1% of pixels, then it is considered to be noise-dominated and hence unusable.
| Quadrant | # 1 sec bins | Bins with >0 counts | Bins with >2000 counts | High rate bins dominated by noise | Noise dominated (total time) | Noise dominated (detector-on time) | Marked lightcurve |
|---|---|---|---|---|---|---|---|
| A | 7352 | 6353 | 9 | 9 | 0.12% | 0.14% | 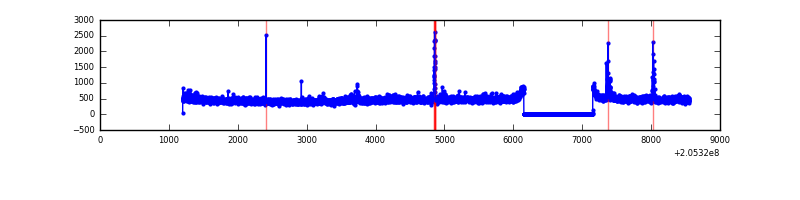 |
| B | 7352 | 6353 | 5 | 5 | 0.07% | 0.08% | 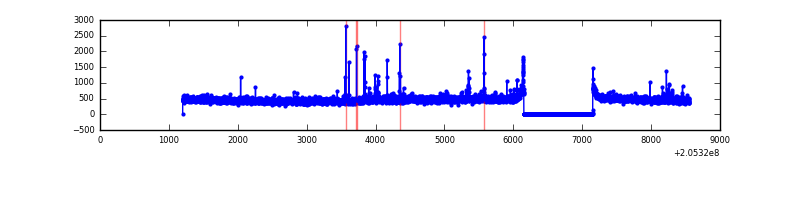 |
| C | 7352 | 6353 | 0 | 0 | 0.00% | 0.00% | 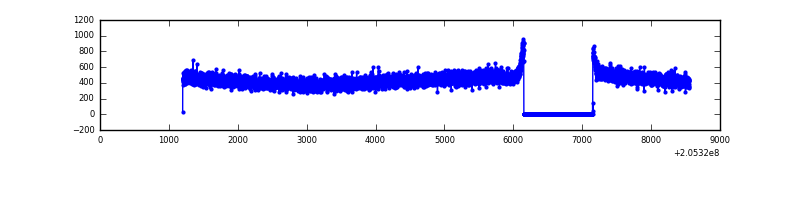 |
| D | 7352 | 6353 | 15 | 15 | 0.20% | 0.24% | 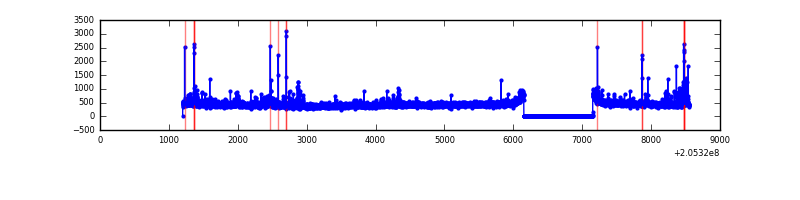 |
Top three noisy pixels from each quadrant. If the there are fewer than three noisy pixels in the level2.evt file, extra rows are filled as -1
| Pixel properties | Quadrant properties | ||||||
|---|---|---|---|---|---|---|---|
| Quadrant | DetID | PixID | Counts | Sigma | Mean | Median | Sigma |
| A | 3 | 1 | 85385 | 560.96 | 738 | 720 | 150.9 |
| A | 0 | 50 | 44545 | 290.37 | 738 | 720 | 150.9 |
| A | 8 | 15 | 27360 | 176.51 | 738 | 720 | 150.9 |
| B | 10 | 16 | 83320 | 572.05 | 740 | 723 | 144.4 |
| B | 14 | 167 | 18365 | 122.18 | 740 | 723 | 144.4 |
| B | 4 | 81 | 15052 | 99.24 | 740 | 723 | 144.4 |
| C | 13 | 61 | 5891 | 31.32 | 709 | 712 | 165.4 |
| C | 1 | 16 | 4555 | 23.24 | 709 | 712 | 165.4 |
| C | 10 | 65 | 2736 | 12.24 | 709 | 712 | 165.4 |
| D | 13 | 239 | 67966 | 388.8 | 715 | 695 | 173.0 |
| D | 12 | 233 | 50873 | 290.01 | 715 | 695 | 173.0 |
| D | 2 | 232 | 44648 | 254.03 | 715 | 695 | 173.0 |
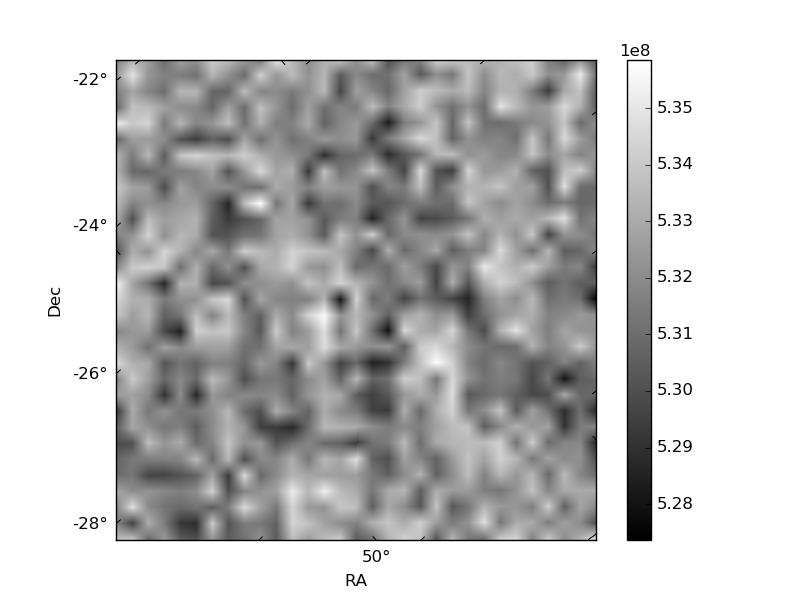
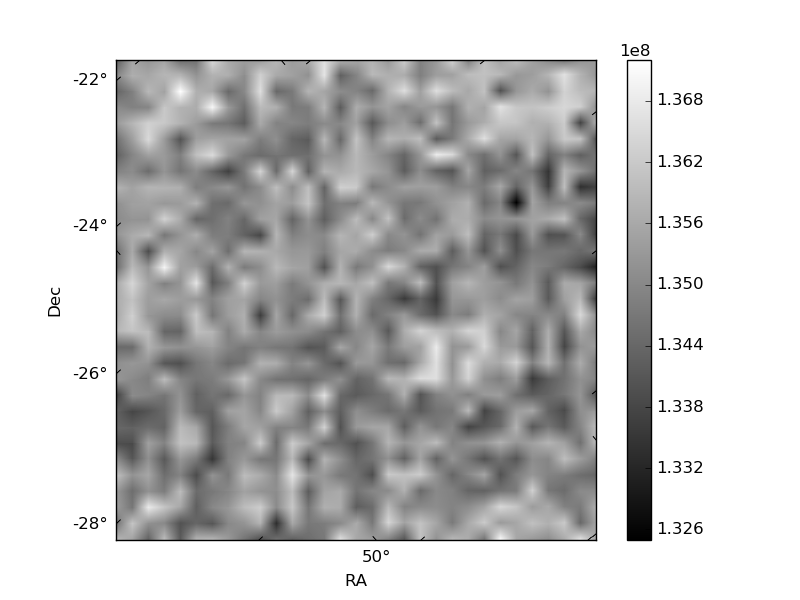
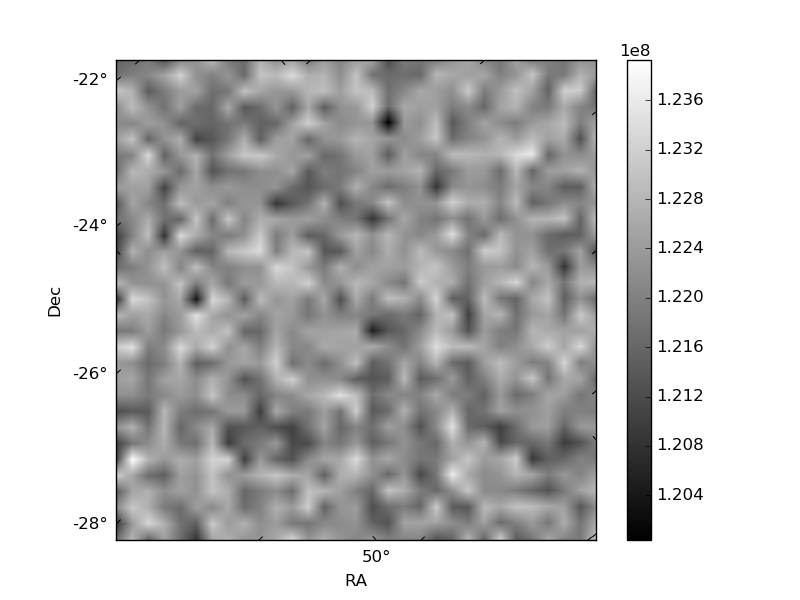
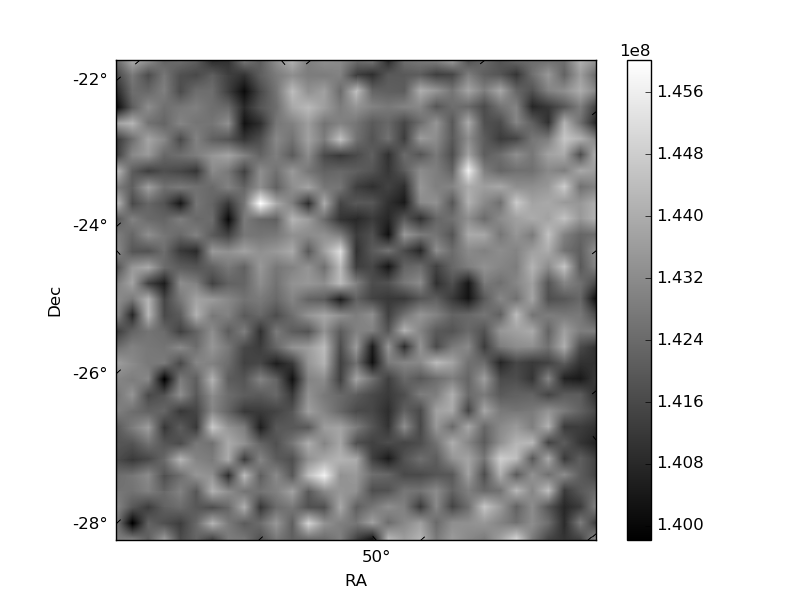
Histogram calculated using DETX and DETY for each event in the final _common_clean file
| Quadrant A | 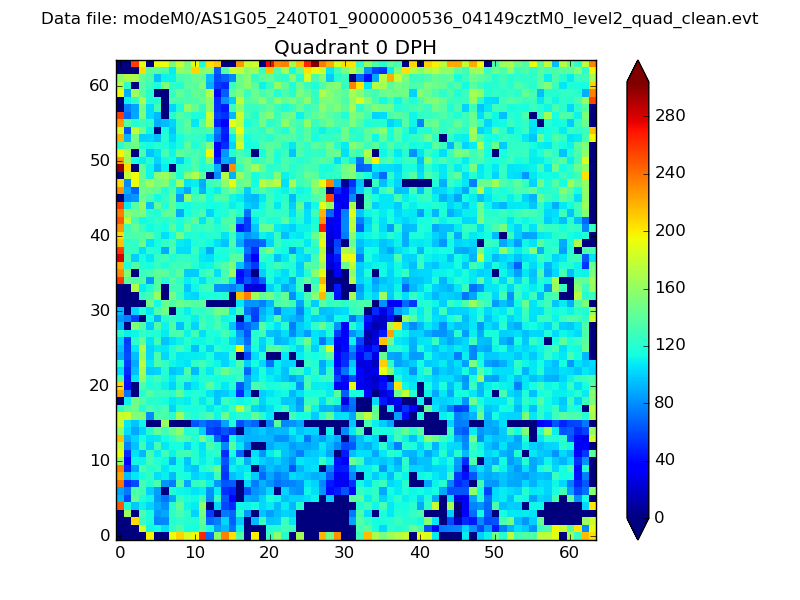 |
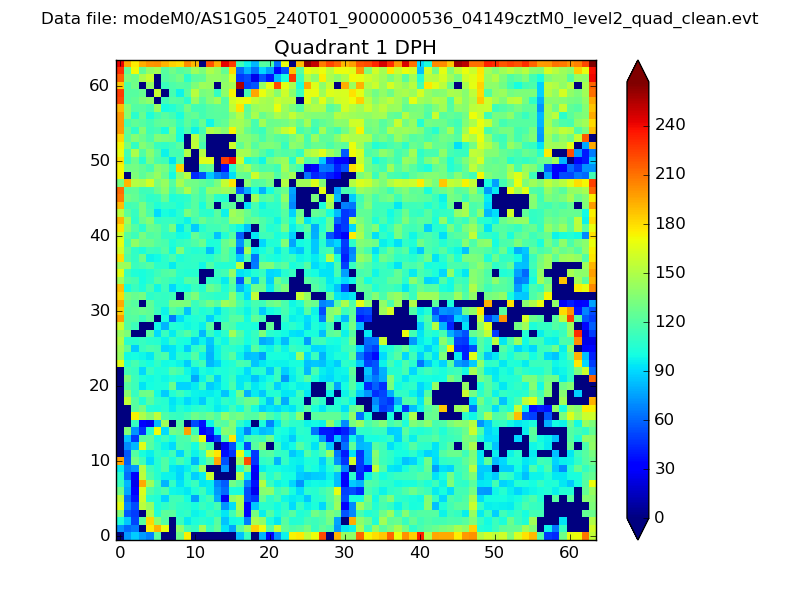 |
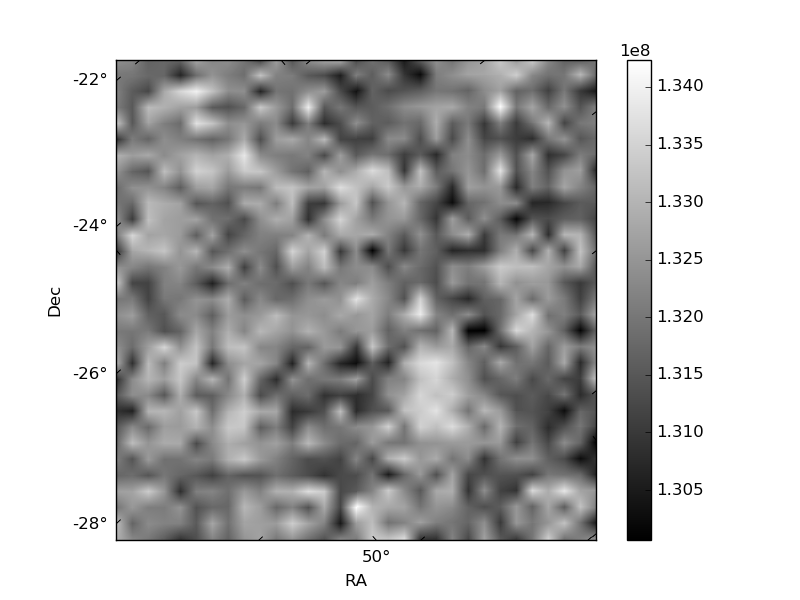
Quadrant B |
|---|---|---|---|
| Quadrant D | 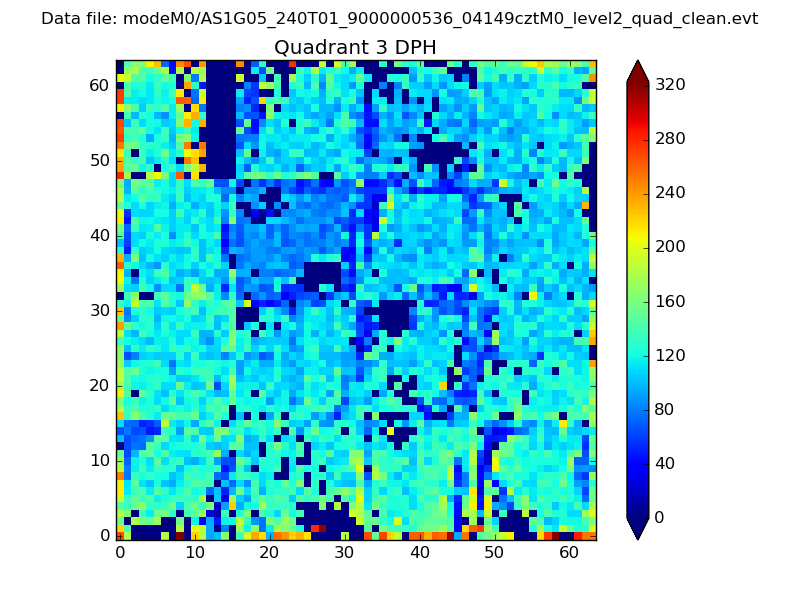 |
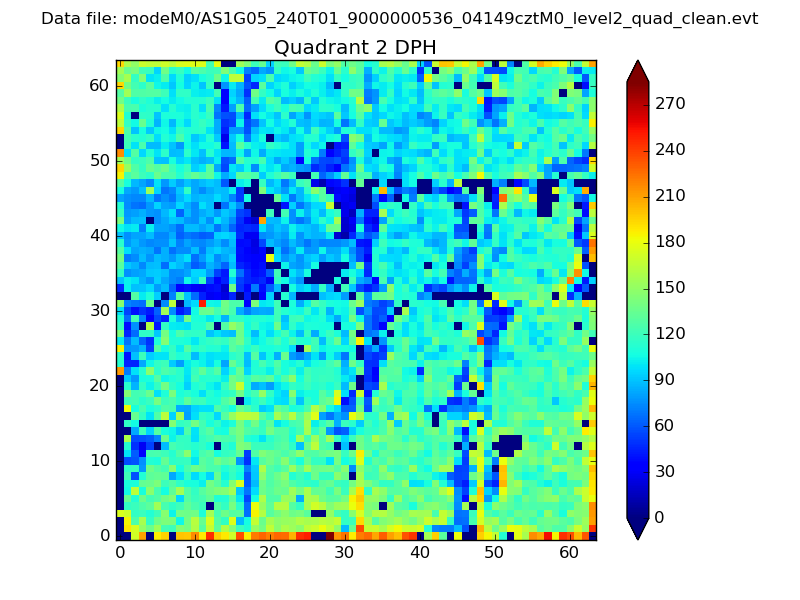 |
Quadrant C |
| Plot type | Count rate plots | Images |
|---|---|---|
| Comparison with Poisson distribution Blue bars denote a histogram of data divided into 1 sec bins. Red curve is a Poisson curve with rate = median count rate of data. |
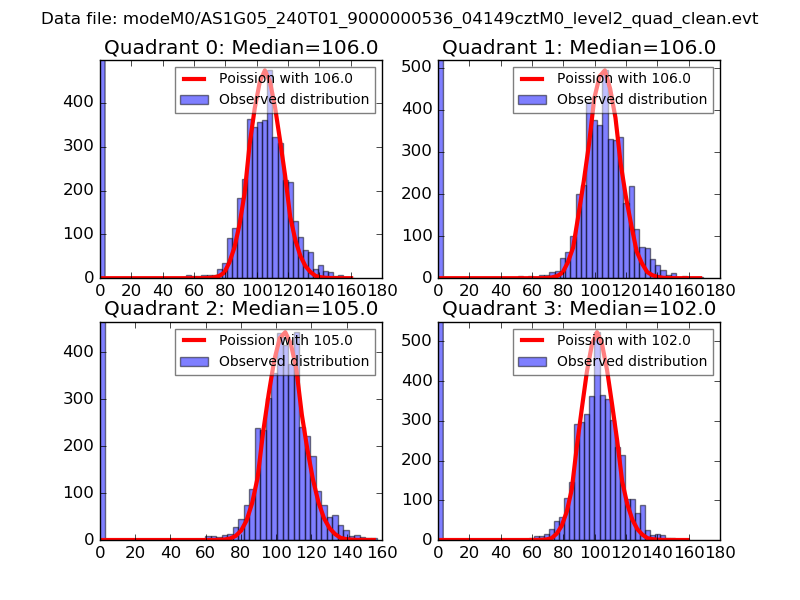 |
 |
| Quadrant-wise count rates Data is divided into 100 sec bins |
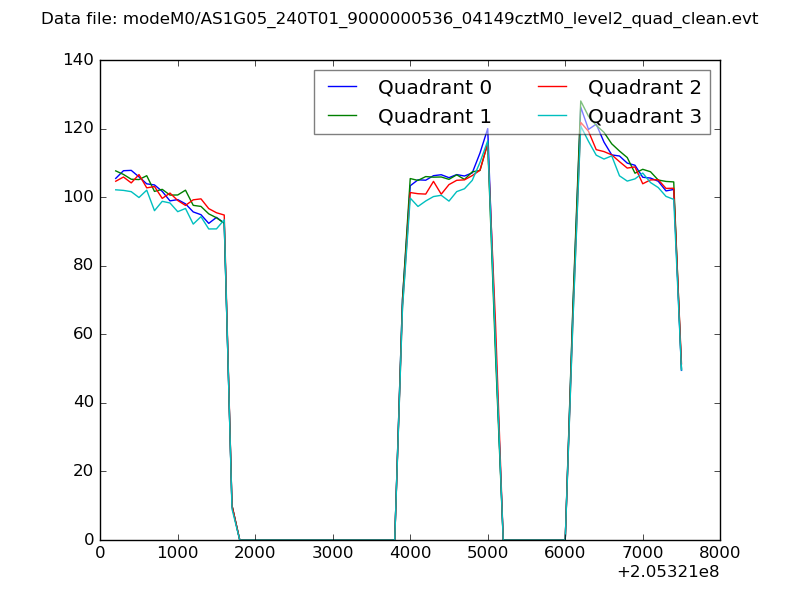 |
|
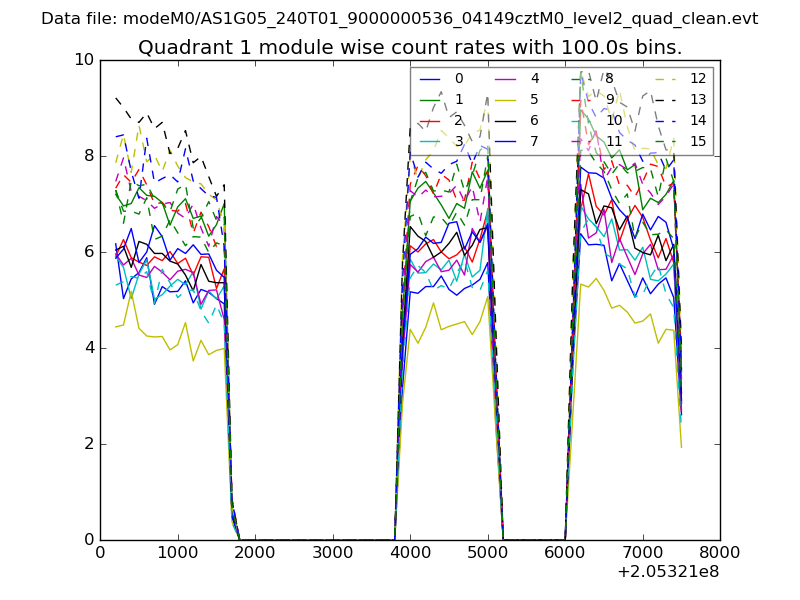
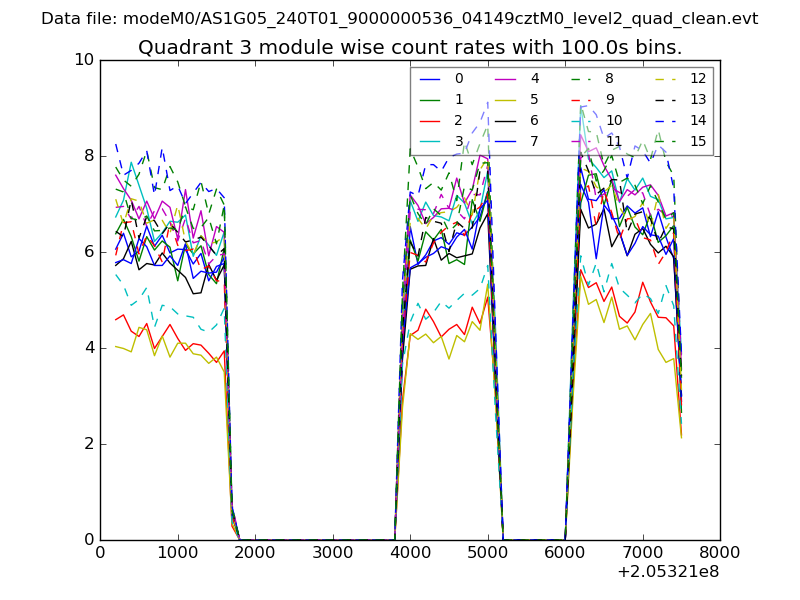
| Module-wise count rates for Quadrant A Data is divided into 100 sec bins |
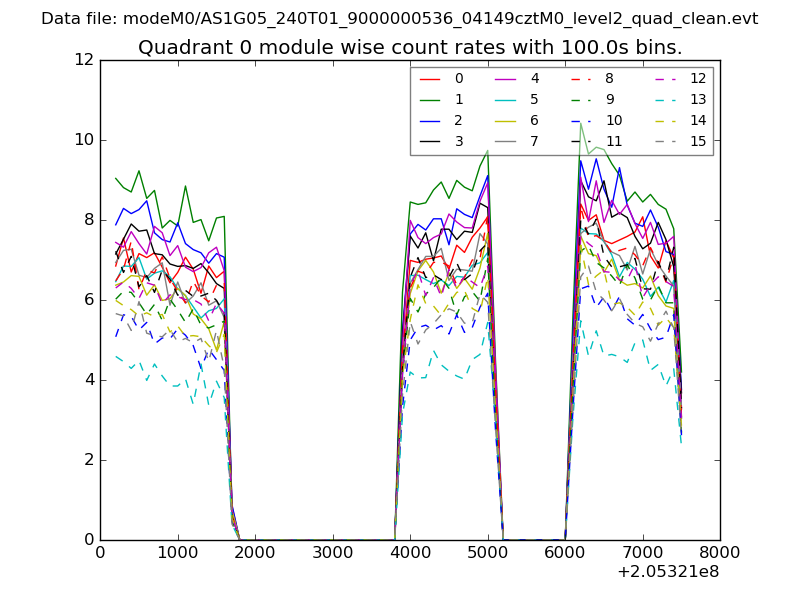 |
 |
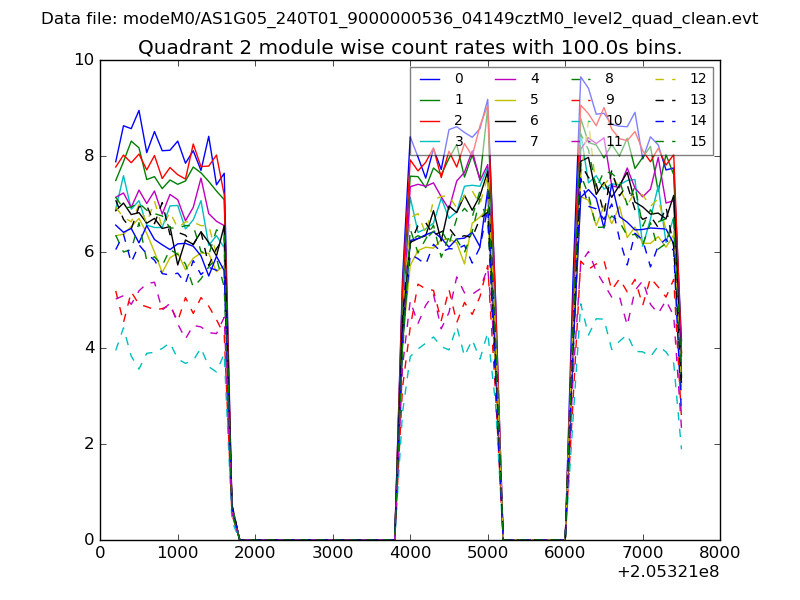
| Module-wise count rates for Quadrant B Data is divided into 100 sec bins |
 |
 |
| Module-wise count rates for Quadrant C Data is divided into 100 sec bins |
 |
 |
| Module-wise count rates for Quadrant D Data is divided into 100 sec bins |
 |
 |
| Parameter | Plot |
|---|---|
| CZT HV Monitor | 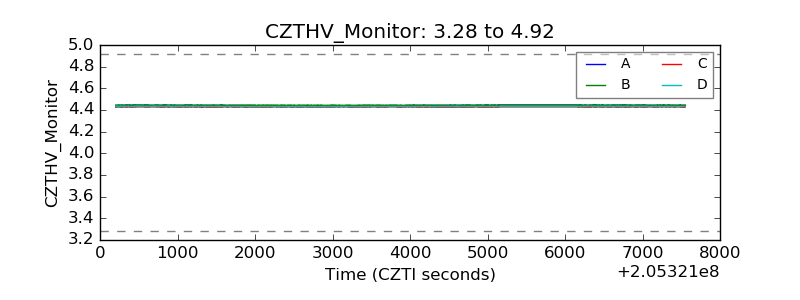 |
| D_VDD | 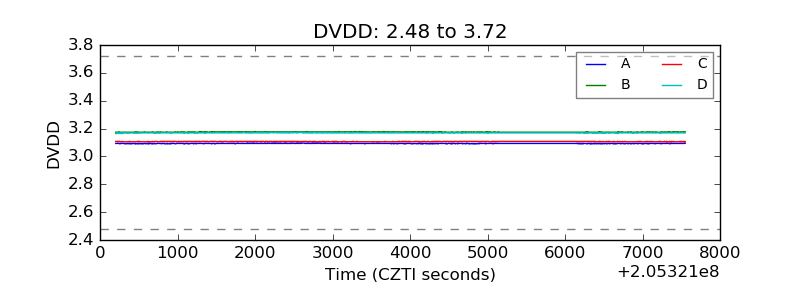 |
| Temperature 1 | 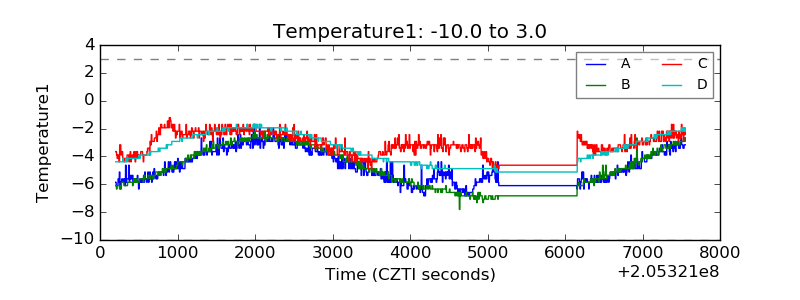 |
| Veto HV Monitor | 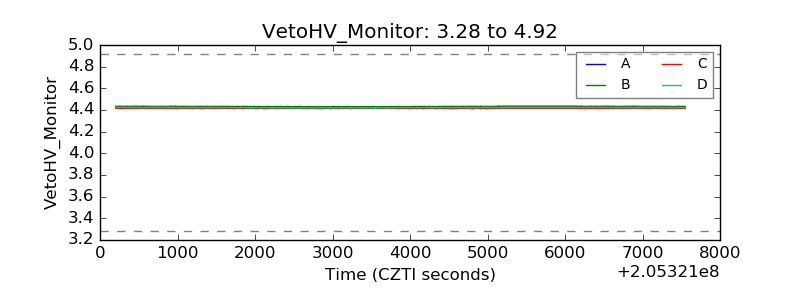 |
| Veto LLD |  |
| Alpha Counter | 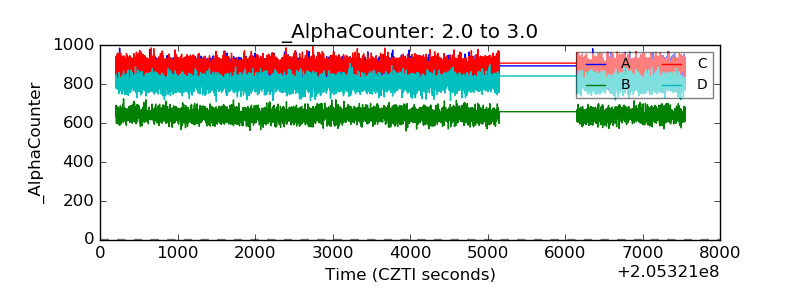 |
| _CPM_Rate | 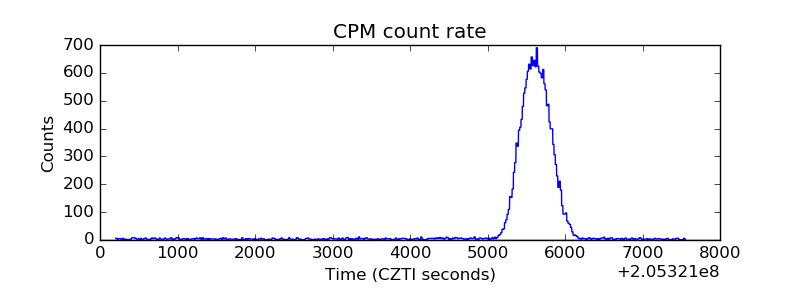 |
| CZT Counter | 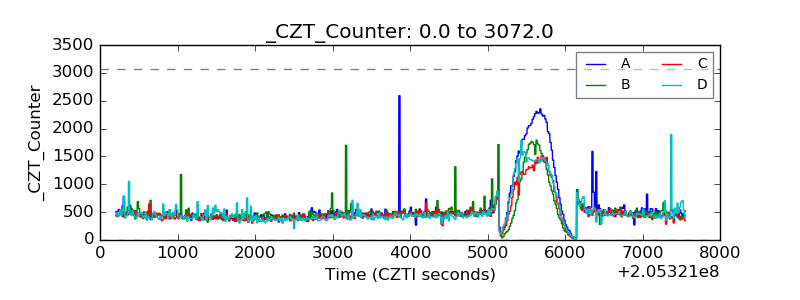 |
| +2.5 Volts monitor |  |
| +5 Volts monitor |  |
| _ROLL_ROT | 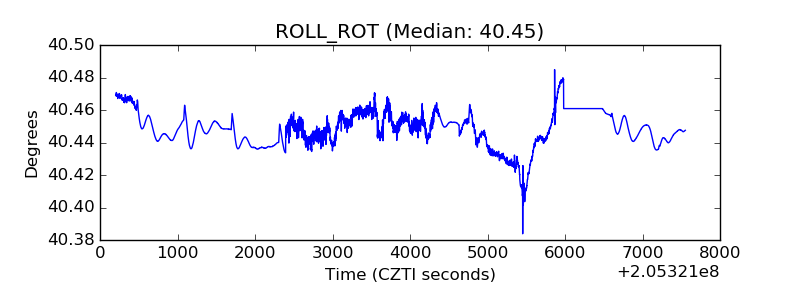 |
| _Roll_DEC | 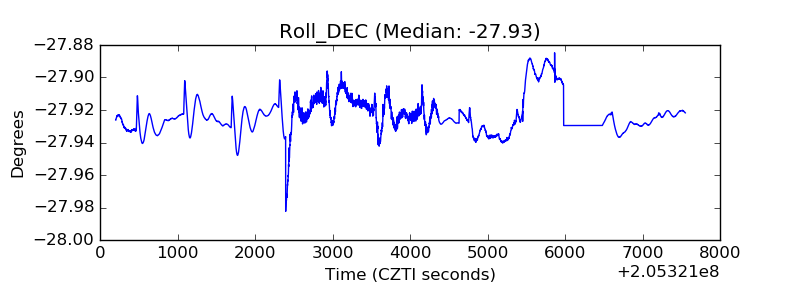 |
| _Roll_RA | 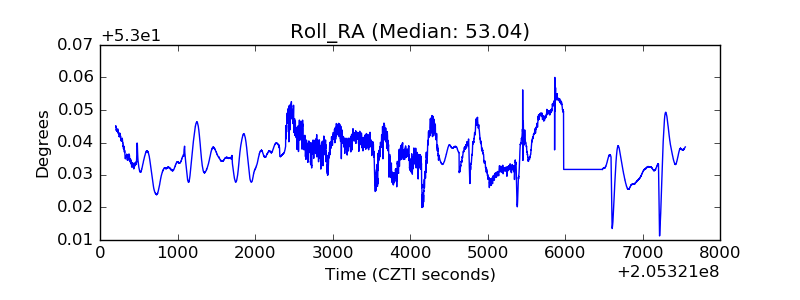 |
| Veto Counter | 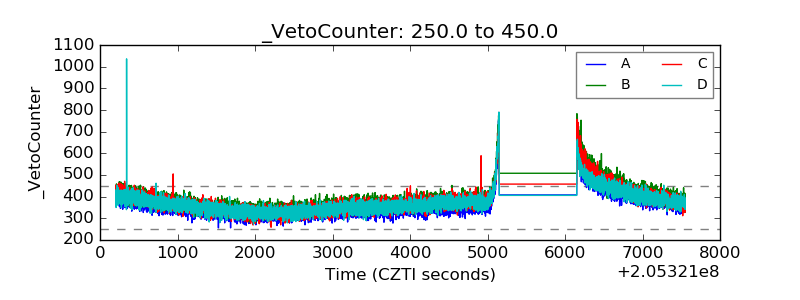 |