| Param | Original file | Final file |
|---|---|---|
| Filename | modeM0/AS1G05_240T01_9000000536_04151cztM0_level2.evt | modeM0/AS1G05_240T01_9000000536_04151cztM0_level2_quad_clean.evt |
| Size (bytes) | 406,915,200 | 67,043,520 |
| Size | 388.1 MB | 63.9 MB |
| Events in quadrant A | 3,066,558 | 402,490 |
| Events in quadrant B | 3,020,398 | 407,413 |
| Events in quadrant C | 2,809,943 | 397,056 |
| Events in quadrant D | 3,001,310 | 386,716 |
| Mode SS | |||
|---|---|---|---|
| Quadrant | BADHDUFLAG | Total packets | Discarded packets |
| A | 0 | 126 | 0 |
| B | 0 | 126 | 0 |
| C | 0 | 126 | 0 |
| D | 0 | 126 | 0 |
| Mode M9 | |||
|---|---|---|---|
| Quadrant | BADHDUFLAG | Total packets | Discarded packets |
| A | 0 | 12 | 0 |
| B | 0 | 12 | 0 |
| C | 0 | 12 | 0 |
| D | 0 | 12 | 0 |
| Mode M0 | |||
|---|---|---|---|
| Quadrant | BADHDUFLAG | Total packets | Discarded packets |
| A | 0 | 13101 | 2 |
| B | 0 | 13037 | 1 |
| C | 0 | 12702 | 1 |
| D | 0 | 13383 | 1 |
| Quadrant | Total seconds | Saturated seconds | Saturation percentage |
|---|---|---|---|
| A | 6254 | 68 | 1.087304% |
| B | 6254 | 41 | 0.655580% |
| C | 6254 | 14 | 0.223857% |
| D | 6254 | 38 | 0.607611% |
Noise dominated data is calculated using 1-second bins in cleaned event files. If a bin has >2000 counts, and if more than 50% of those come from <1% of pixels, then it is considered to be noise-dominated and hence unusable.
| Quadrant | # 1 sec bins | Bins with >0 counts | Bins with >2000 counts | High rate bins dominated by noise | Noise dominated (total time) | Noise dominated (detector-on time) | Marked lightcurve |
|---|---|---|---|---|---|---|---|
| A | 7379 | 6255 | 24 | 24 | 0.33% | 0.38% | 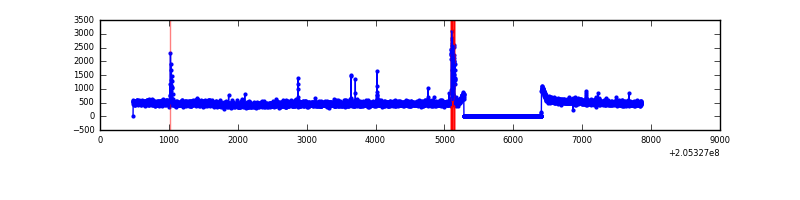 |
| B | 7379 | 6255 | 3 | 3 | 0.04% | 0.05% |  |
| C | 7379 | 6255 | 0 | 0 | 0.00% | 0.00% | 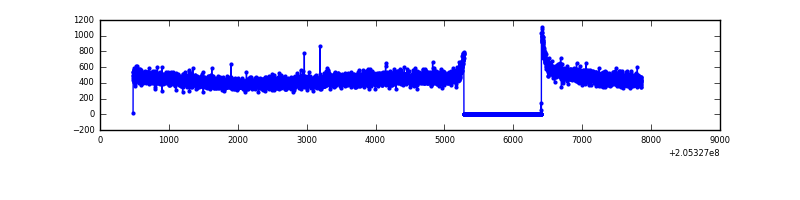 |
| D | 7379 | 6255 | 14 | 14 | 0.19% | 0.22% | 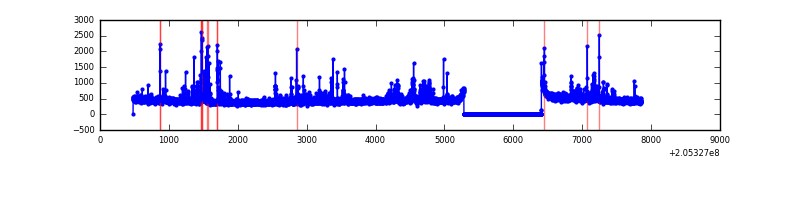 |
Top three noisy pixels from each quadrant. If the there are fewer than three noisy pixels in the level2.evt file, extra rows are filled as -1
| Pixel properties | Quadrant properties | ||||||
|---|---|---|---|---|---|---|---|
| Quadrant | DetID | PixID | Counts | Sigma | Mean | Median | Sigma |
| A | 0 | 50 | 93093 | 603.2 | 745 | 728 | 153.1 |
| A | 3 | 1 | 35375 | 226.27 | 745 | 728 | 153.1 |
| A | 8 | 15 | 33957 | 217.01 | 745 | 728 | 153.1 |
| B | 4 | 81 | 48891 | 333.57 | 749 | 732 | 144.4 |
| B | 4 | 48 | 26811 | 180.63 | 749 | 732 | 144.4 |
| B | 15 | 204 | 14505 | 95.4 | 749 | 732 | 144.4 |
| C | 1 | 16 | 9752 | 53.98 | 715 | 719 | 167.4 |
| C | 13 | 61 | 5940 | 31.2 | 715 | 719 | 167.4 |
| C | 10 | 65 | 4451 | 22.3 | 715 | 719 | 167.4 |
| D | 12 | 79 | 64740 | 369.43 | 721 | 702 | 173.3 |
| D | 12 | 233 | 53641 | 305.4 | 721 | 702 | 173.3 |
| D | 13 | 137 | 32783 | 185.07 | 721 | 702 | 173.3 |
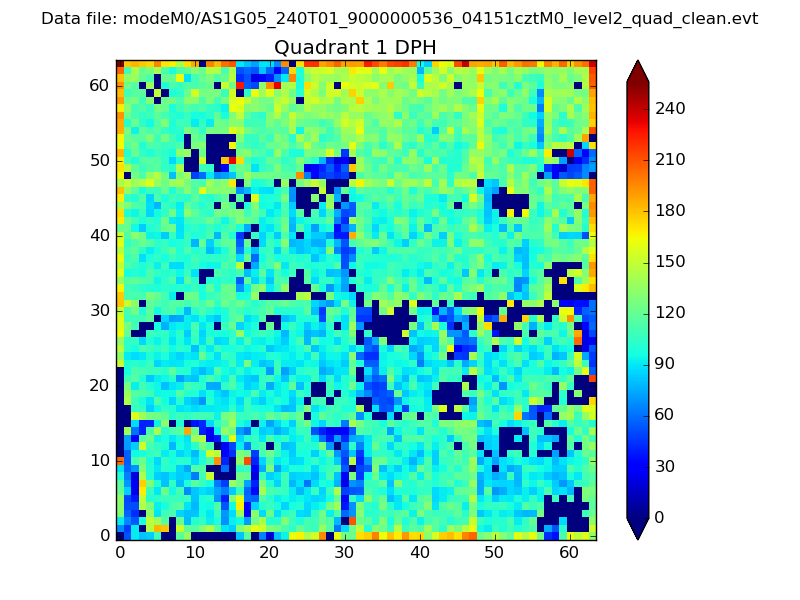
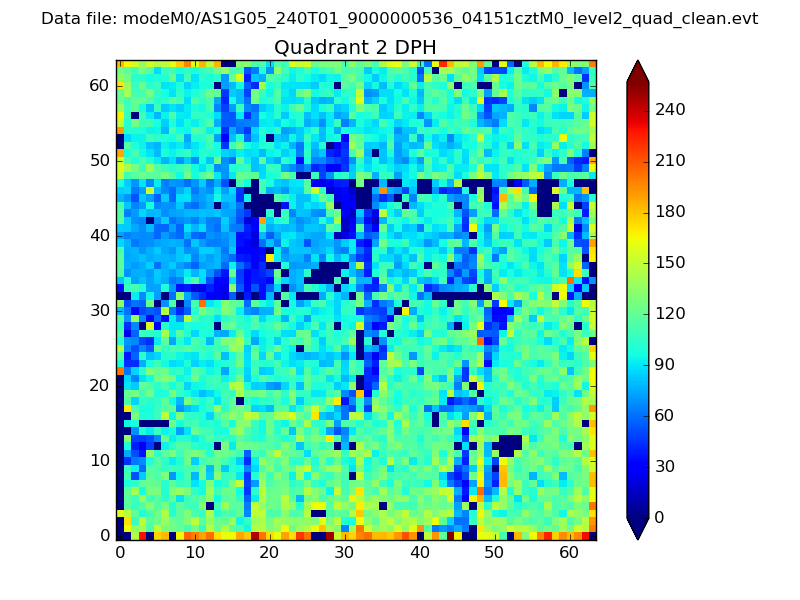
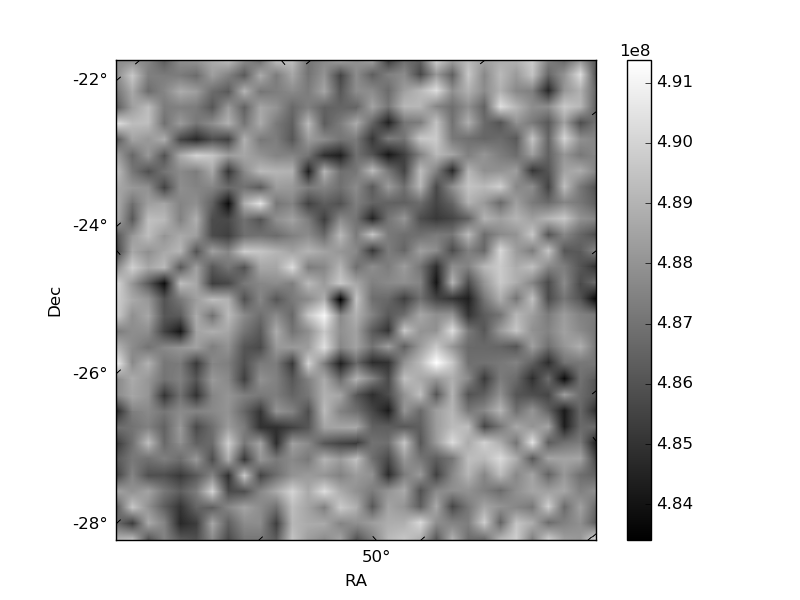
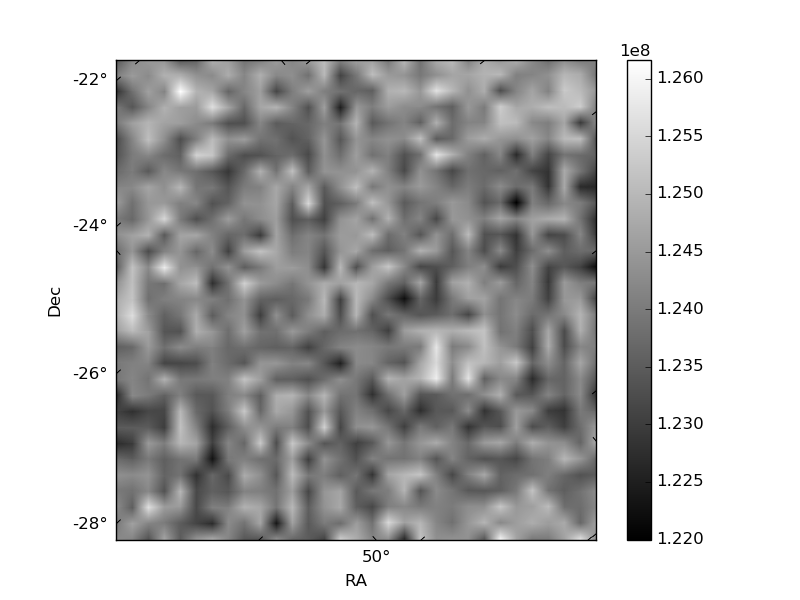
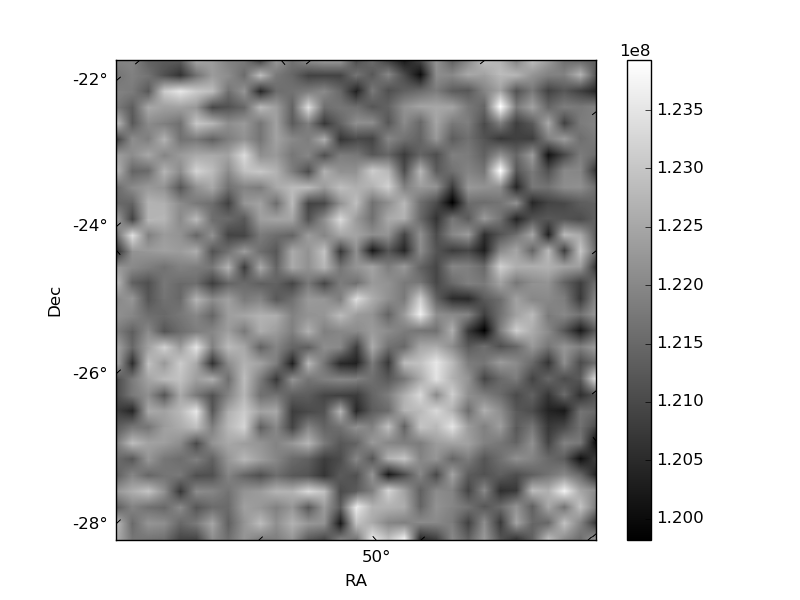
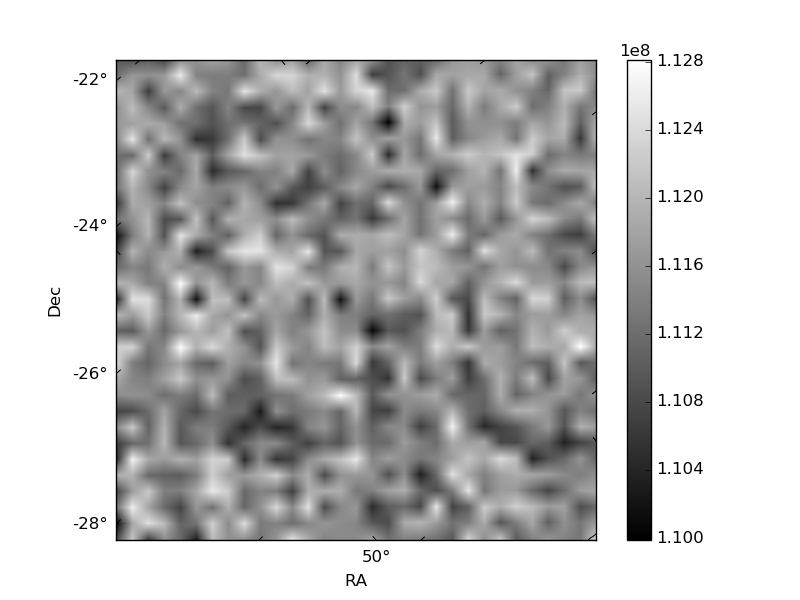
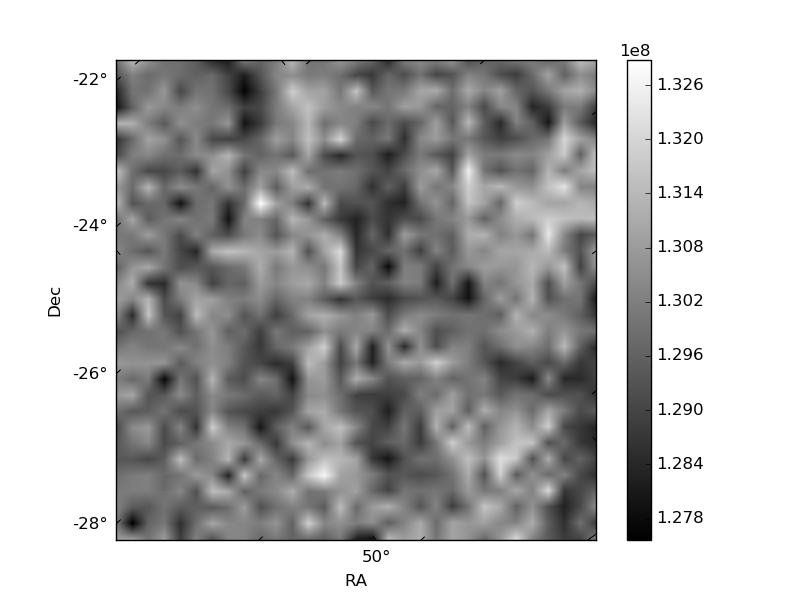
Histogram calculated using DETX and DETY for each event in the final _common_clean file
| Quadrant A | 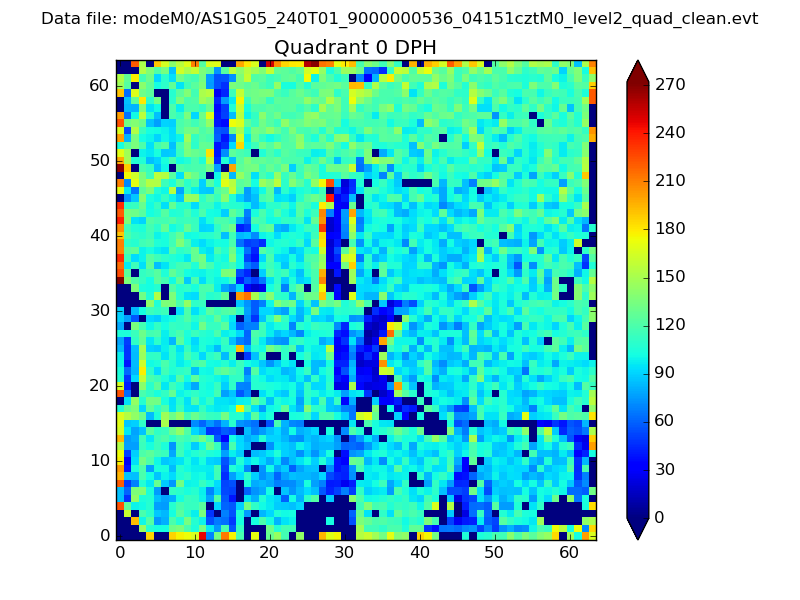 |
 |
Quadrant B |
|---|---|---|---|
| Quadrant D | 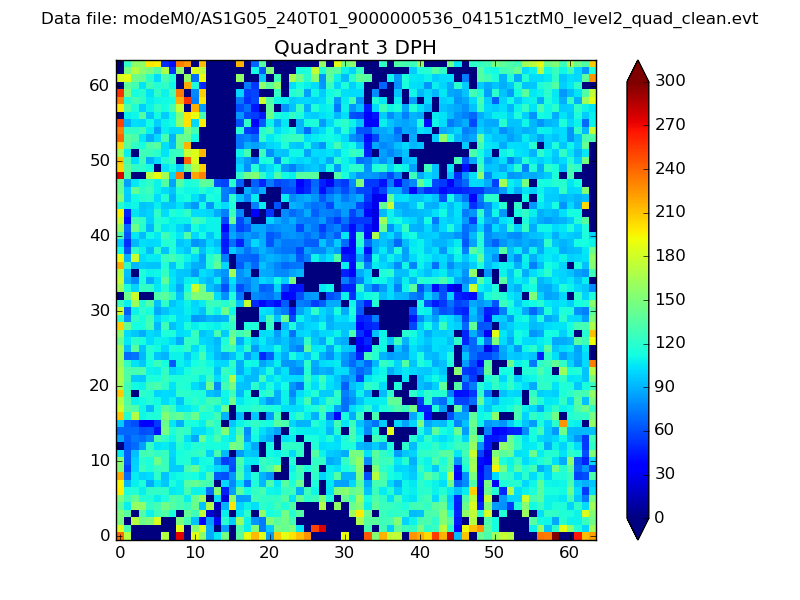 |
 |
Quadrant C |
| Plot type | Count rate plots | Images |
|---|---|---|
| Comparison with Poisson distribution Blue bars denote a histogram of data divided into 1 sec bins. Red curve is a Poisson curve with rate = median count rate of data. |
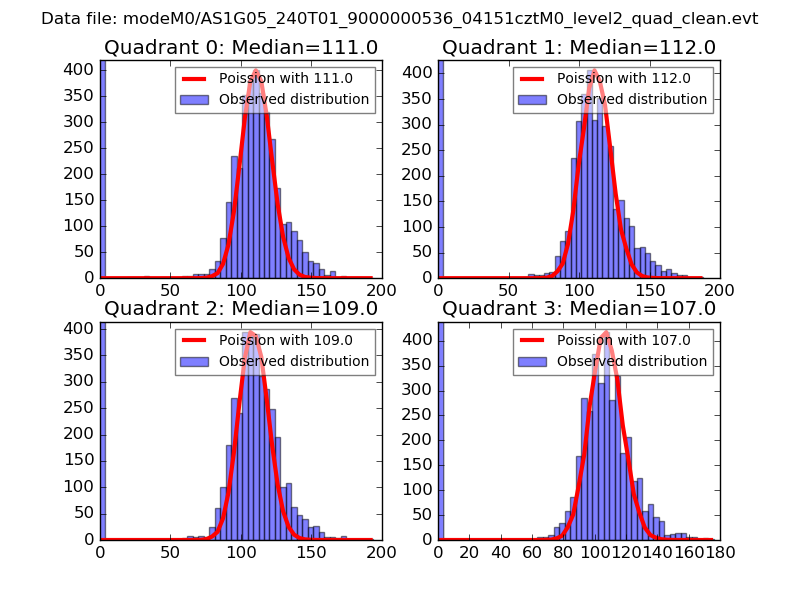 |
 |
| Quadrant-wise count rates Data is divided into 100 sec bins |
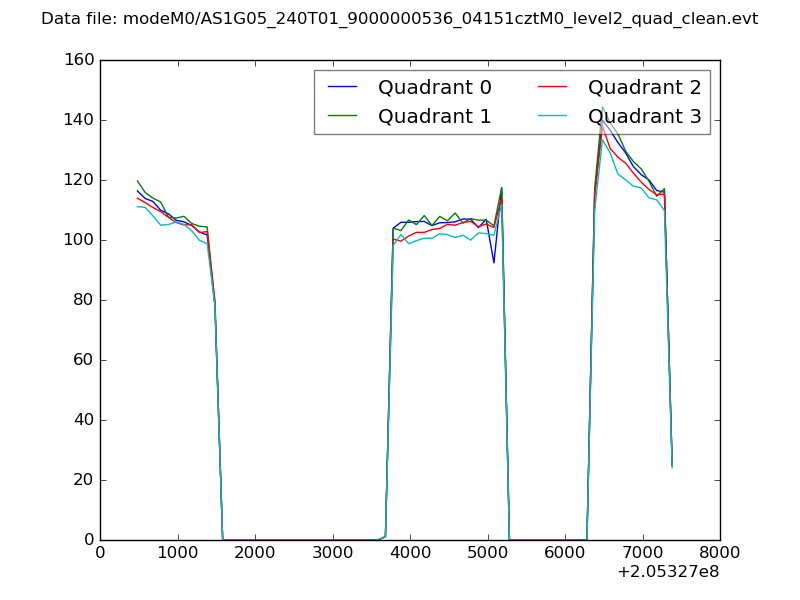 |
|
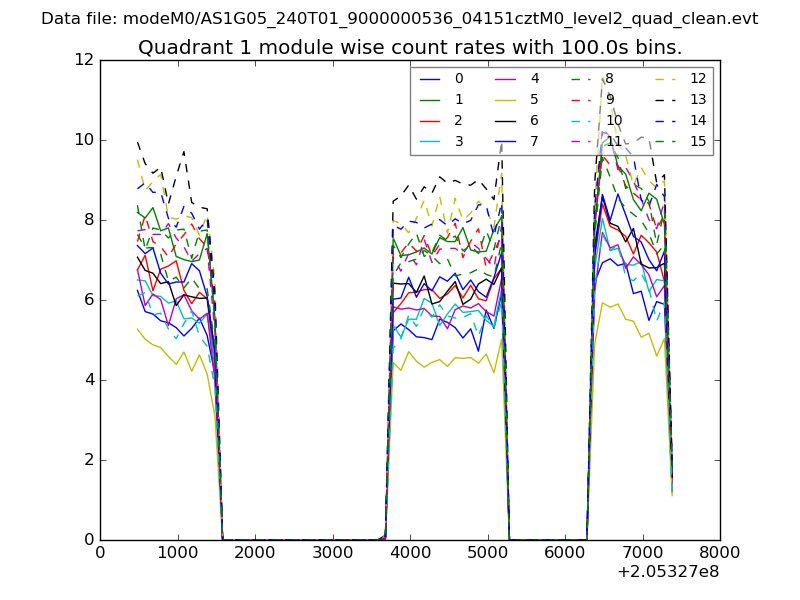
| Module-wise count rates for Quadrant A Data is divided into 100 sec bins |
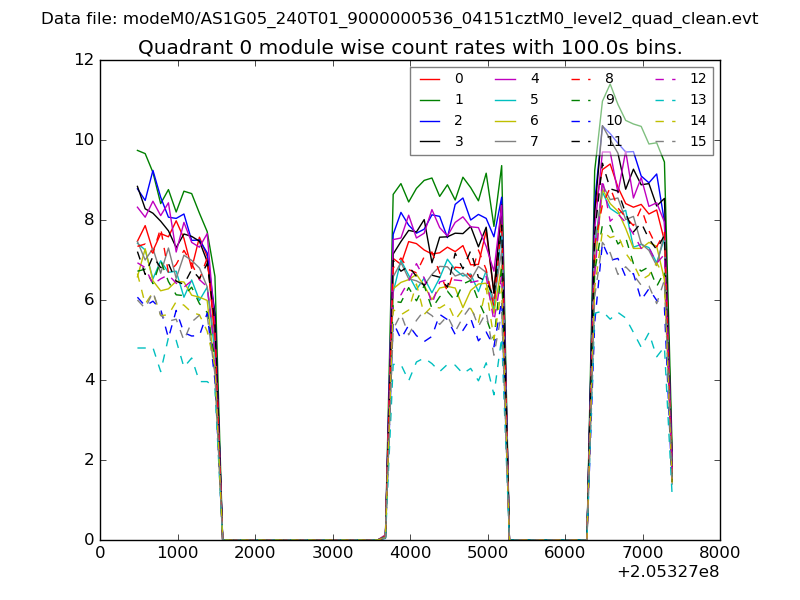 |
 |
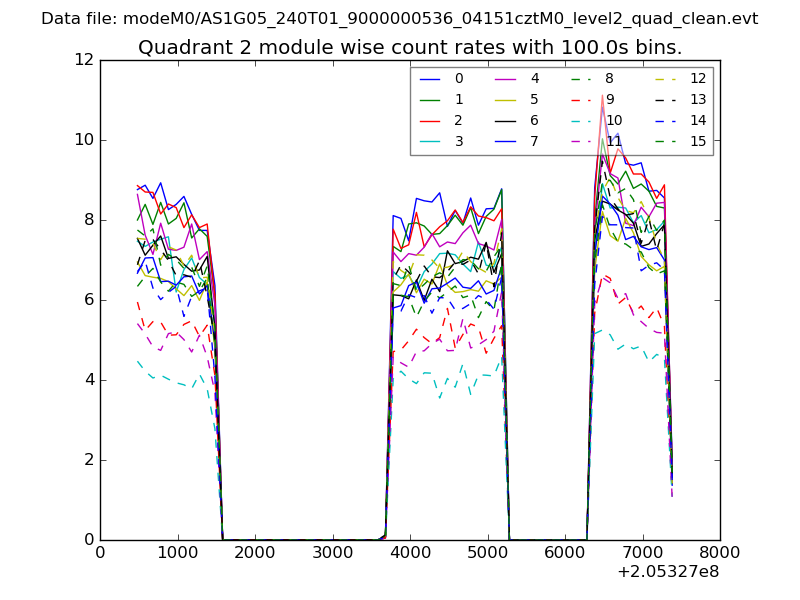
| Module-wise count rates for Quadrant B Data is divided into 100 sec bins |
 |
 |
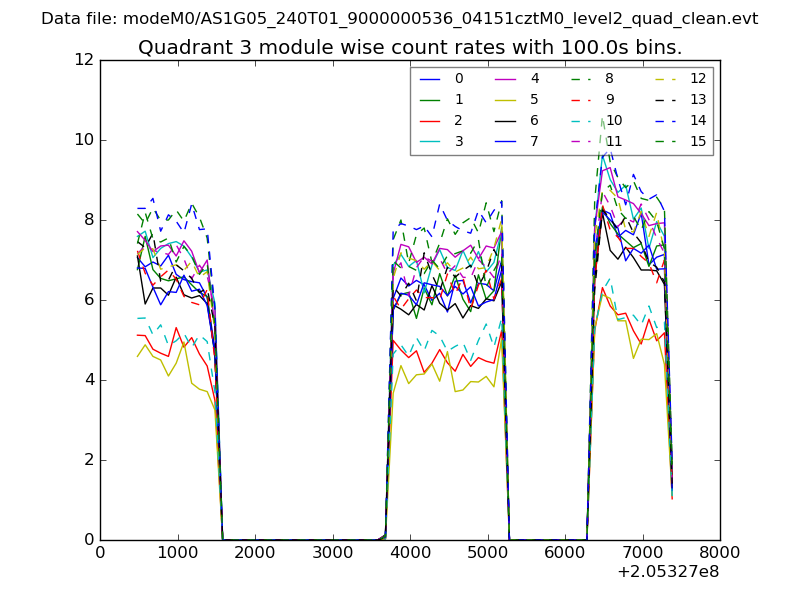
| Module-wise count rates for Quadrant C Data is divided into 100 sec bins |
 |
 |
| Module-wise count rates for Quadrant D Data is divided into 100 sec bins |
 |
 |
| Parameter | Plot |
|---|---|
| CZT HV Monitor | 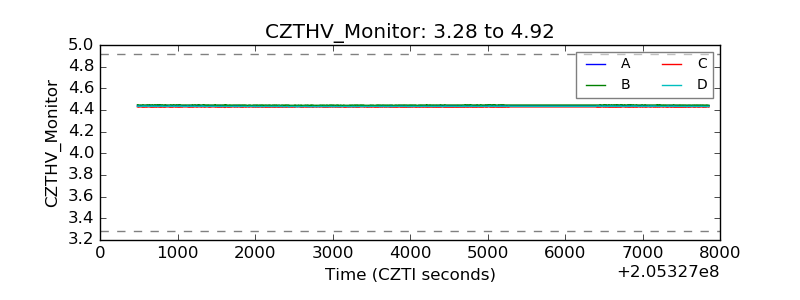 |
| D_VDD | 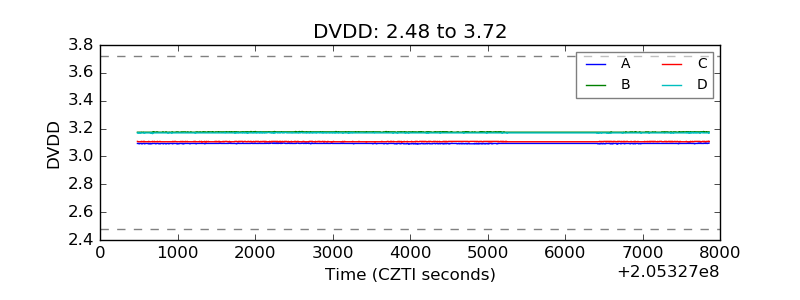 |
| Temperature 1 | 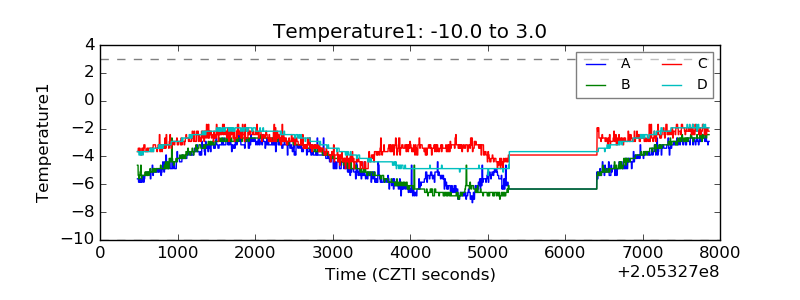 |
| Veto HV Monitor | 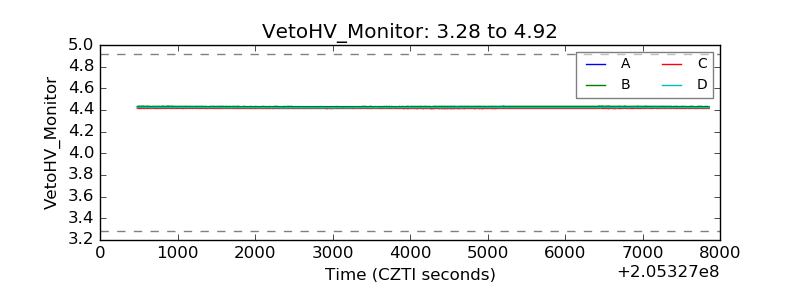 |
| Veto LLD | 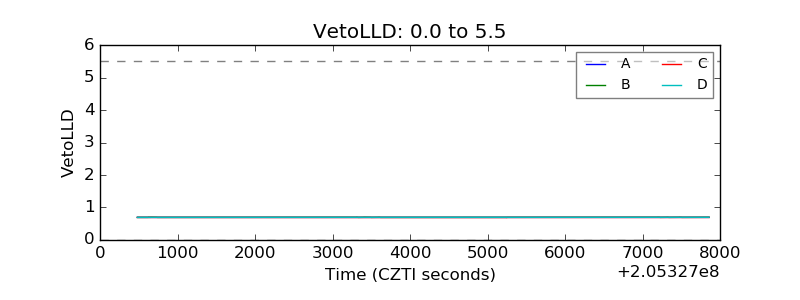 |
| Alpha Counter | 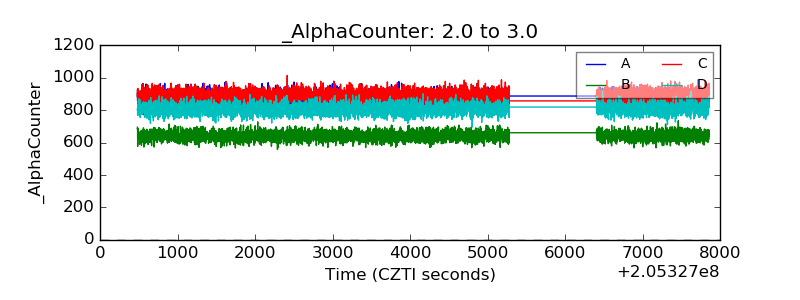 |
| _CPM_Rate | 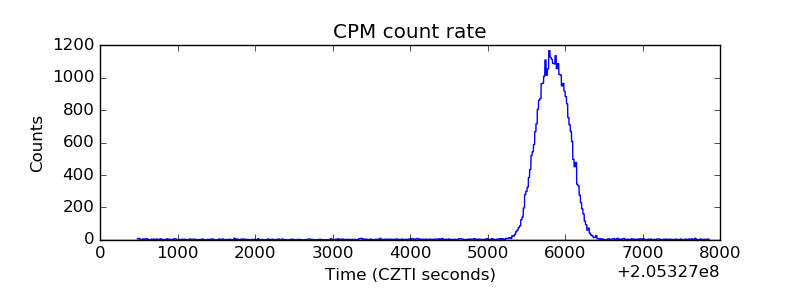 |
| CZT Counter | 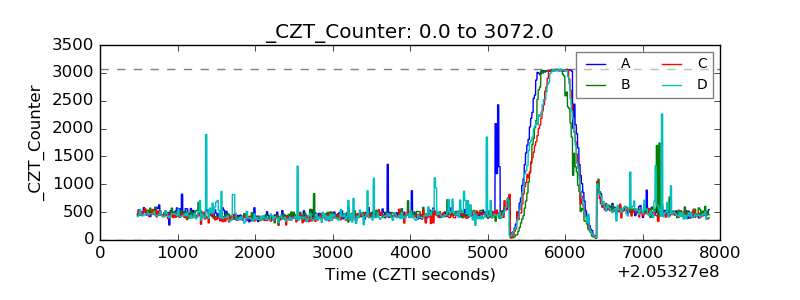 |
| +2.5 Volts monitor |  |
| +5 Volts monitor |  |
| _ROLL_ROT | 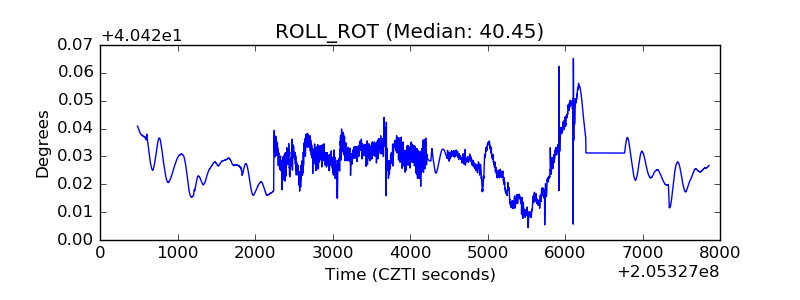 |
| _Roll_DEC | 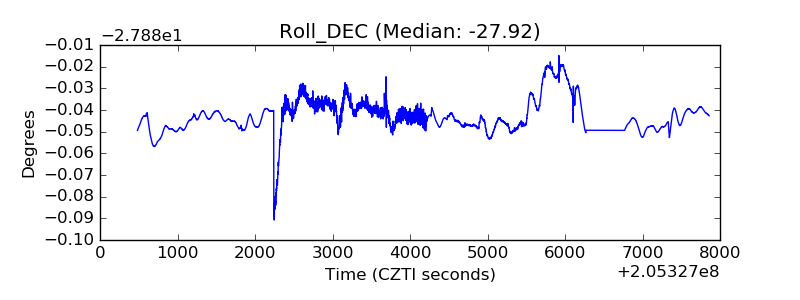 |
| _Roll_RA | 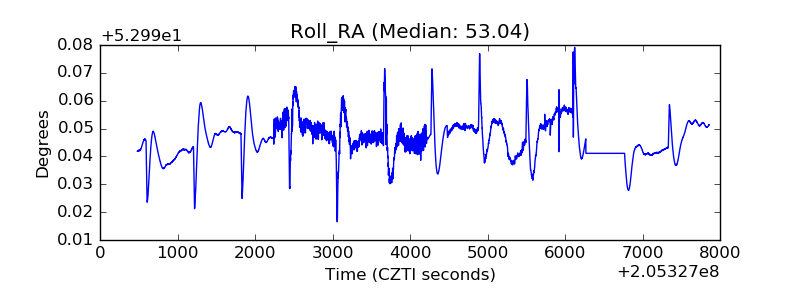 |
| Veto Counter | 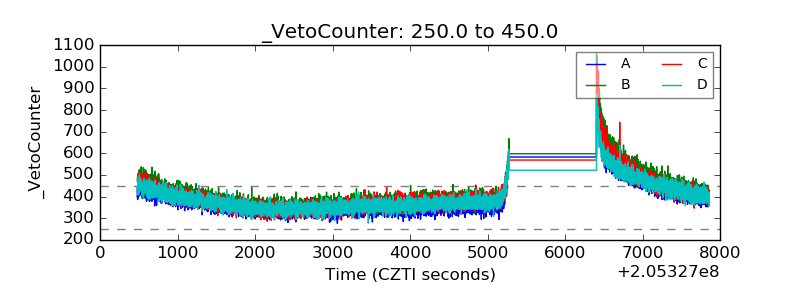 |