| Param | Original file | Final file |
|---|---|---|
| Filename | modeM0/AS1G05_240T01_9000000536_04153cztM0_level2.evt | modeM0/AS1G05_240T01_9000000536_04153cztM0_level2_quad_clean.evt |
| Size (bytes) | 405,529,920 | 51,670,080 |
| Size | 386.7 MB | 49.3 MB |
| Events in quadrant A | 3,067,272 | 290,731 |
| Events in quadrant B | 3,067,390 | 295,624 |
| Events in quadrant C | 2,829,437 | 283,664 |
| Events in quadrant D | 2,908,569 | 274,137 |
| Mode SS | |||
|---|---|---|---|
| Quadrant | BADHDUFLAG | Total packets | Discarded packets |
| A | 0 | 122 | 0 |
| B | 0 | 122 | 0 |
| C | 0 | 122 | 0 |
| D | 0 | 122 | 0 |
| Mode M9 | |||
|---|---|---|---|
| Quadrant | BADHDUFLAG | Total packets | Discarded packets |
| A | 0 | 13 | 0 |
| B | 0 | 13 | 0 |
| C | 0 | 13 | 0 |
| D | 0 | 13 | 0 |
| Mode M0 | |||
|---|---|---|---|
| Quadrant | BADHDUFLAG | Total packets | Discarded packets |
| A | 0 | 12748 | 2 |
| B | 0 | 12703 | 1 |
| C | 0 | 12258 | 1 |
| D | 0 | 12650 | 1 |
| Quadrant | Total seconds | Saturated seconds | Saturation percentage |
|---|---|---|---|
| A | 6011 | 40 | 0.665447% |
| B | 6011 | 51 | 0.848445% |
| C | 6011 | 25 | 0.415904% |
| D | 6011 | 26 | 0.432540% |
Noise dominated data is calculated using 1-second bins in cleaned event files. If a bin has >2000 counts, and if more than 50% of those come from <1% of pixels, then it is considered to be noise-dominated and hence unusable.
| Quadrant | # 1 sec bins | Bins with >0 counts | Bins with >2000 counts | High rate bins dominated by noise | Noise dominated (total time) | Noise dominated (detector-on time) | Marked lightcurve |
|---|---|---|---|---|---|---|---|
| A | 7316 | 6012 | 2 | 2 | 0.03% | 0.03% | 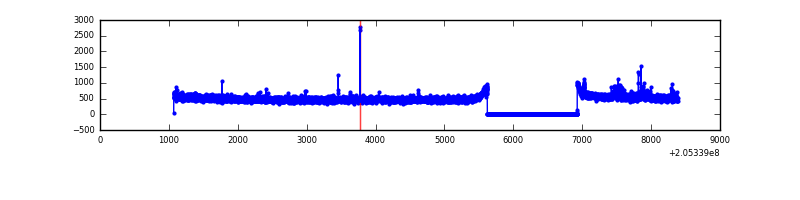 |
| B | 7316 | 6012 | 2 | 2 | 0.03% | 0.03% | 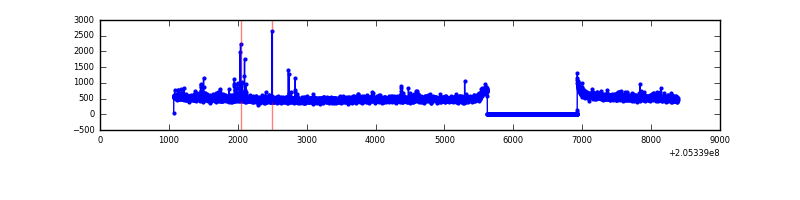 |
| C | 7316 | 6012 | 0 | 0 | 0.00% | 0.00% |  |
| D | 7316 | 6012 | 1 | 1 | 0.01% | 0.02% | 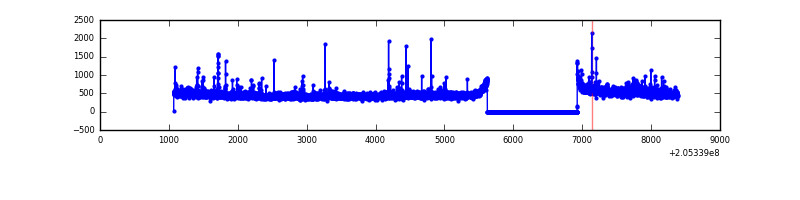 |
Top three noisy pixels from each quadrant. If the there are fewer than three noisy pixels in the level2.evt file, extra rows are filled as -1
| Pixel properties | Quadrant properties | ||||||
|---|---|---|---|---|---|---|---|
| Quadrant | DetID | PixID | Counts | Sigma | Mean | Median | Sigma |
| A | 3 | 1 | 42729 | 270.1 | 759 | 744 | 155.4 |
| A | 0 | 199 | 39598 | 249.96 | 759 | 744 | 155.4 |
| A | 13 | 14 | 17174 | 105.7 | 759 | 744 | 155.4 |
| B | 10 | 16 | 34099 | 227.86 | 763 | 749 | 146.4 |
| B | 0 | 183 | 19796 | 130.14 | 763 | 749 | 146.4 |
| B | 15 | 204 | 19789 | 130.09 | 763 | 749 | 146.4 |
| C | 13 | 61 | 6108 | 32.03 | 724 | 729 | 167.9 |
| C | 8 | 222 | 2295 | 9.33 | 724 | 729 | 167.9 |
| C | 3 | 202 | 1754 | 6.1 | 724 | 729 | 167.9 |
| D | 2 | 63 | 39434 | 223.41 | 724 | 706 | 173.3 |
| D | 2 | 232 | 28416 | 159.85 | 724 | 706 | 173.3 |
| D | 13 | 137 | 24827 | 139.15 | 724 | 706 | 173.3 |
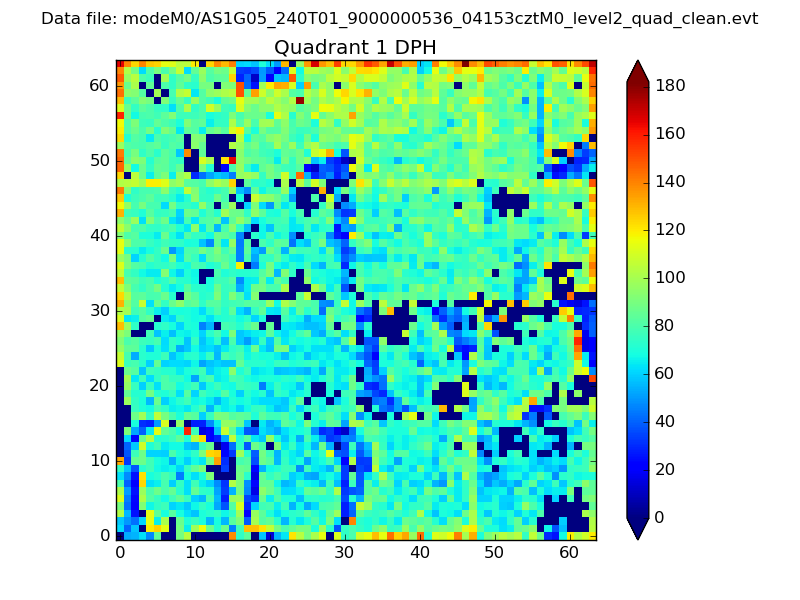
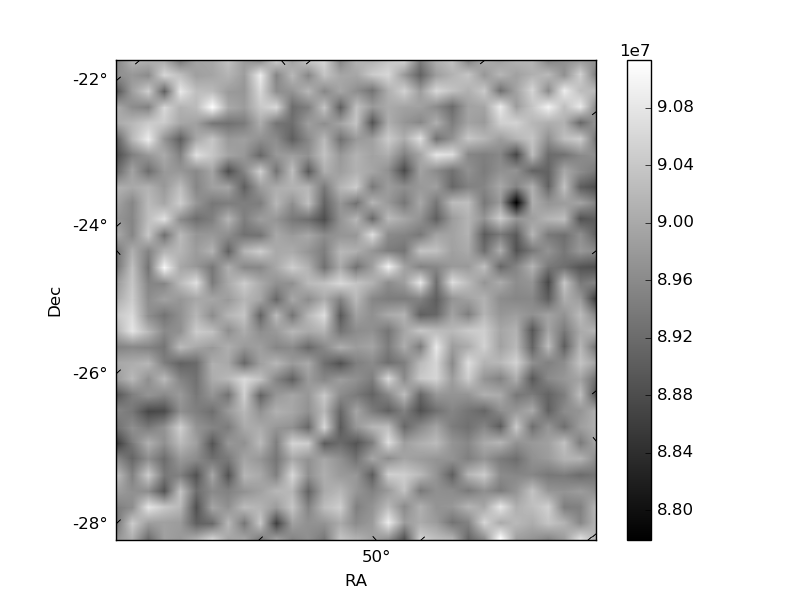
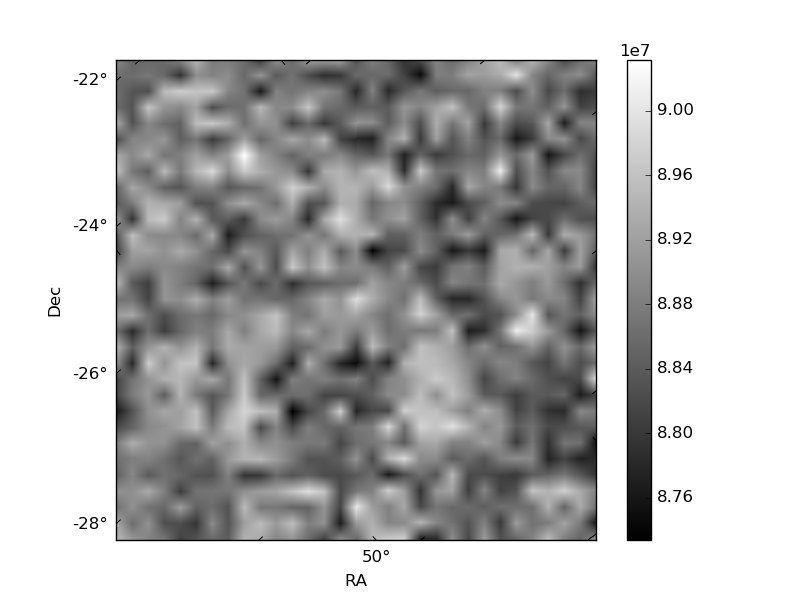
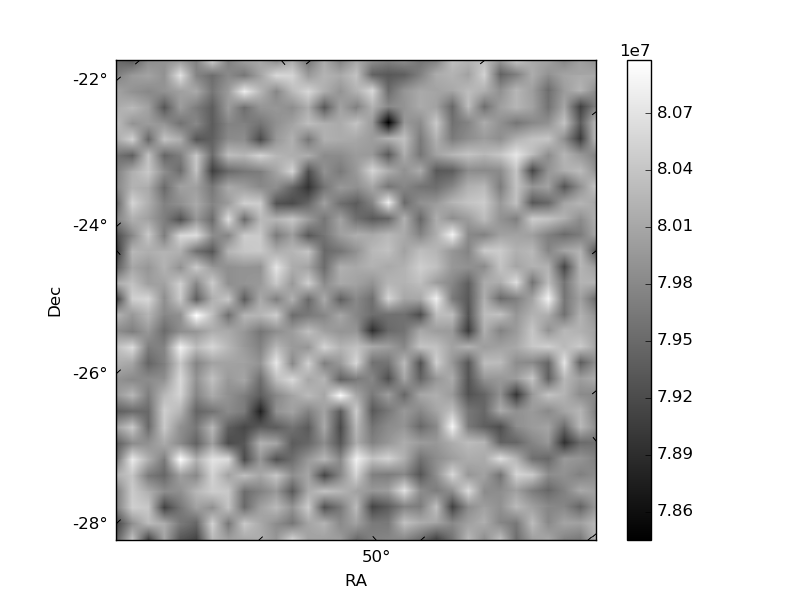
Histogram calculated using DETX and DETY for each event in the final _common_clean file
| Quadrant A | 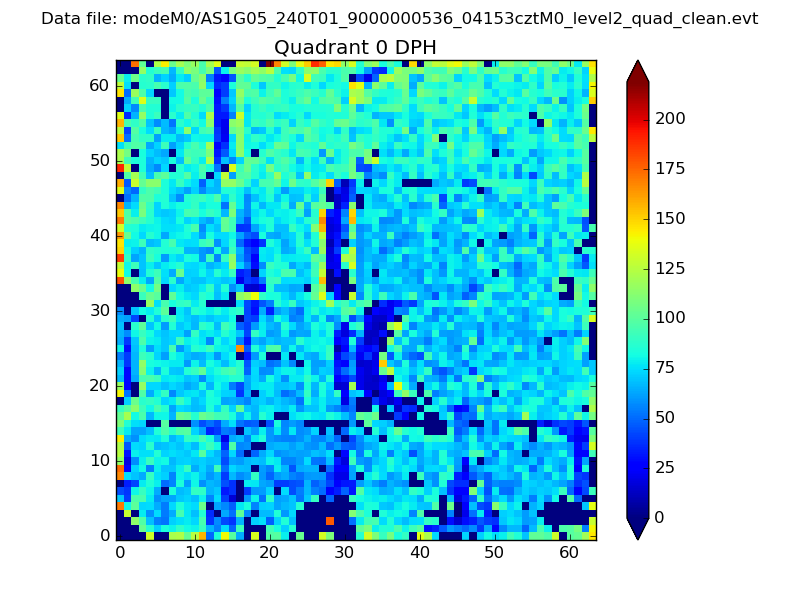 |
 |
Quadrant B |
|---|---|---|---|
| Quadrant D | 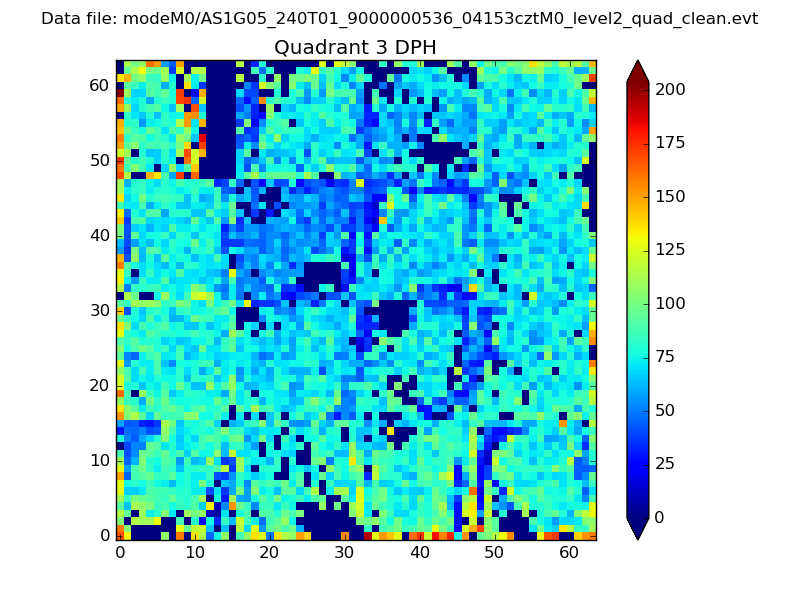 |
 |
Quadrant C |
| Plot type | Count rate plots | Images |
|---|---|---|
| Comparison with Poisson distribution Blue bars denote a histogram of data divided into 1 sec bins. Red curve is a Poisson curve with rate = median count rate of data. |
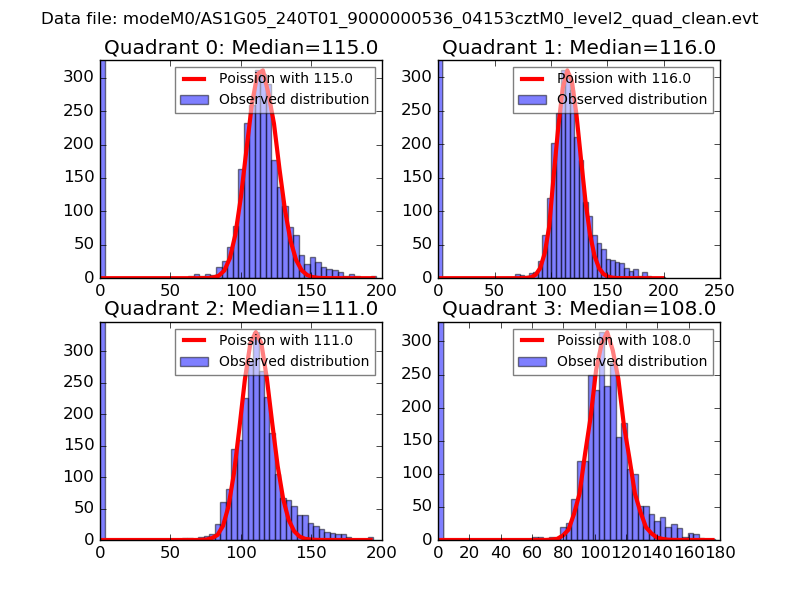 |
 |
| Quadrant-wise count rates Data is divided into 100 sec bins |
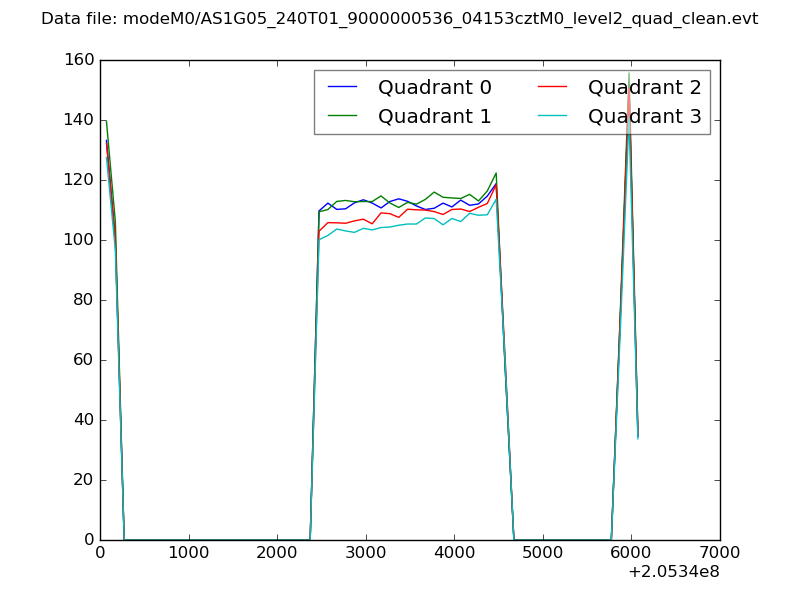 |
|
| Module-wise count rates for Quadrant A Data is divided into 100 sec bins |
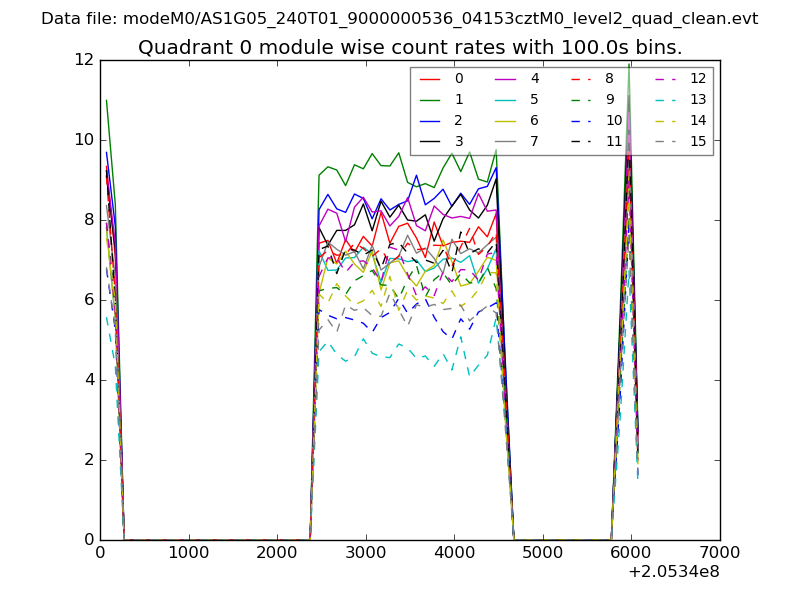 |
 |
| Module-wise count rates for Quadrant B Data is divided into 100 sec bins |
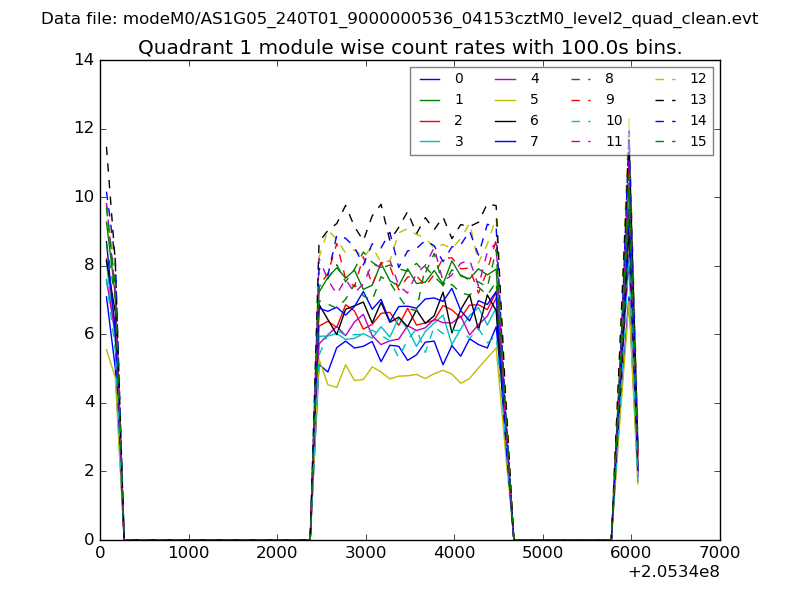 |
 |
| Module-wise count rates for Quadrant C Data is divided into 100 sec bins |
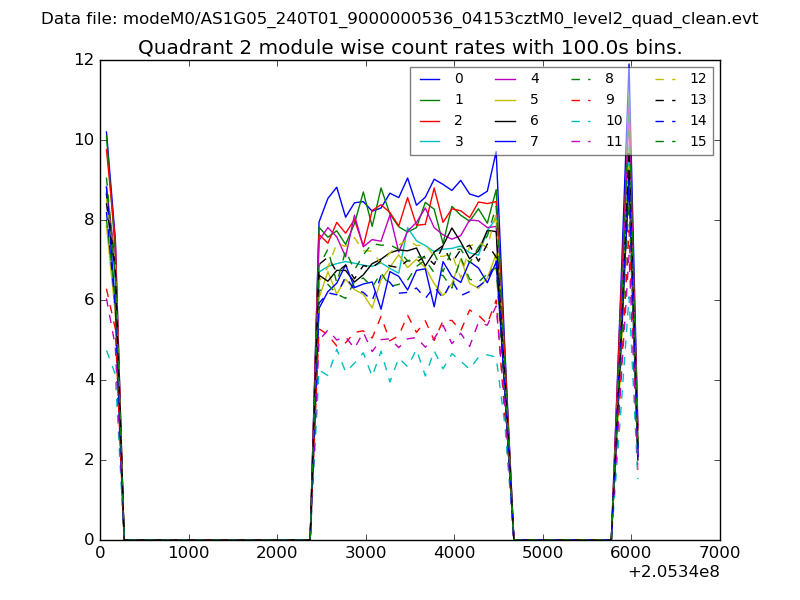 |
 |
| Module-wise count rates for Quadrant D Data is divided into 100 sec bins |
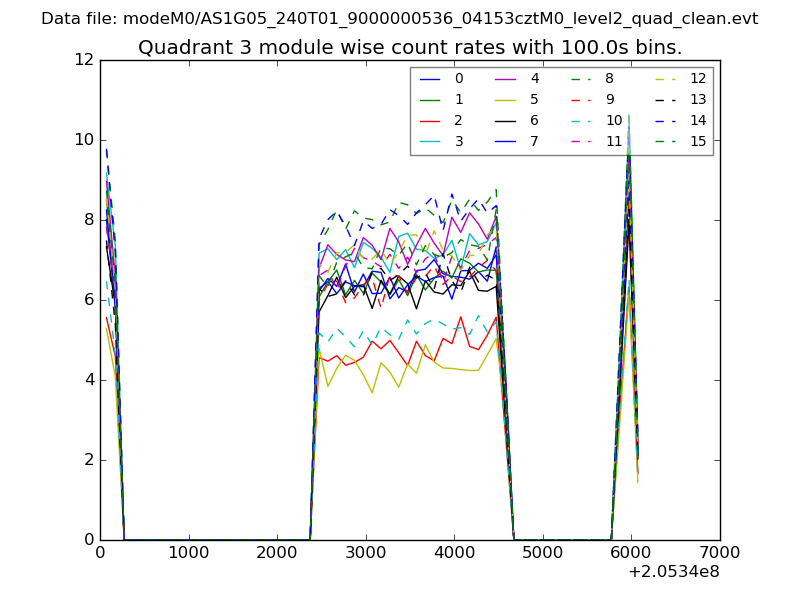 |
 |
| Parameter | Plot |
|---|---|
| CZT HV Monitor | 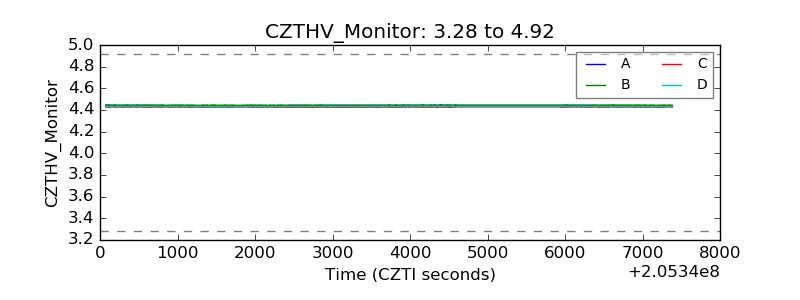 |
| D_VDD | 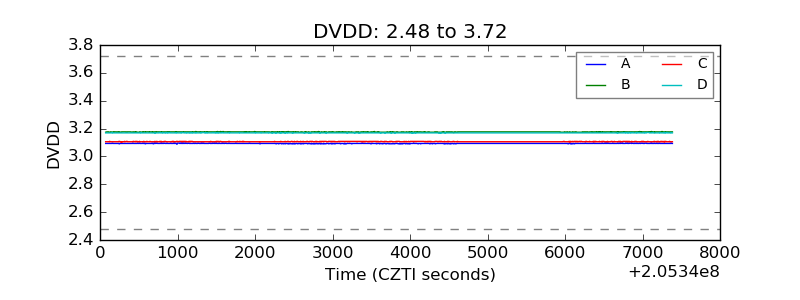 |
| Temperature 1 | 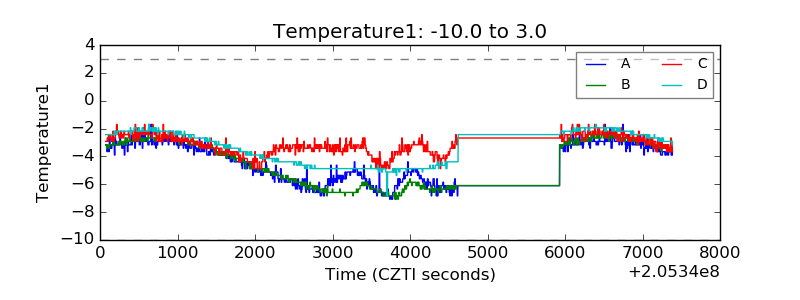 |
| Veto HV Monitor | 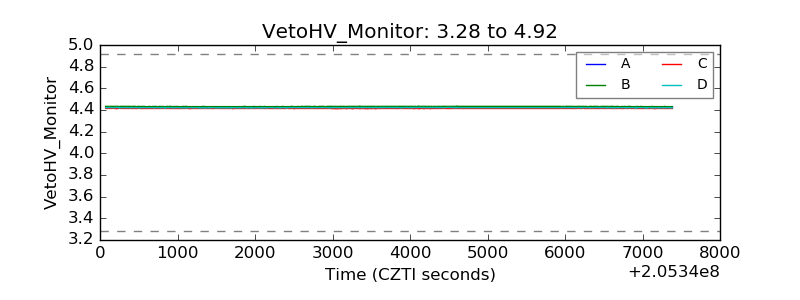 |
| Veto LLD | 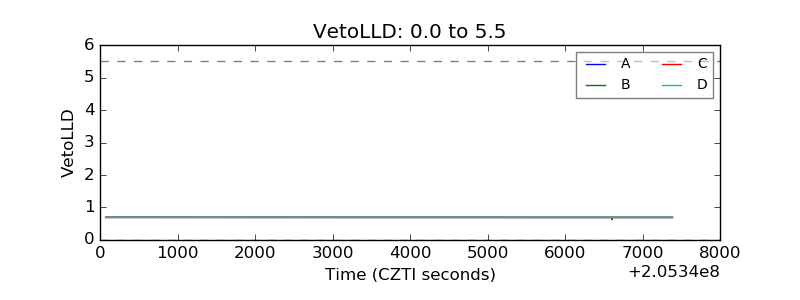 |
| Alpha Counter | 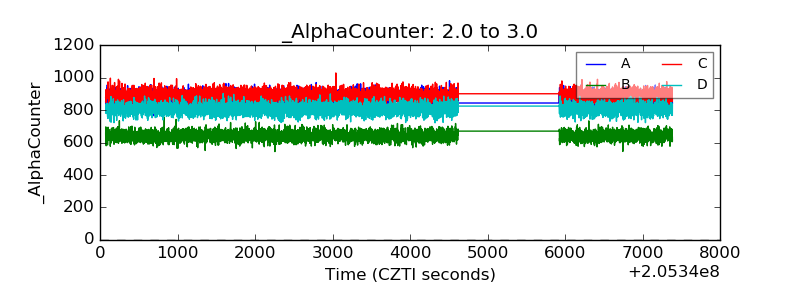 |
| _CPM_Rate | 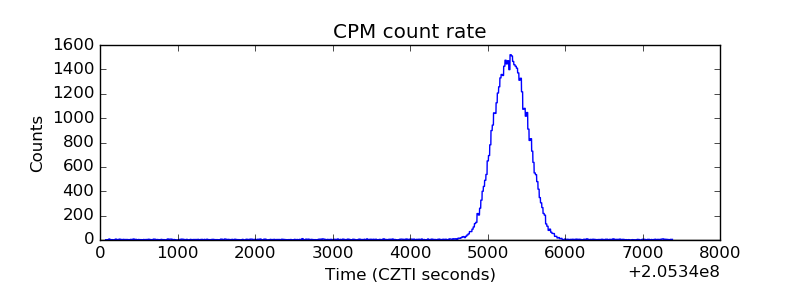 |
| CZT Counter |  |
| +2.5 Volts monitor | 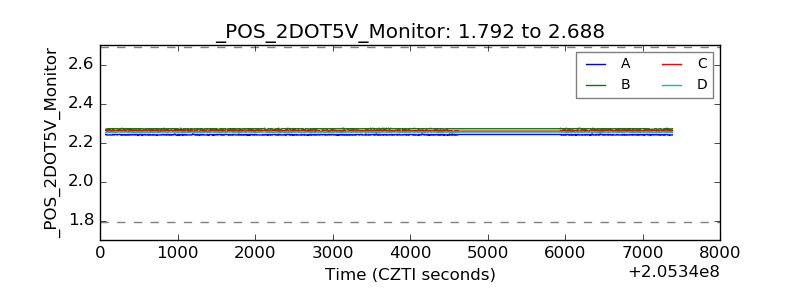 |
| +5 Volts monitor |  |
| _ROLL_ROT | 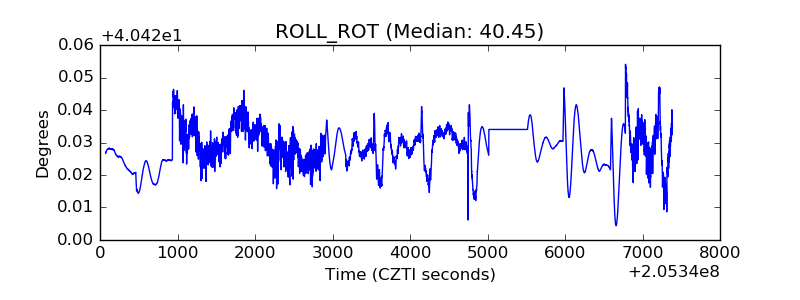 |
| _Roll_DEC | 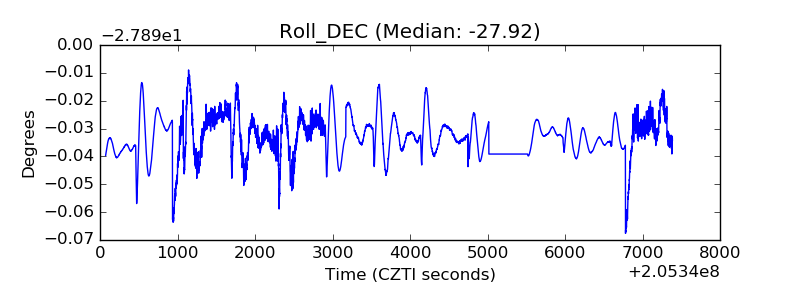 |
| _Roll_RA | 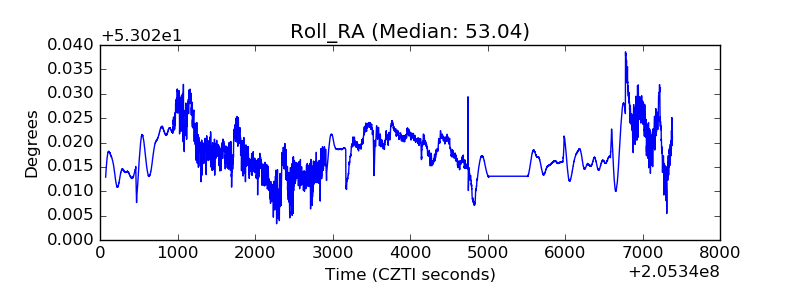 |
| Veto Counter | 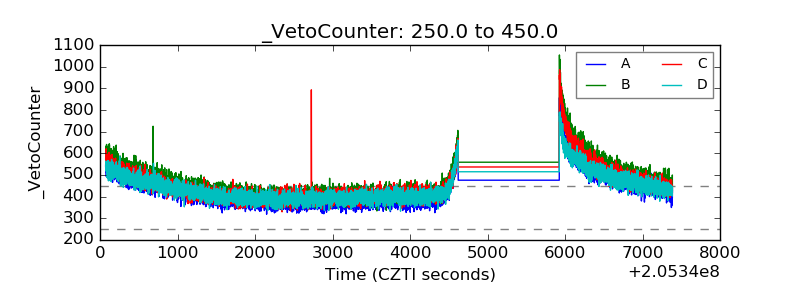 |