| Param | Original file | Final file |
|---|---|---|
| Filename | modeM0/AS1G05_240T01_9000000536_04155cztM0_level2.evt | modeM0/AS1G05_240T01_9000000536_04155cztM0_level2_quad_clean.evt |
| Size (bytes) | 449,216,640 | 58,046,400 |
| Size | 428.4 MB | 55.4 MB |
| Events in quadrant A | 3,559,092 | 335,044 |
| Events in quadrant B | 3,509,645 | 337,050 |
| Events in quadrant C | 2,989,339 | 327,429 |
| Events in quadrant D | 3,117,395 | 317,106 |
| Mode SS | |||
|---|---|---|---|
| Quadrant | BADHDUFLAG | Total packets | Discarded packets |
| A | 0 | 126 | 0 |
| B | 0 | 126 | 0 |
| C | 0 | 126 | 0 |
| D | 0 | 126 | 0 |
| Mode M9 | |||
|---|---|---|---|
| Quadrant | BADHDUFLAG | Total packets | Discarded packets |
| A | 0 | 15 | 0 |
| B | 0 | 15 | 0 |
| C | 0 | 15 | 0 |
| D | 0 | 16 | 0 |
| Mode M0 | |||
|---|---|---|---|
| Quadrant | BADHDUFLAG | Total packets | Discarded packets |
| A | 0 | 14548 | 3 |
| B | 0 | 14282 | 2 |
| C | 0 | 13086 | 2 |
| D | 0 | 13633 | 2 |
| Quadrant | Total seconds | Saturated seconds | Saturation percentage |
|---|---|---|---|
| A | 6322 | 169 | 2.673205% |
| B | 6322 | 155 | 2.451756% |
| C | 6322 | 46 | 0.727618% |
| D | 6322 | 70 | 1.107245% |
Noise dominated data is calculated using 1-second bins in cleaned event files. If a bin has >2000 counts, and if more than 50% of those come from <1% of pixels, then it is considered to be noise-dominated and hence unusable.
| Quadrant | # 1 sec bins | Bins with >0 counts | Bins with >2000 counts | High rate bins dominated by noise | Noise dominated (total time) | Noise dominated (detector-on time) | Marked lightcurve |
|---|---|---|---|---|---|---|---|
| A | 7547 | 6323 | 23 | 23 | 0.30% | 0.36% |  |
| B | 7547 | 6323 | 31 | 31 | 0.41% | 0.49% | 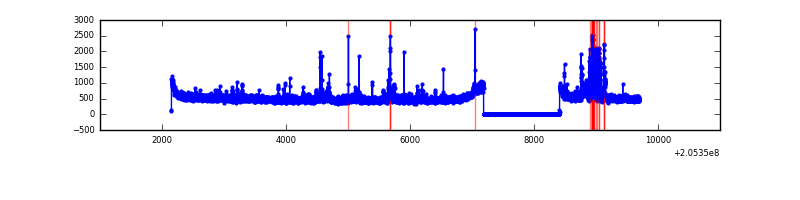 |
| C | 7547 | 6323 | 0 | 0 | 0.00% | 0.00% | 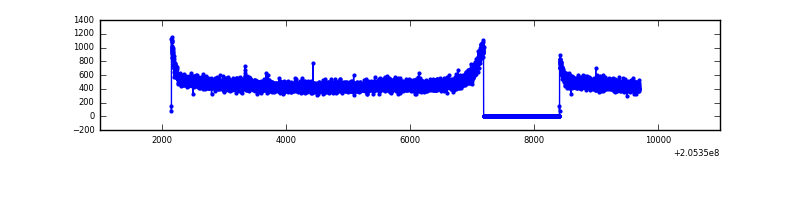 |
| D | 7547 | 6323 | 21 | 21 | 0.28% | 0.33% | 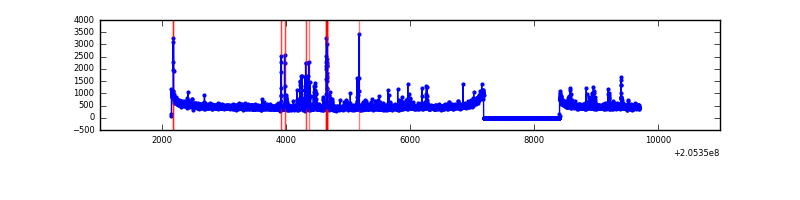 |
Top three noisy pixels from each quadrant. If the there are fewer than three noisy pixels in the level2.evt file, extra rows are filled as -1
| Pixel properties | Quadrant properties | ||||||
|---|---|---|---|---|---|---|---|
| Quadrant | DetID | PixID | Counts | Sigma | Mean | Median | Sigma |
| A | 0 | 199 | 226521 | 1408.16 | 791 | 775 | 160.3 |
| A | 14 | 111 | 99017 | 612.82 | 791 | 775 | 160.3 |
| A | 0 | 50 | 66425 | 409.51 | 791 | 775 | 160.3 |
| B | 10 | 16 | 258384 | 1676.56 | 801 | 784 | 153.6 |
| B | 14 | 167 | 70714 | 455.13 | 801 | 784 | 153.6 |
| B | 0 | 183 | 28289 | 179.01 | 801 | 784 | 153.6 |
| C | 13 | 61 | 6308 | 31.37 | 762 | 767 | 176.7 |
| C | 8 | 128 | 3970 | 18.13 | 762 | 767 | 176.7 |
| C | 8 | 222 | 2835 | 11.71 | 762 | 767 | 176.7 |
| D | 12 | 233 | 84873 | 459.45 | 761 | 739 | 183.1 |
| D | 10 | 172 | 72047 | 389.41 | 761 | 739 | 183.1 |
| D | 2 | 14 | 29549 | 157.33 | 761 | 739 | 183.1 |
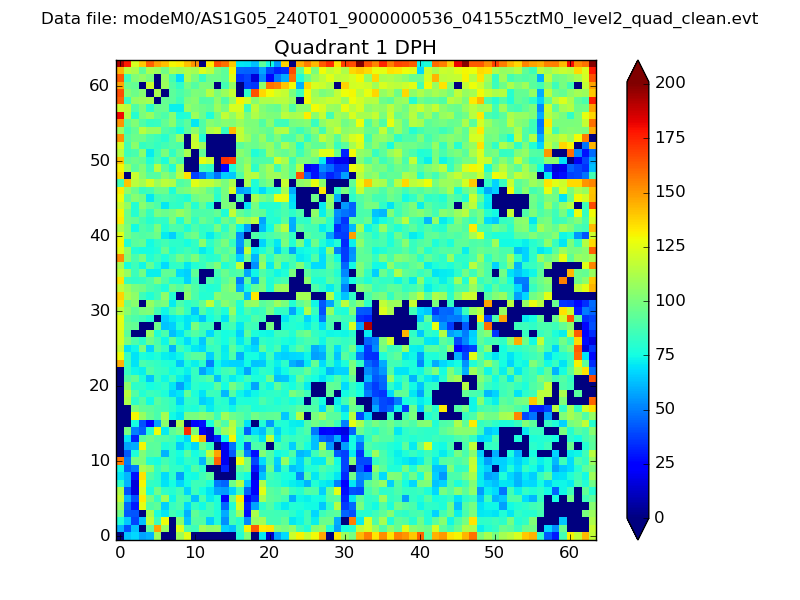
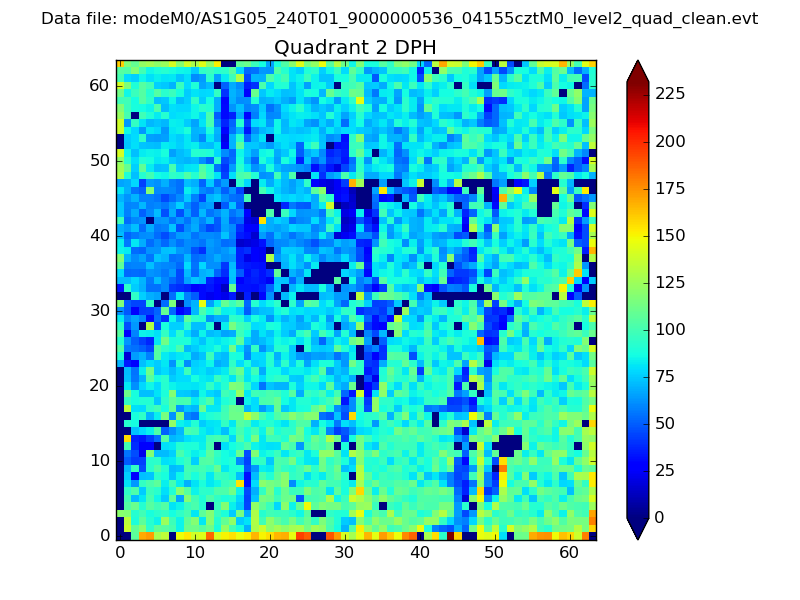
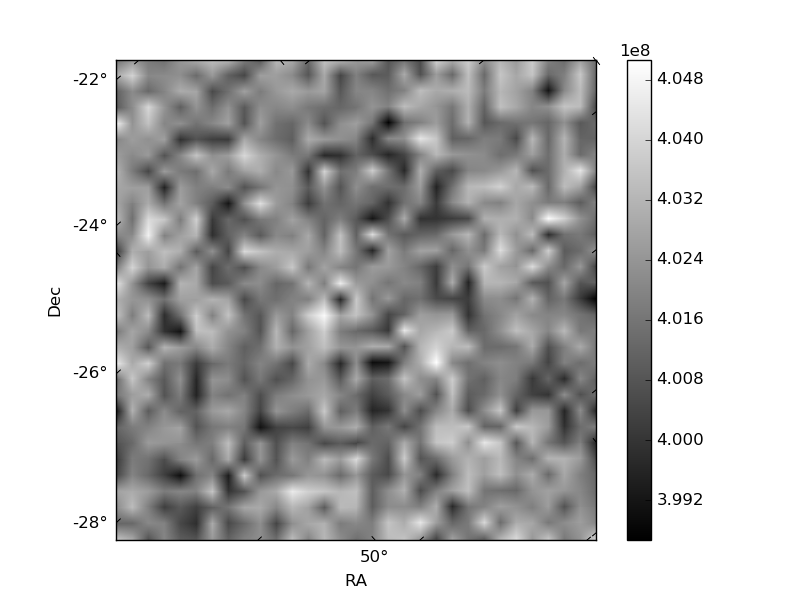
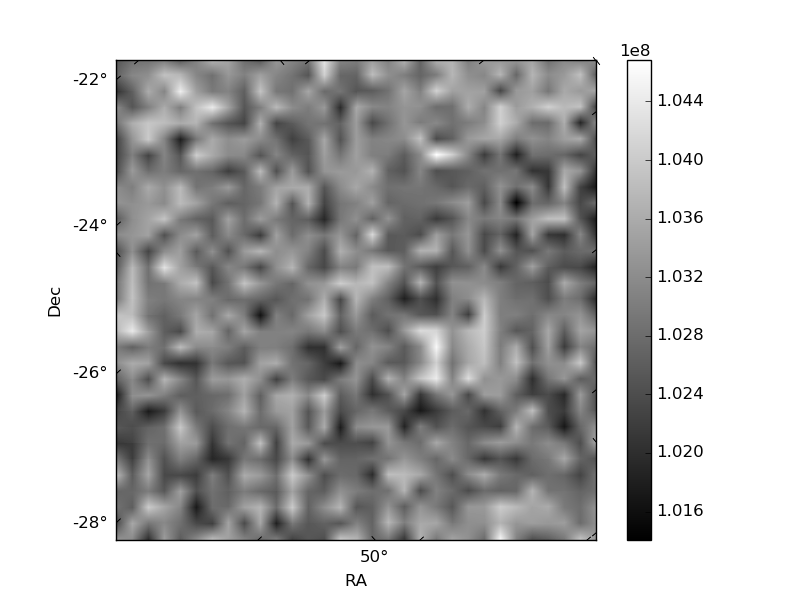
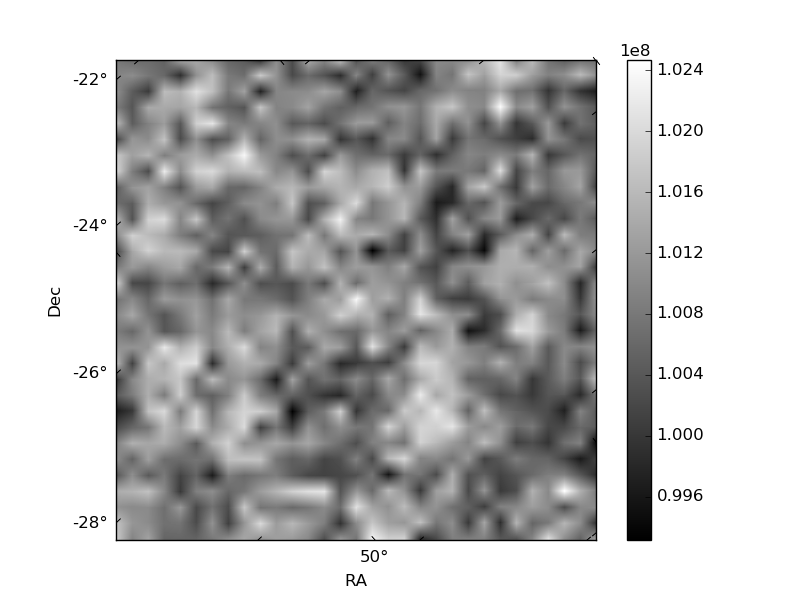
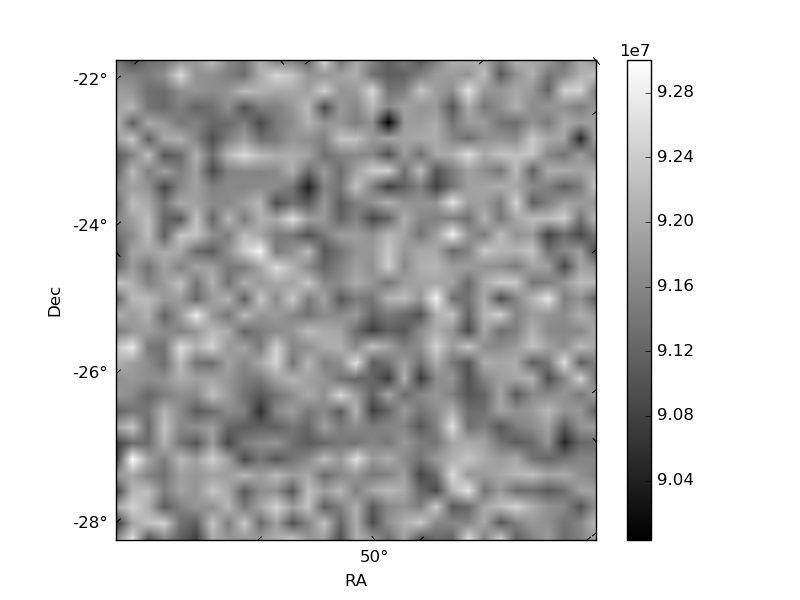
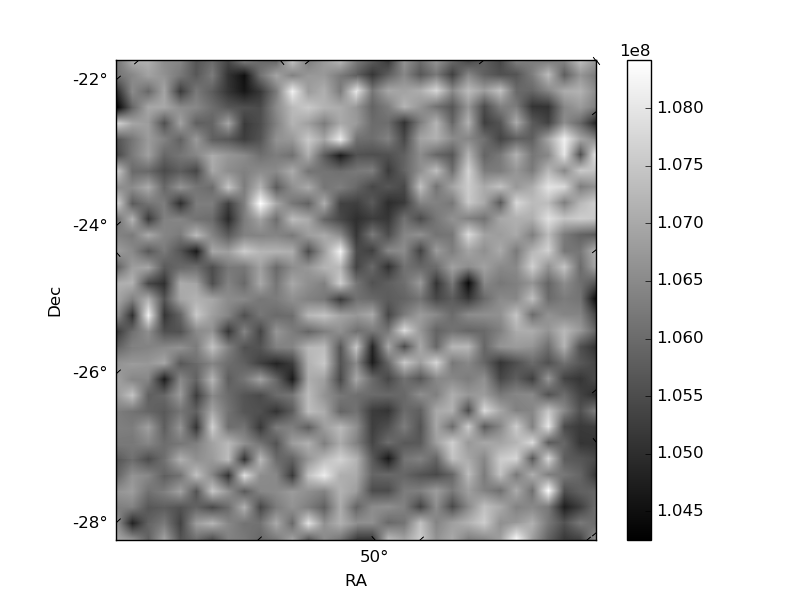
Histogram calculated using DETX and DETY for each event in the final _common_clean file
| Quadrant A | 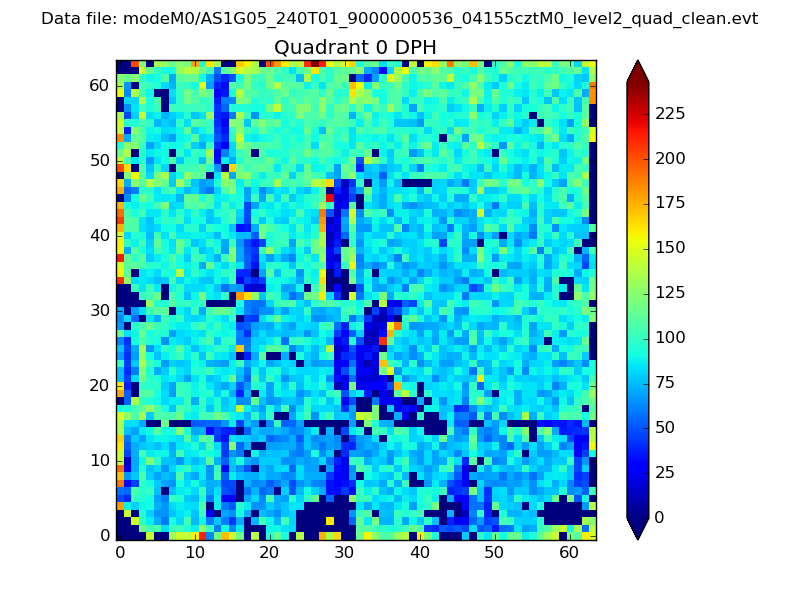 |
 |
Quadrant B |
|---|---|---|---|
| Quadrant D | 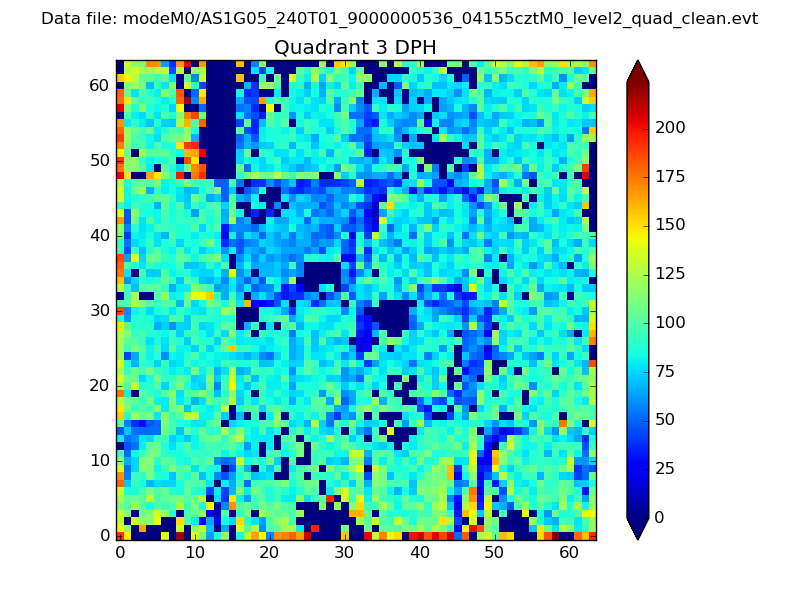 |
 |
Quadrant C |
| Plot type | Count rate plots | Images |
|---|---|---|
| Comparison with Poisson distribution Blue bars denote a histogram of data divided into 1 sec bins. Red curve is a Poisson curve with rate = median count rate of data. |
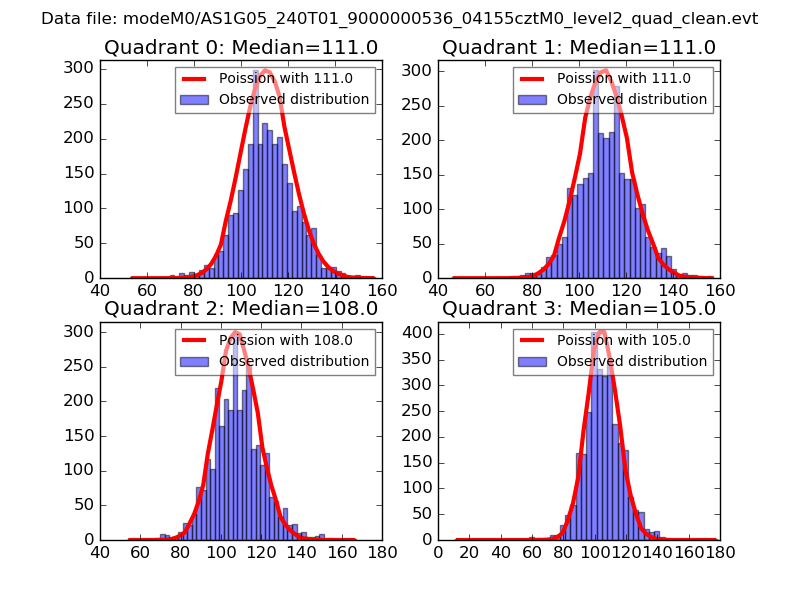 |
 |
| Quadrant-wise count rates Data is divided into 100 sec bins |
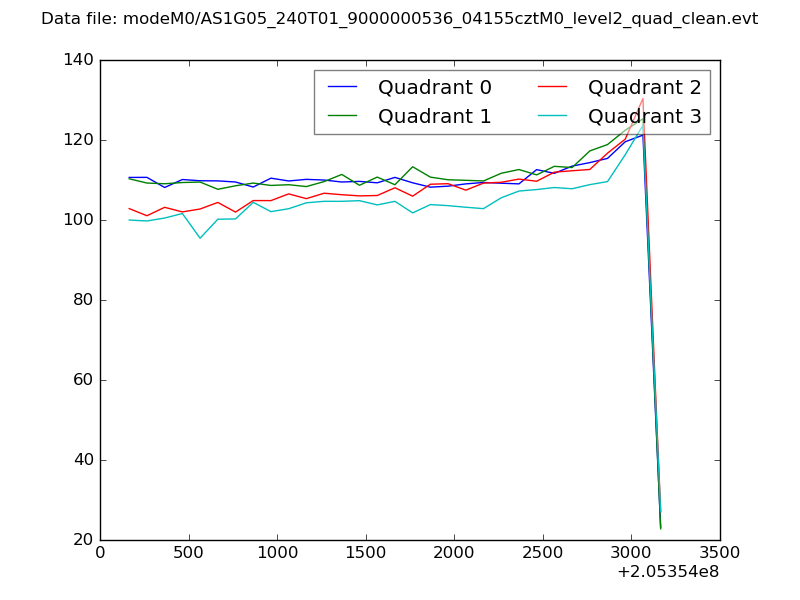 |
|
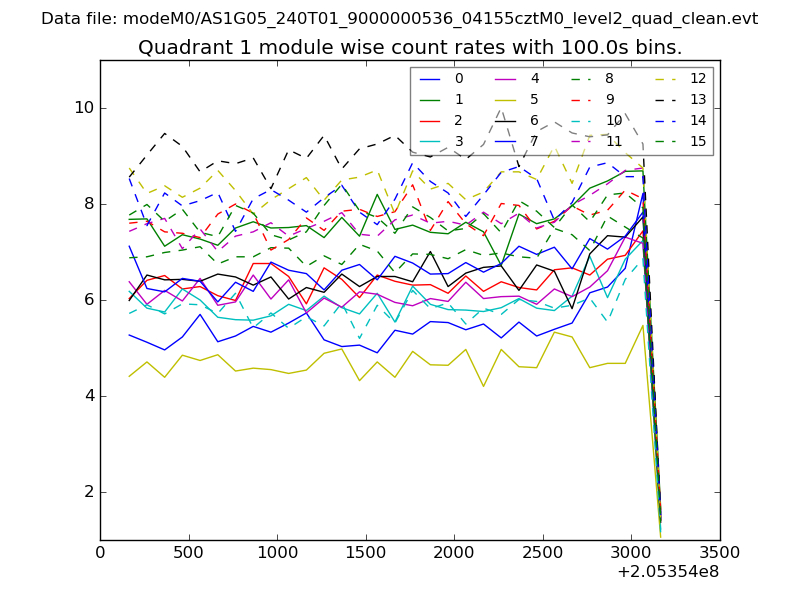
| Module-wise count rates for Quadrant A Data is divided into 100 sec bins |
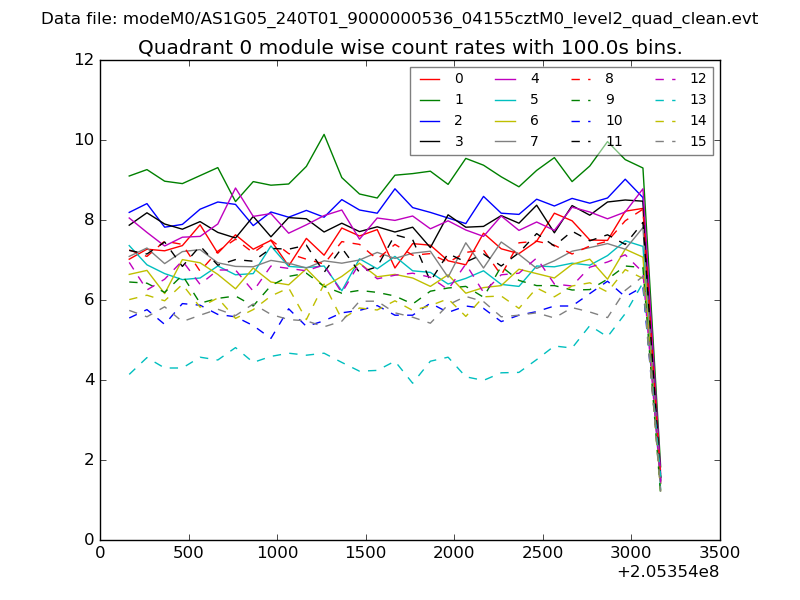 |
 |
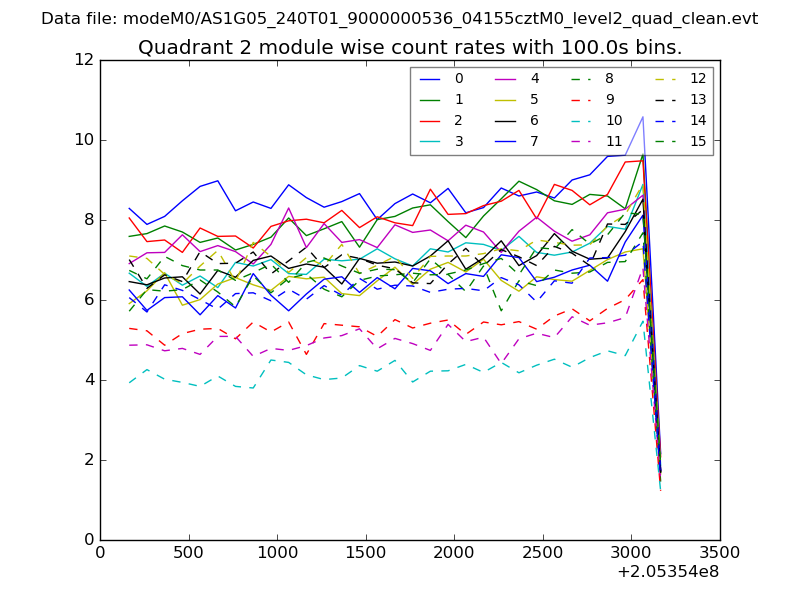
| Module-wise count rates for Quadrant B Data is divided into 100 sec bins |
 |
 |
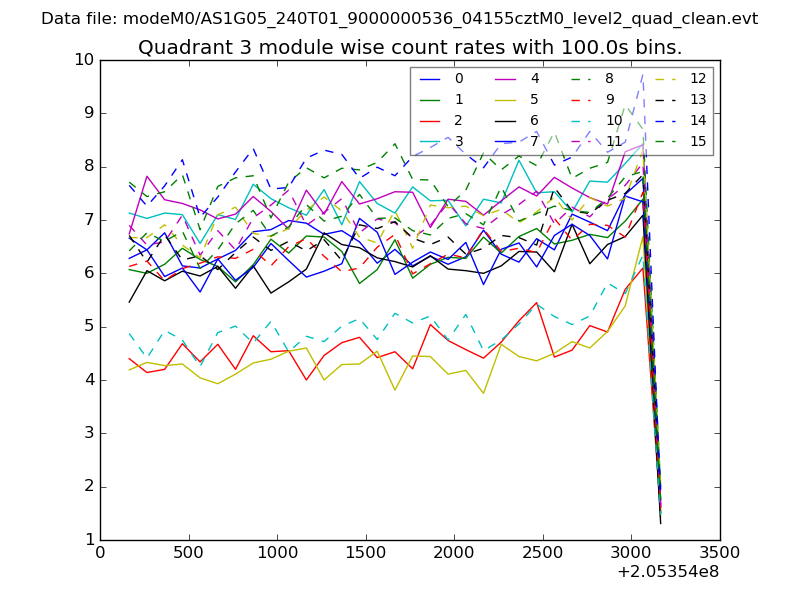
| Module-wise count rates for Quadrant C Data is divided into 100 sec bins |
 |
 |
| Module-wise count rates for Quadrant D Data is divided into 100 sec bins |
 |
 |
| Parameter | Plot |
|---|---|
| CZT HV Monitor | 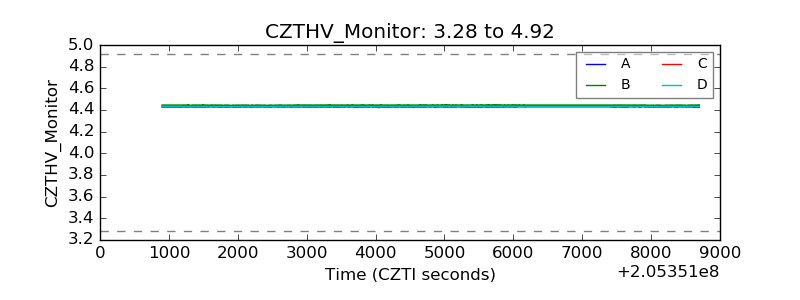 |
| D_VDD | 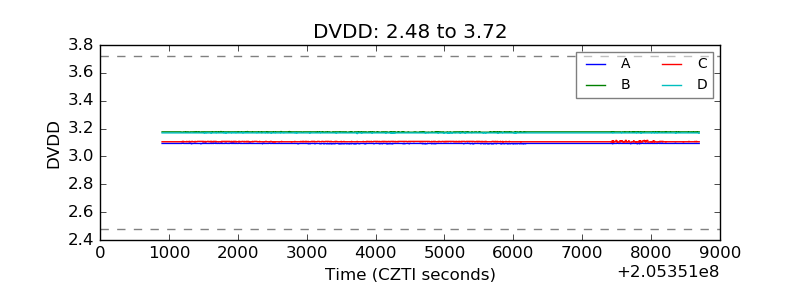 |
| Temperature 1 | 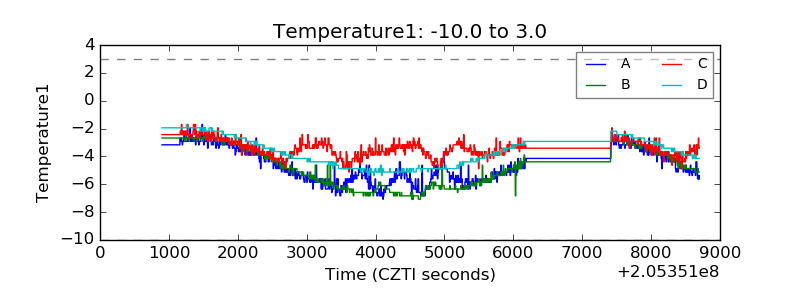 |
| Veto HV Monitor | 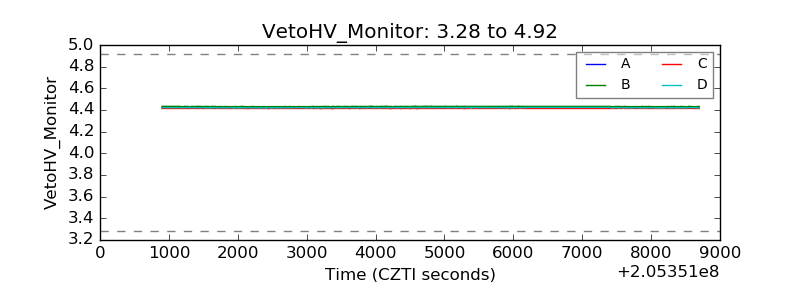 |
| Veto LLD | 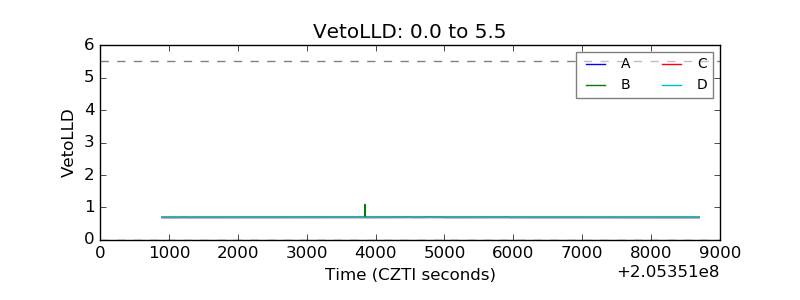 |
| Alpha Counter | 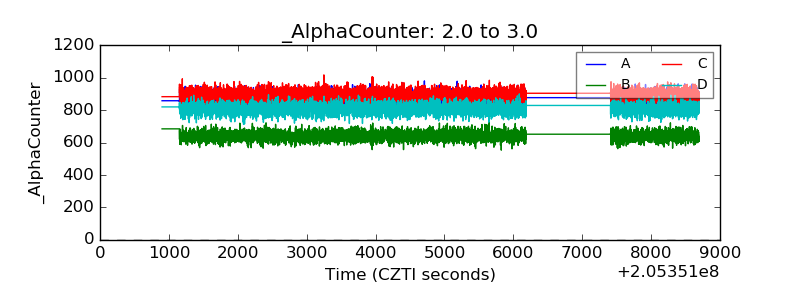 |
| _CPM_Rate | 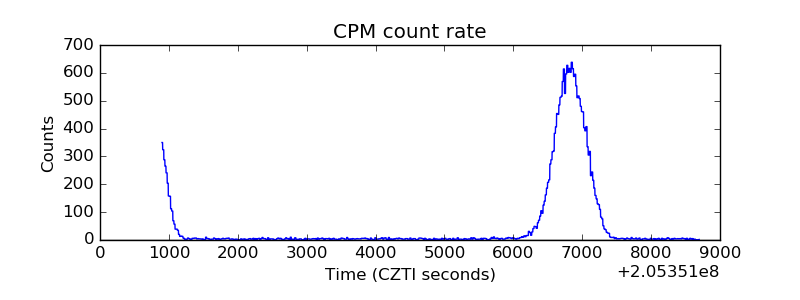 |
| CZT Counter | 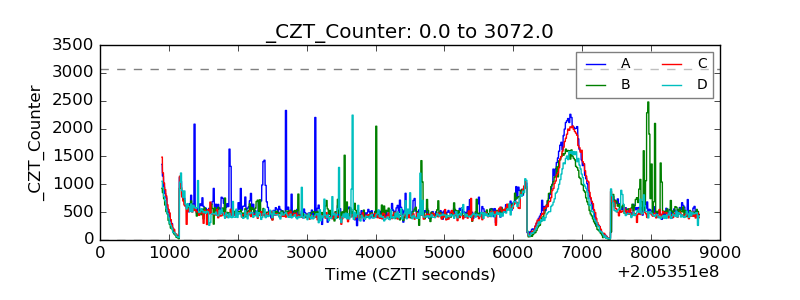 |
| +2.5 Volts monitor |  |
| +5 Volts monitor |  |
| _ROLL_ROT | 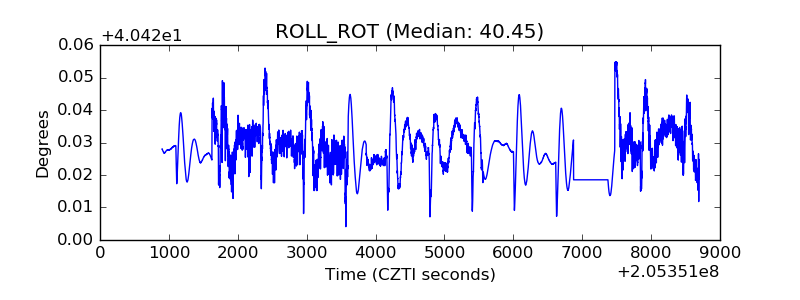 |
| _Roll_DEC | 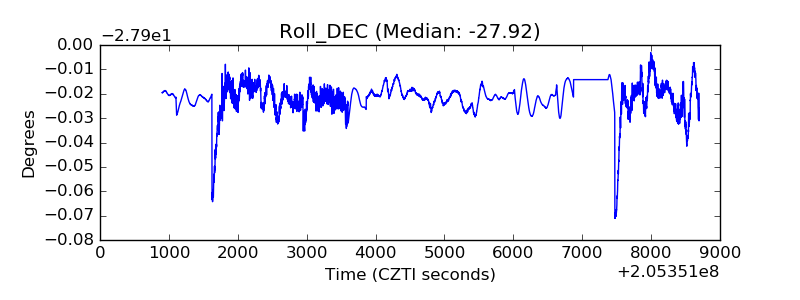 |
| _Roll_RA | 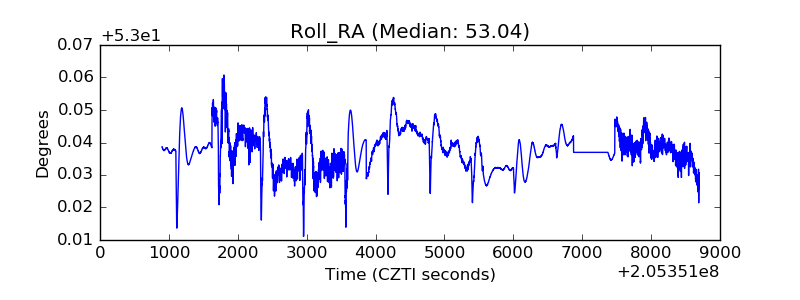 |
| Veto Counter | 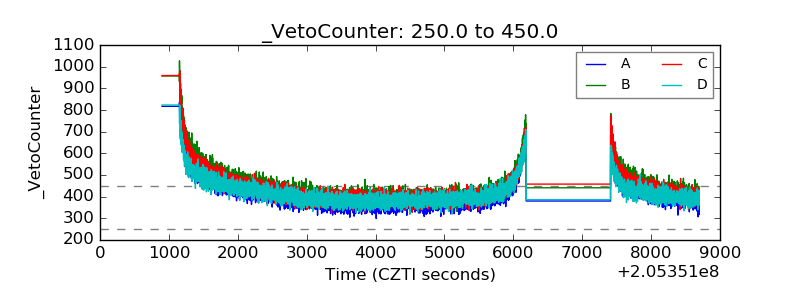 |