| Param | Original file | Final file |
|---|---|---|
| Filename | modeM0/AS1G05_240T01_9000000536_04156cztM0_level2.evt | modeM0/AS1G05_240T01_9000000536_04156cztM0_level2_quad_clean.evt |
| Size (bytes) | 446,512,320 | 66,602,880 |
| Size | 425.8 MB | 63.5 MB |
| Events in quadrant A | 3,239,810 | 396,361 |
| Events in quadrant B | 3,525,175 | 397,141 |
| Events in quadrant C | 3,021,559 | 390,427 |
| Events in quadrant D | 3,289,318 | 374,359 |
| Mode SS | |||
|---|---|---|---|
| Quadrant | BADHDUFLAG | Total packets | Discarded packets |
| A | 0 | 132 | 0 |
| B | 0 | 132 | 0 |
| C | 0 | 132 | 0 |
| D | 0 | 132 | 0 |
| Mode M9 | |||
|---|---|---|---|
| Quadrant | BADHDUFLAG | Total packets | Discarded packets |
| A | 0 | 10 | 0 |
| B | 0 | 10 | 0 |
| C | 0 | 10 | 0 |
| D | 0 | 11 | 0 |
| Mode M0 | |||
|---|---|---|---|
| Quadrant | BADHDUFLAG | Total packets | Discarded packets |
| A | 0 | 13865 | 3 |
| B | 0 | 14780 | 2 |
| C | 0 | 13541 | 2 |
| D | 0 | 14426 | 2 |
| Quadrant | Total seconds | Saturated seconds | Saturation percentage |
|---|---|---|---|
| A | 6576 | 86 | 1.307786% |
| B | 6576 | 153 | 2.326642% |
| C | 6576 | 59 | 0.897202% |
| D | 6576 | 105 | 1.596715% |
Noise dominated data is calculated using 1-second bins in cleaned event files. If a bin has >2000 counts, and if more than 50% of those come from <1% of pixels, then it is considered to be noise-dominated and hence unusable.
| Quadrant | # 1 sec bins | Bins with >0 counts | Bins with >2000 counts | High rate bins dominated by noise | Noise dominated (total time) | Noise dominated (detector-on time) | Marked lightcurve |
|---|---|---|---|---|---|---|---|
| A | 7541 | 6577 | 3 | 3 | 0.04% | 0.05% | 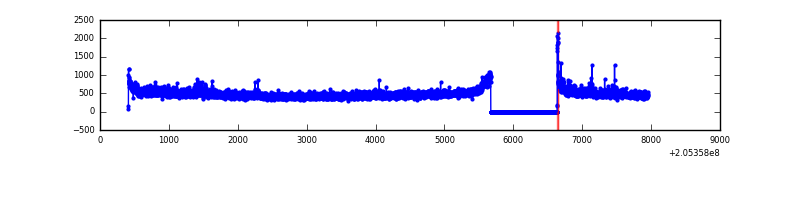 |
| B | 7541 | 6577 | 55 | 55 | 0.73% | 0.84% |  |
| C | 7541 | 6577 | 3 | 3 | 0.04% | 0.05% | 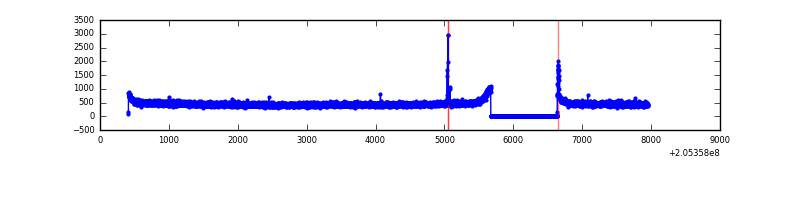 |
| D | 7541 | 6577 | 51 | 51 | 0.68% | 0.78% |  |
Top three noisy pixels from each quadrant. If the there are fewer than three noisy pixels in the level2.evt file, extra rows are filled as -1
| Pixel properties | Quadrant properties | ||||||
|---|---|---|---|---|---|---|---|
| Quadrant | DetID | PixID | Counts | Sigma | Mean | Median | Sigma |
| A | 0 | 199 | 97021 | 594.24 | 790 | 775 | 162.0 |
| A | 3 | 1 | 42899 | 260.08 | 790 | 775 | 162.0 |
| A | 8 | 15 | 35380 | 213.66 | 790 | 775 | 162.0 |
| B | 10 | 16 | 351774 | 2280.98 | 798 | 778 | 153.9 |
| B | 0 | 183 | 22366 | 140.29 | 798 | 778 | 153.9 |
| B | 4 | 81 | 21465 | 134.44 | 798 | 778 | 153.9 |
| C | 7 | 222 | 30969 | 169.99 | 763 | 767 | 177.7 |
| C | 13 | 61 | 6187 | 30.51 | 763 | 767 | 177.7 |
| C | 8 | 128 | 3898 | 17.62 | 763 | 767 | 177.7 |
| D | 10 | 172 | 247040 | 1339.84 | 761 | 739 | 183.8 |
| D | 13 | 239 | 48229 | 258.34 | 761 | 739 | 183.8 |
| D | 2 | 14 | 41114 | 219.63 | 761 | 739 | 183.8 |
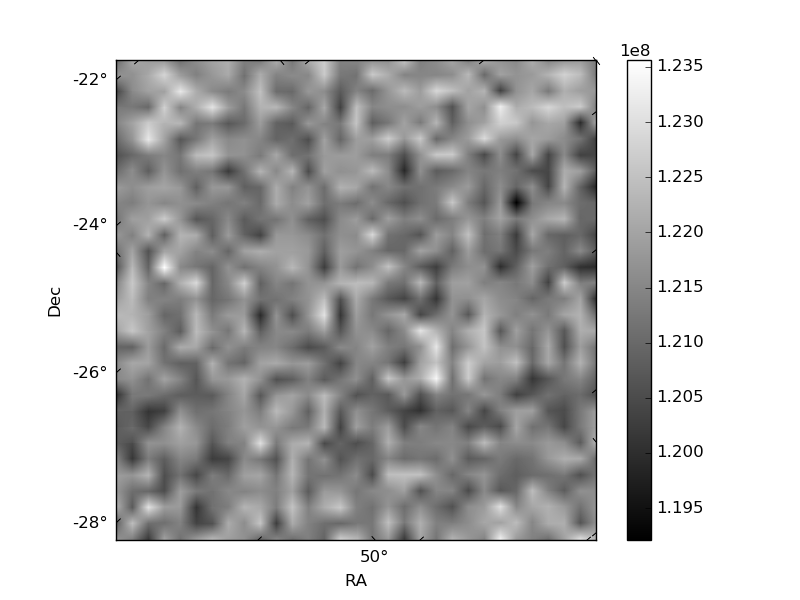
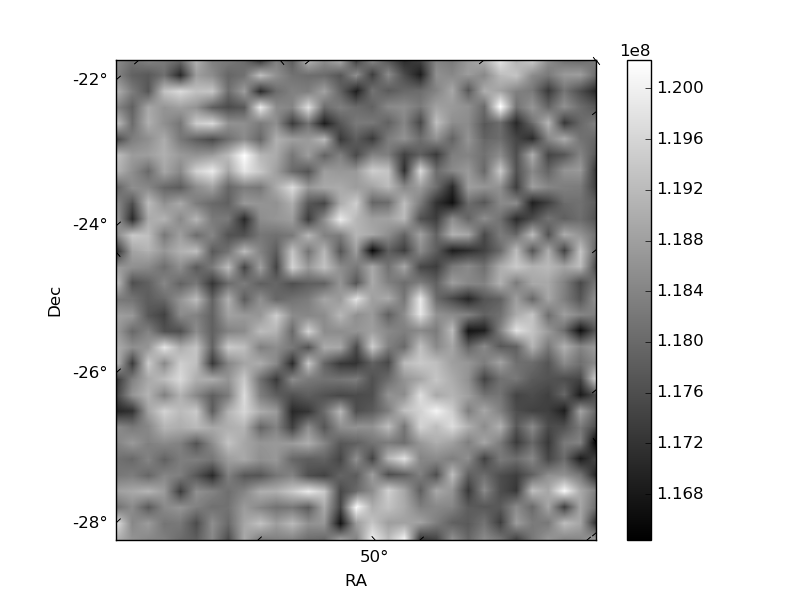
Histogram calculated using DETX and DETY for each event in the final _common_clean file
| Quadrant A | 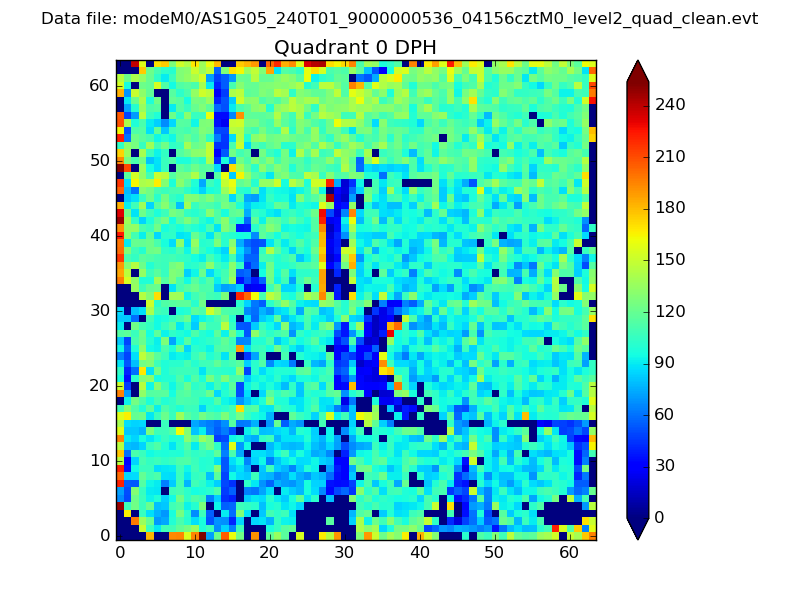 |
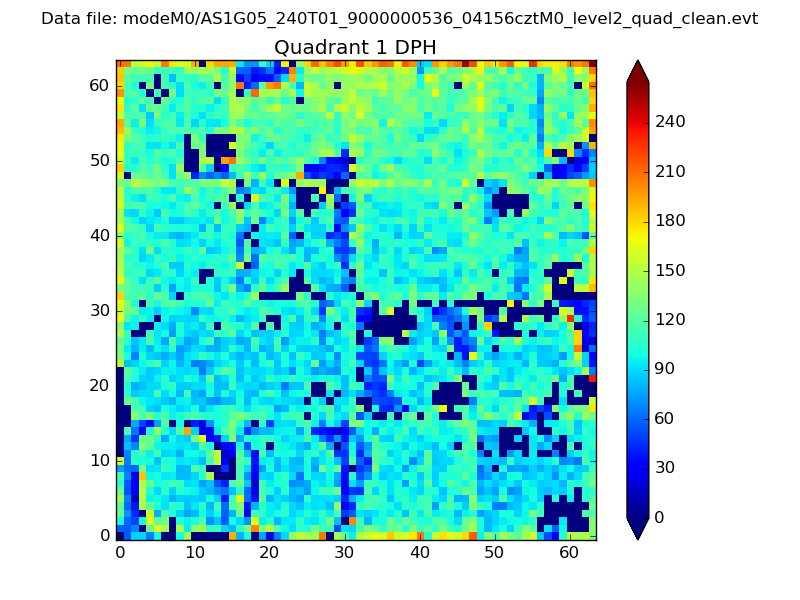 |
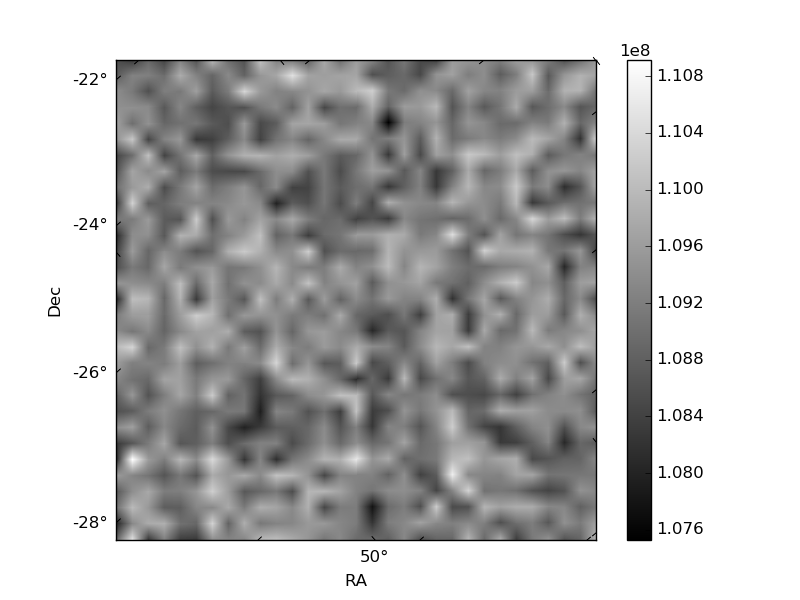
Quadrant B |
|---|---|---|---|
| Quadrant D |  |
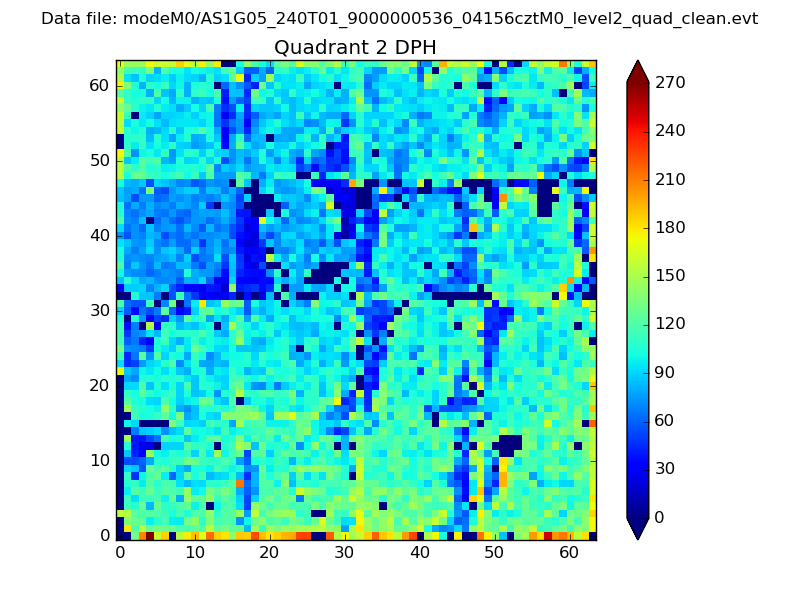 |
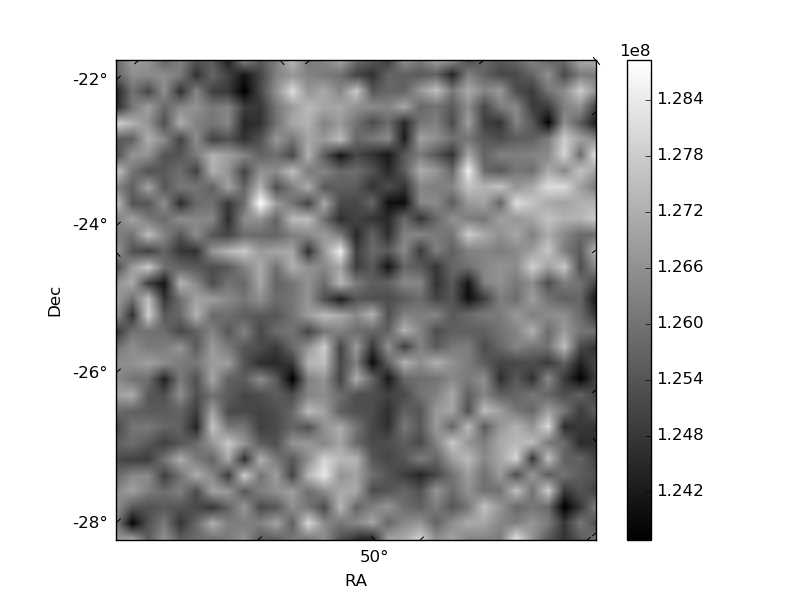
Quadrant C |
| Plot type | Count rate plots | Images |
|---|---|---|
| Comparison with Poisson distribution Blue bars denote a histogram of data divided into 1 sec bins. Red curve is a Poisson curve with rate = median count rate of data. |
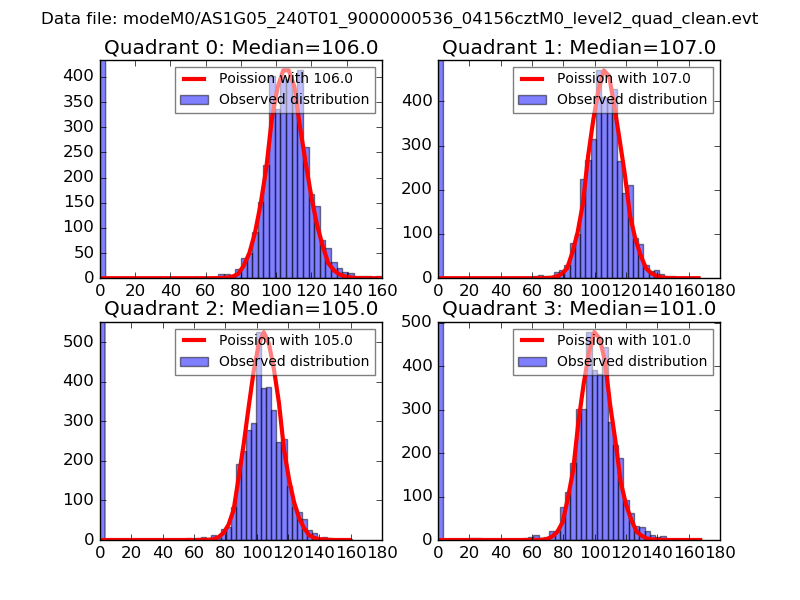 |
 |
| Quadrant-wise count rates Data is divided into 100 sec bins |
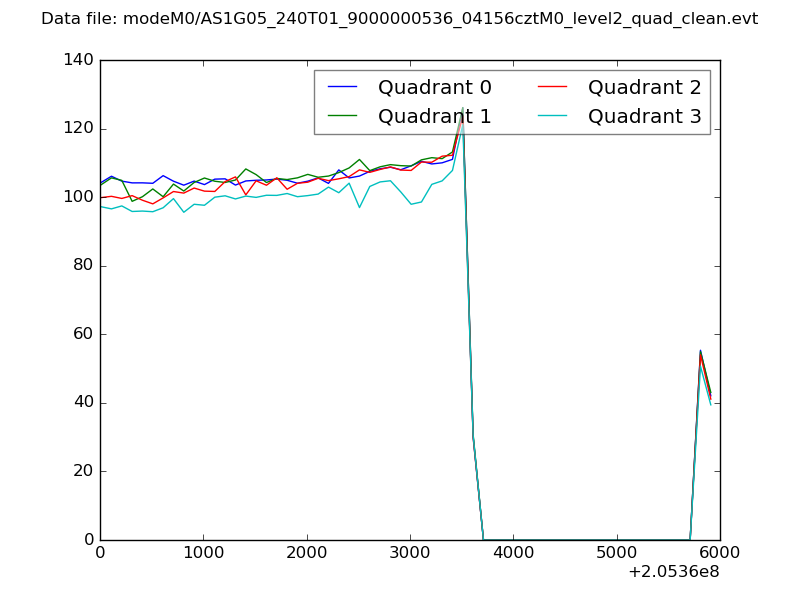 |
|
| Module-wise count rates for Quadrant A Data is divided into 100 sec bins |
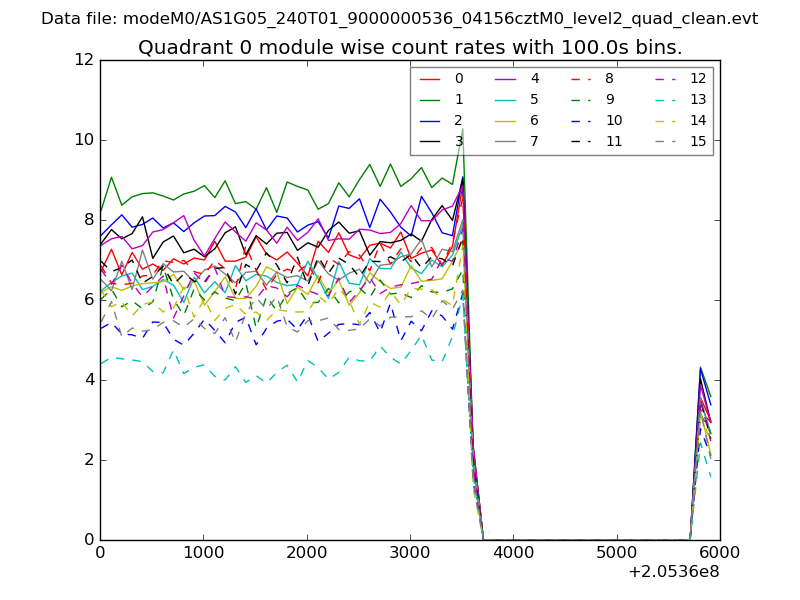 |
 |
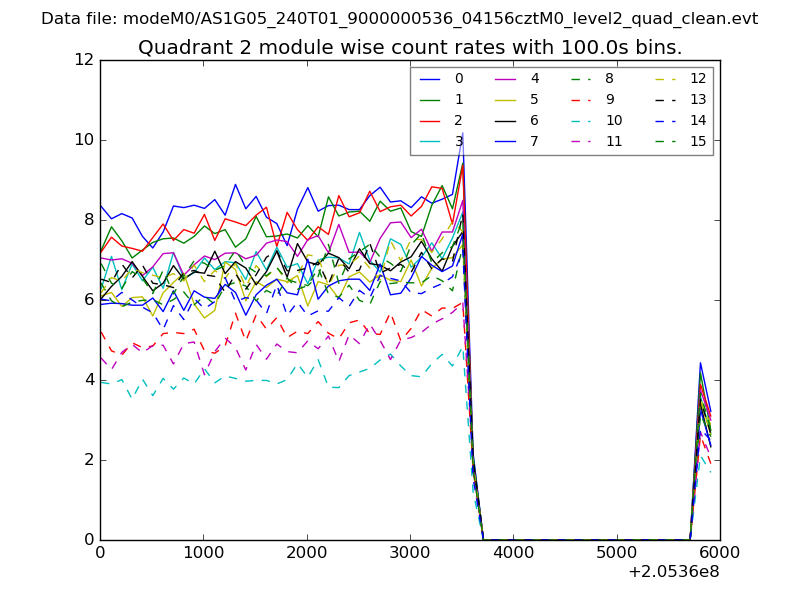
| Module-wise count rates for Quadrant B Data is divided into 100 sec bins |
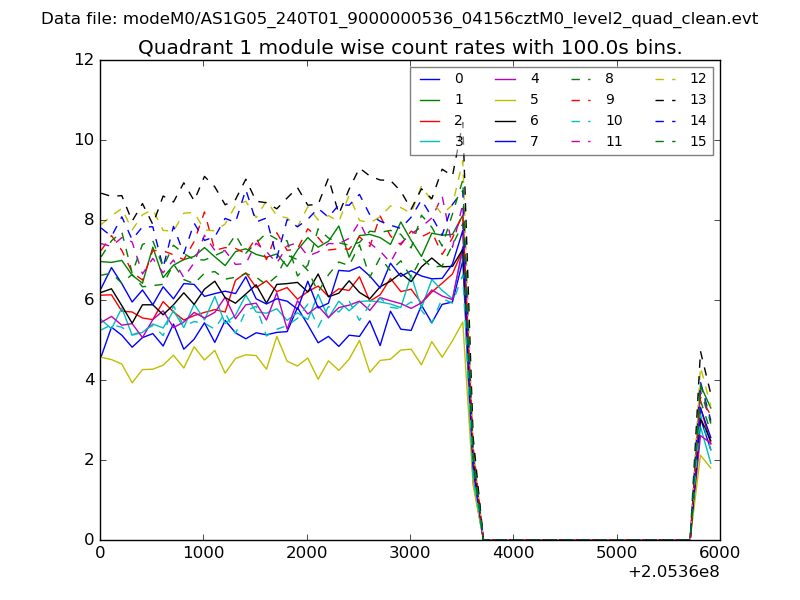 |
 |
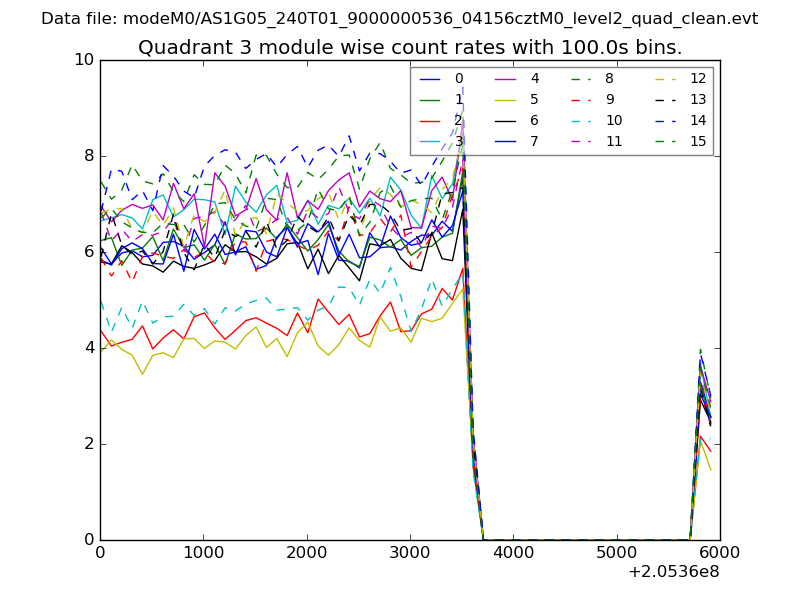
| Module-wise count rates for Quadrant C Data is divided into 100 sec bins |
 |
 |
| Module-wise count rates for Quadrant D Data is divided into 100 sec bins |
 |
 |
| Parameter | Plot |
|---|---|
| CZT HV Monitor | 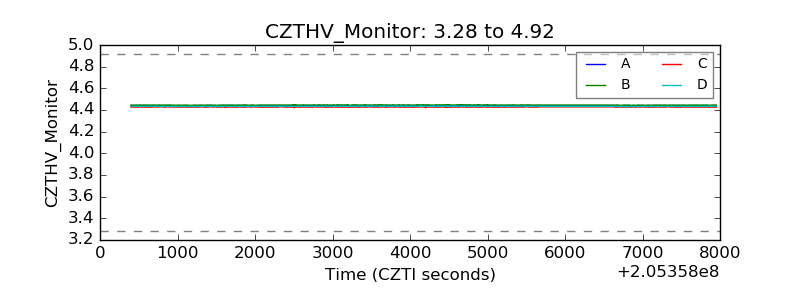 |
| D_VDD | 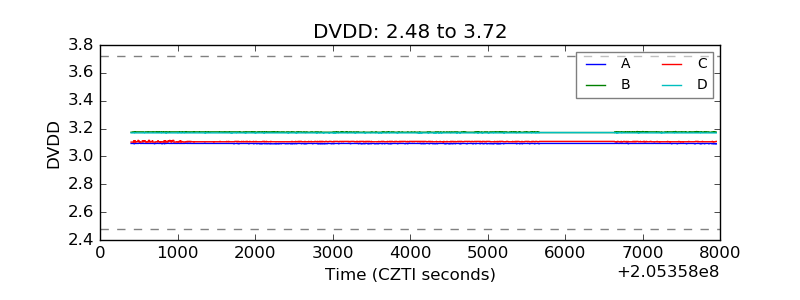 |
| Temperature 1 | 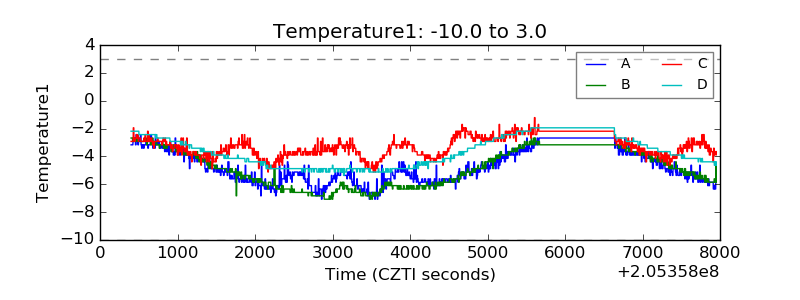 |
| Veto HV Monitor | 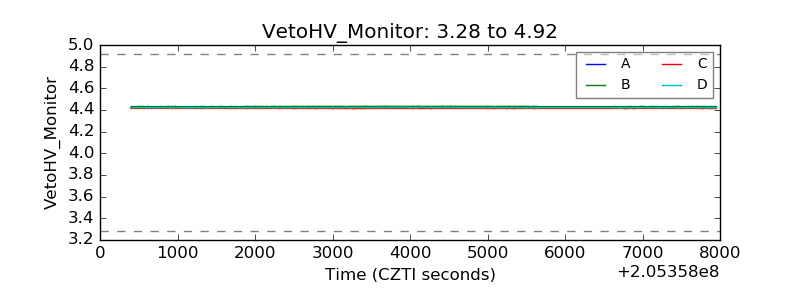 |
| Veto LLD |  |
| Alpha Counter | 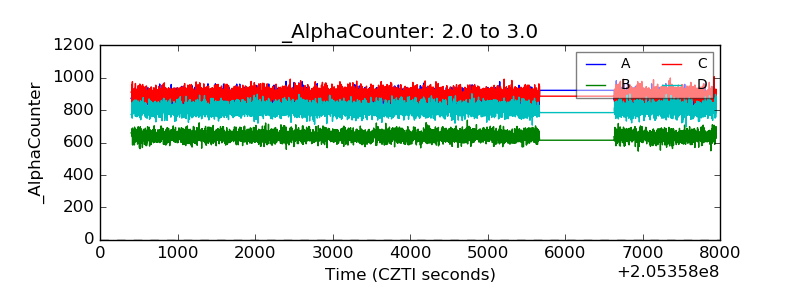 |
| _CPM_Rate | 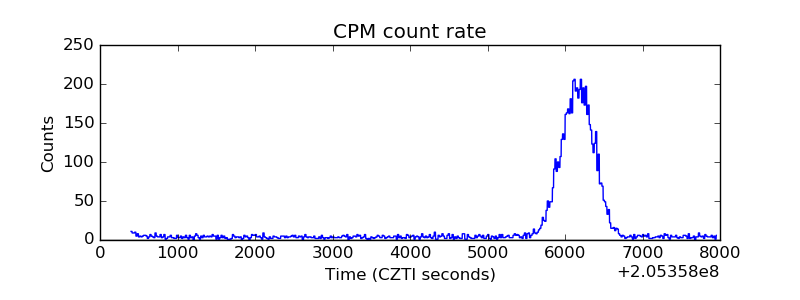 |
| CZT Counter | 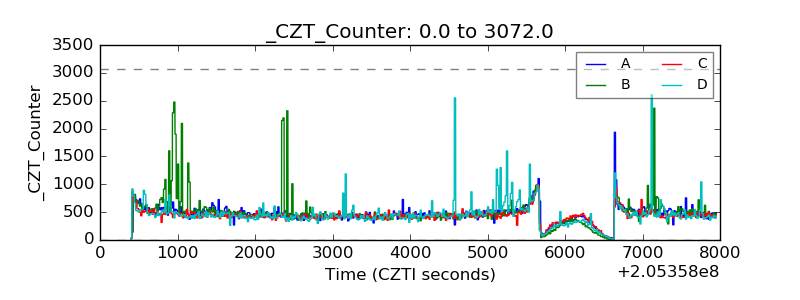 |
| +2.5 Volts monitor | 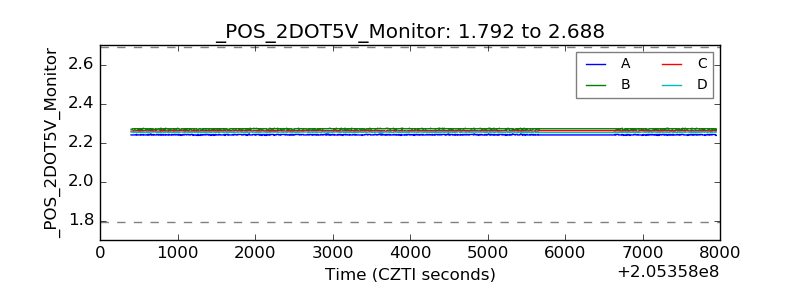 |
| +5 Volts monitor |  |
| _ROLL_ROT | 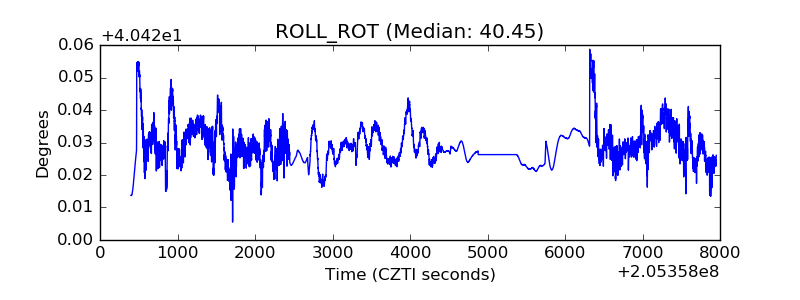 |
| _Roll_DEC | 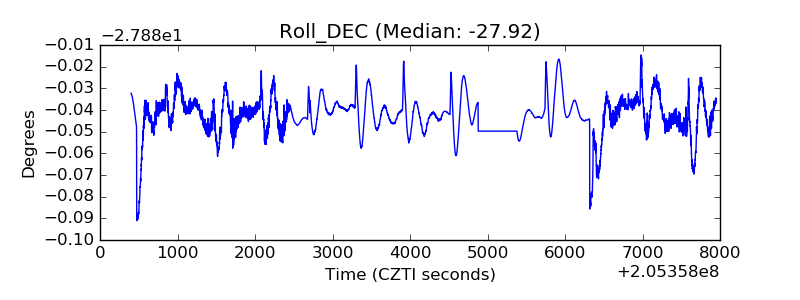 |
| _Roll_RA | 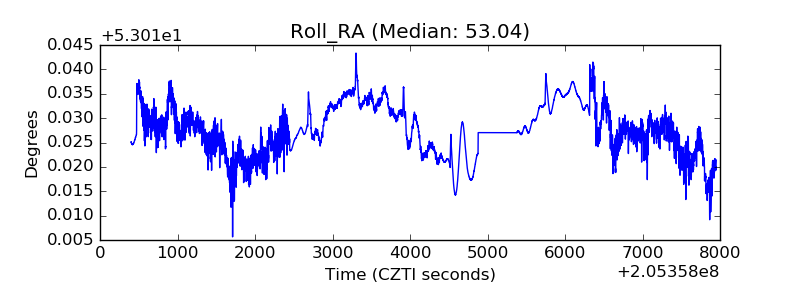 |
| Veto Counter | 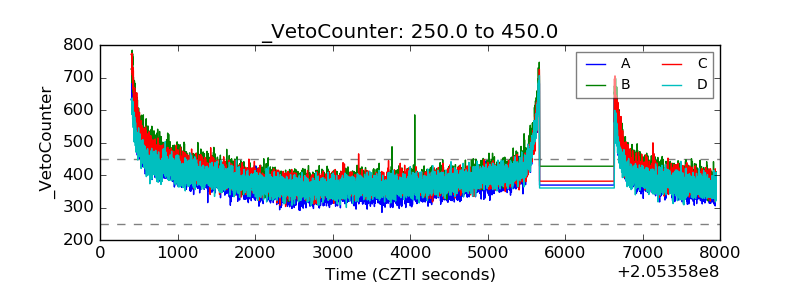 |