| Param | Original file | Final file |
|---|---|---|
| Filename | modeM0/AS1G05_240T01_9000000536_04157cztM0_level2.evt | modeM0/AS1G05_240T01_9000000536_04157cztM0_level2_quad_clean.evt |
| Size (bytes) | 485,556,480 | 77,713,920 |
| Size | 463.1 MB | 74.1 MB |
| Events in quadrant A | 3,657,778 | 466,290 |
| Events in quadrant B | 3,661,152 | 467,858 |
| Events in quadrant C | 3,389,607 | 458,201 |
| Events in quadrant D | 3,491,640 | 443,914 |
| Mode SS | |||
|---|---|---|---|
| Quadrant | BADHDUFLAG | Total packets | Discarded packets |
| A | 0 | 152 | 0 |
| B | 0 | 152 | 0 |
| C | 0 | 152 | 0 |
| D | 0 | 152 | 0 |
| Mode M9 | |||
|---|---|---|---|
| Quadrant | BADHDUFLAG | Total packets | Discarded packets |
| A | 0 | 16 | 0 |
| B | 0 | 16 | 0 |
| C | 0 | 16 | 0 |
| D | 0 | 16 | 0 |
| Mode M0 | |||
|---|---|---|---|
| Quadrant | BADHDUFLAG | Total packets | Discarded packets |
| A | 0 | 15794 | 3 |
| B | 0 | 15818 | 2 |
| C | 0 | 15363 | 2 |
| D | 0 | 15771 | 2 |
| Quadrant | Total seconds | Saturated seconds | Saturation percentage |
|---|---|---|---|
| A | 7430 | 136 | 1.830417% |
| B | 7430 | 145 | 1.951548% |
| C | 7430 | 94 | 1.265141% |
| D | 7430 | 90 | 1.211306% |
Noise dominated data is calculated using 1-second bins in cleaned event files. If a bin has >2000 counts, and if more than 50% of those come from <1% of pixels, then it is considered to be noise-dominated and hence unusable.
| Quadrant | # 1 sec bins | Bins with >0 counts | Bins with >2000 counts | High rate bins dominated by noise | Noise dominated (total time) | Noise dominated (detector-on time) | Marked lightcurve |
|---|---|---|---|---|---|---|---|
| A | 8990 | 7432 | 9 | 9 | 0.10% | 0.12% | 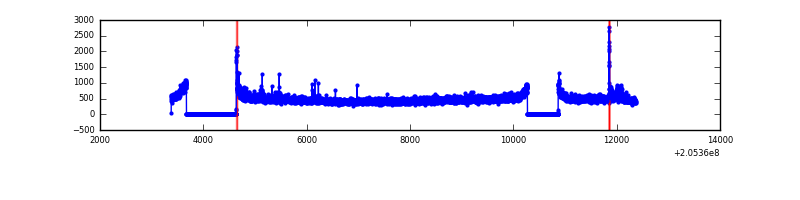 |
| B | 8990 | 7432 | 11 | 11 | 0.12% | 0.15% | 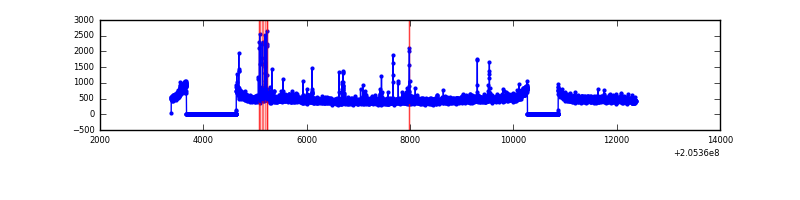 |
| C | 8990 | 7432 | 1 | 1 | 0.01% | 0.01% | 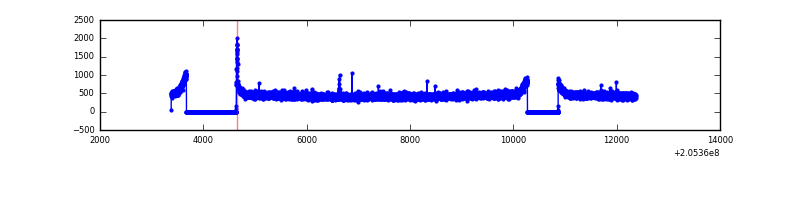 |
| D | 8990 | 7432 | 16 | 16 | 0.18% | 0.22% | 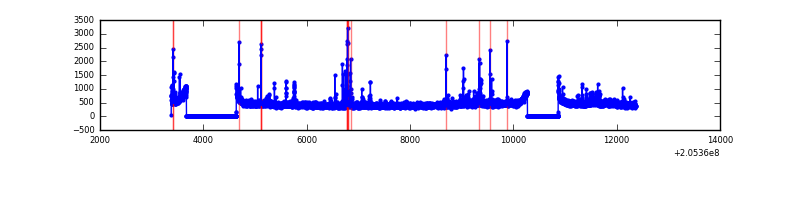 |
Top three noisy pixels from each quadrant. If the there are fewer than three noisy pixels in the level2.evt file, extra rows are filled as -1
| Pixel properties | Quadrant properties | ||||||
|---|---|---|---|---|---|---|---|
| Quadrant | DetID | PixID | Counts | Sigma | Mean | Median | Sigma |
| A | 0 | 199 | 98676 | 535.99 | 886 | 866 | 182.5 |
| A | 8 | 15 | 55005 | 296.68 | 886 | 866 | 182.5 |
| A | 3 | 1 | 43754 | 235.02 | 886 | 866 | 182.5 |
| B | 10 | 16 | 43430 | 245.6 | 896 | 876 | 173.3 |
| B | 4 | 48 | 42012 | 237.42 | 896 | 876 | 173.3 |
| B | 14 | 167 | 36149 | 203.58 | 896 | 876 | 173.3 |
| C | 7 | 222 | 19497 | 91.85 | 860 | 862 | 202.9 |
| C | 12 | 4 | 7271 | 31.59 | 860 | 862 | 202.9 |
| C | 13 | 61 | 6957 | 30.04 | 860 | 862 | 202.9 |
| D | 10 | 172 | 97142 | 459.31 | 858 | 833 | 209.7 |
| D | 2 | 232 | 34377 | 159.98 | 858 | 833 | 209.7 |
| D | 2 | 14 | 30825 | 143.04 | 858 | 833 | 209.7 |
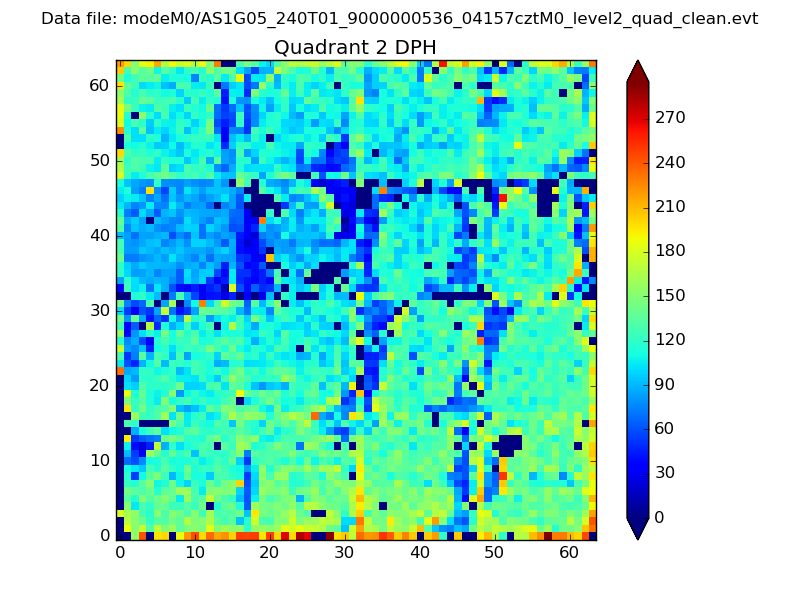
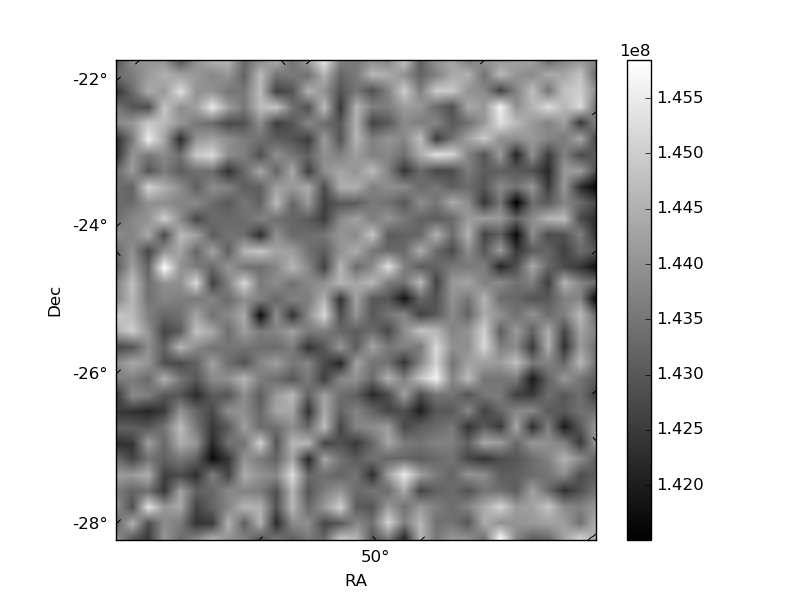
Histogram calculated using DETX and DETY for each event in the final _common_clean file
| Quadrant A |  |
 |
Quadrant B |
|---|---|---|---|
| Quadrant D | 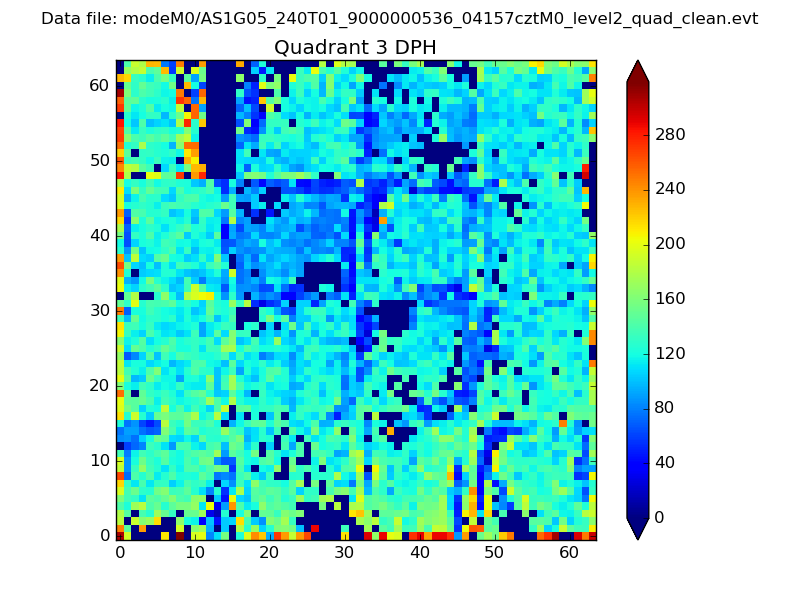 |
 |
Quadrant C |
| Plot type | Count rate plots | Images |
|---|---|---|
| Comparison with Poisson distribution Blue bars denote a histogram of data divided into 1 sec bins. Red curve is a Poisson curve with rate = median count rate of data. |
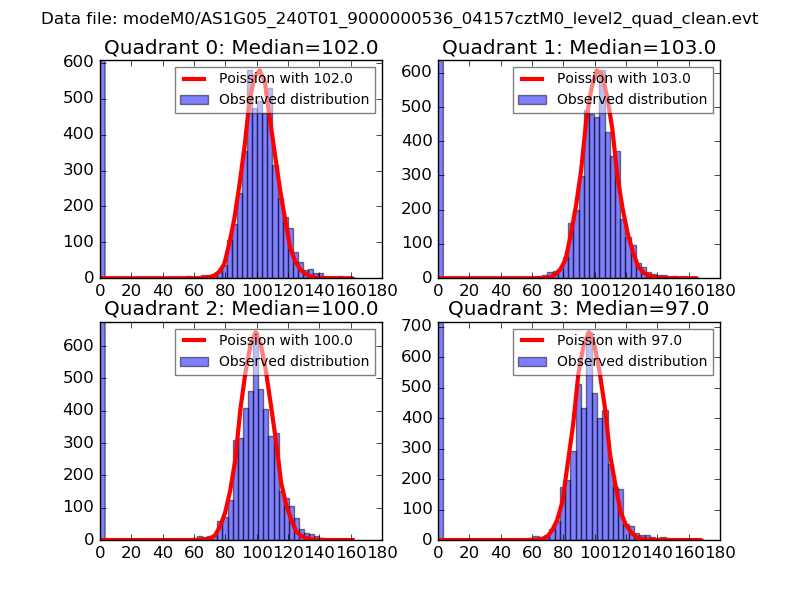 |
 |
| Quadrant-wise count rates Data is divided into 100 sec bins |
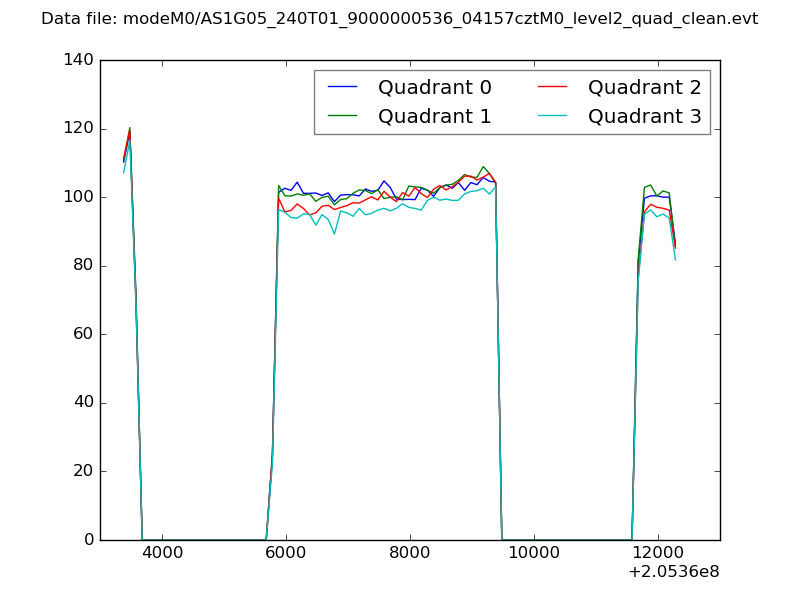 |
|
| Module-wise count rates for Quadrant A Data is divided into 100 sec bins |
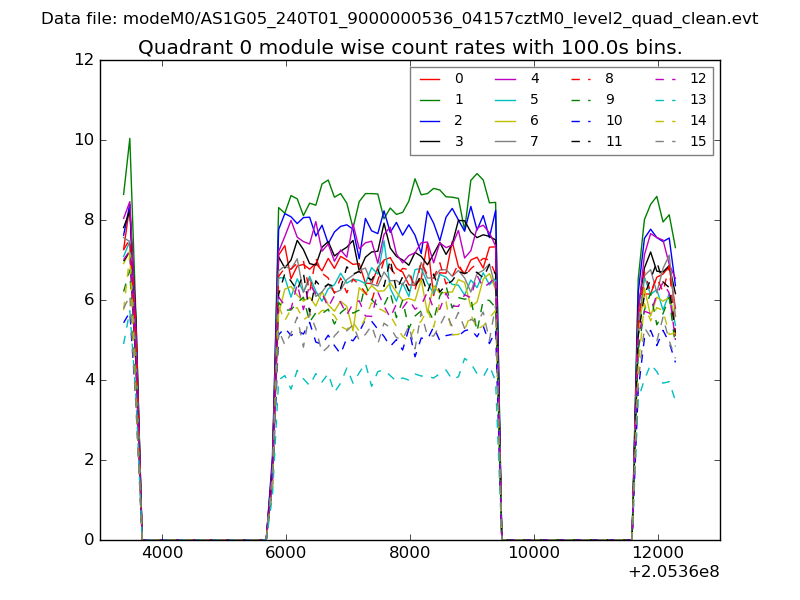 |
 |
| Module-wise count rates for Quadrant B Data is divided into 100 sec bins |
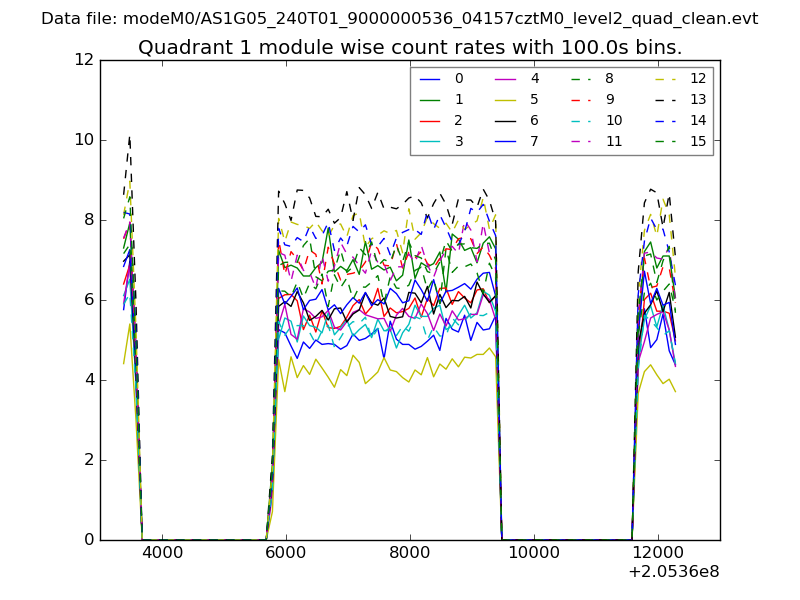 |
 |
| Module-wise count rates for Quadrant C Data is divided into 100 sec bins |
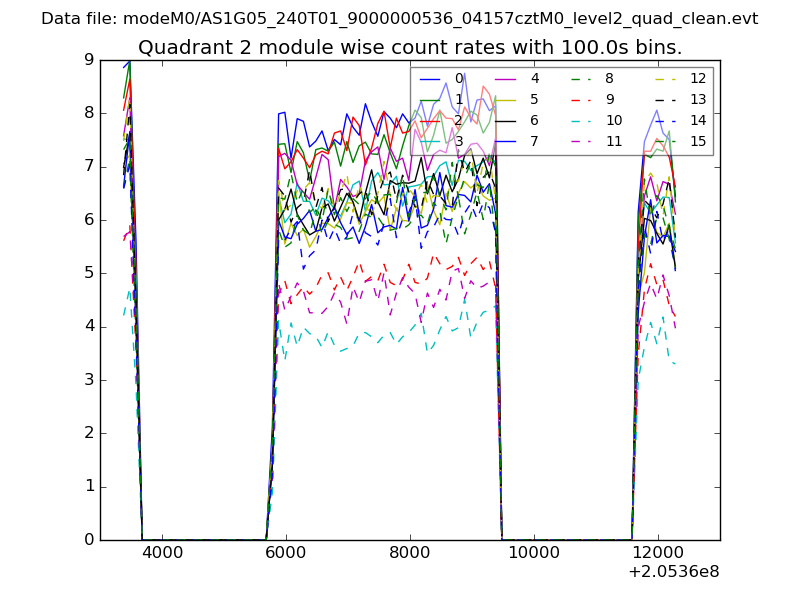 |
 |
| Module-wise count rates for Quadrant D Data is divided into 100 sec bins |
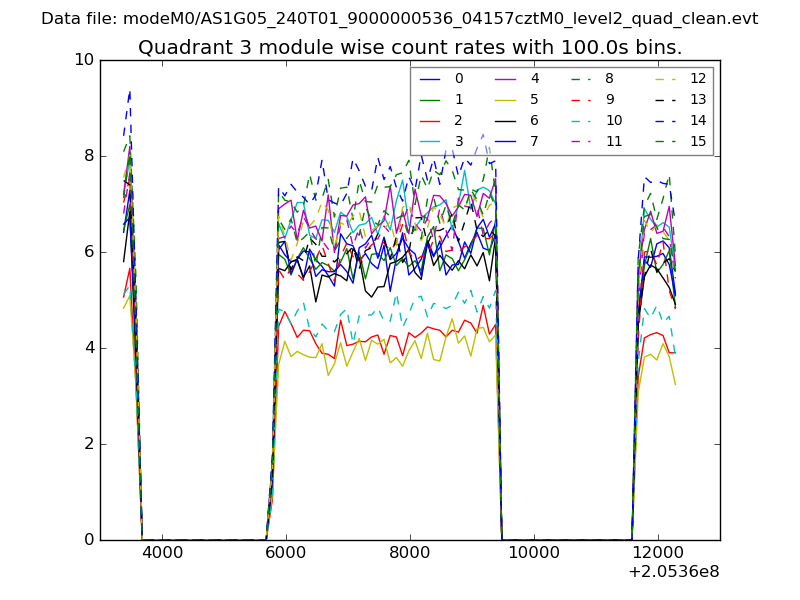 |
 |
| Parameter | Plot |
|---|---|
| CZT HV Monitor | 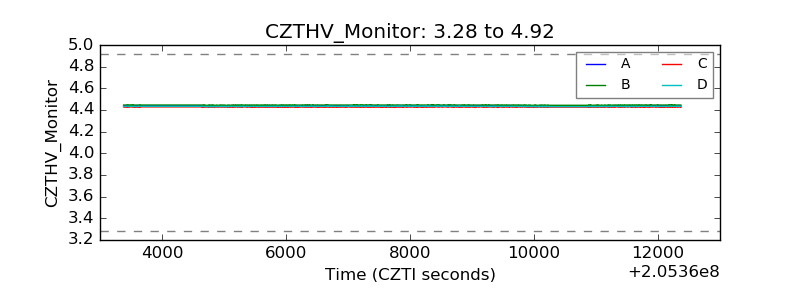 |
| D_VDD | 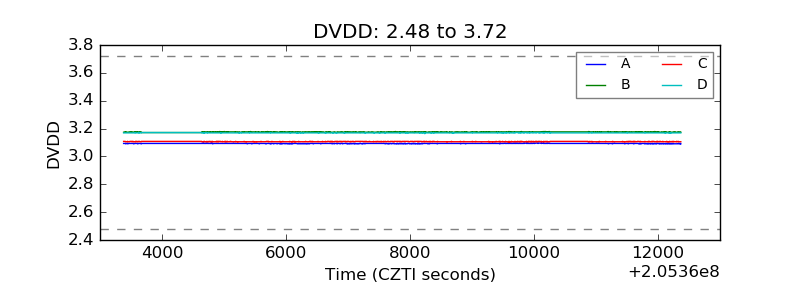 |
| Temperature 1 | 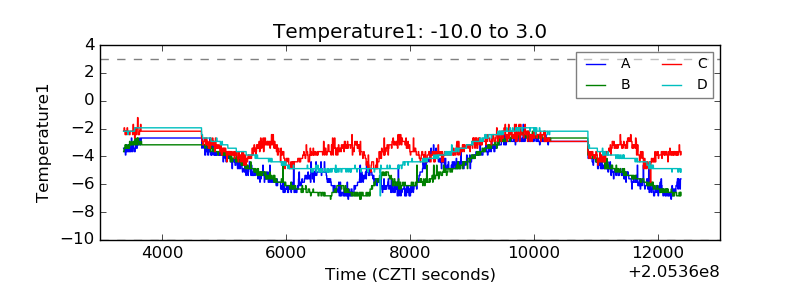 |
| Veto HV Monitor | 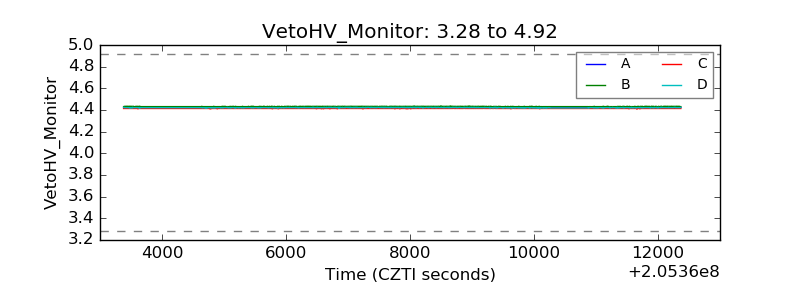 |
| Veto LLD | 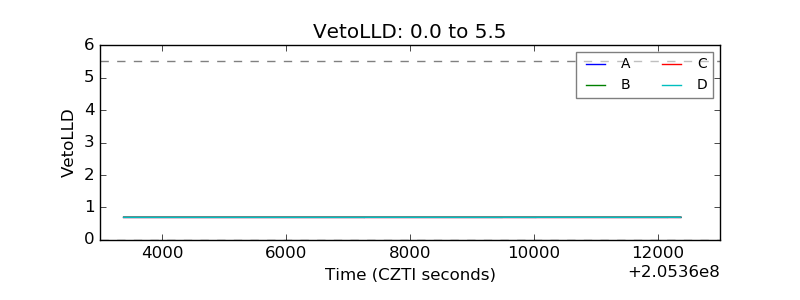 |
| Alpha Counter | 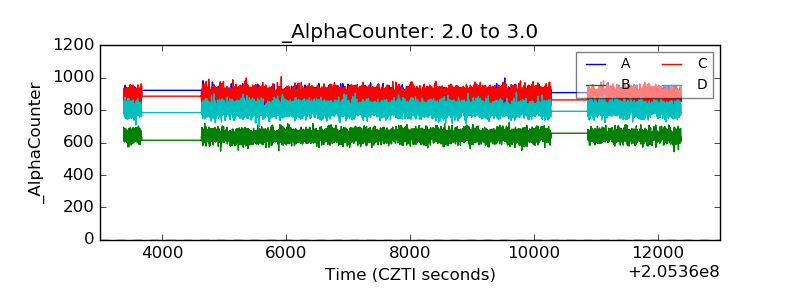 |
| _CPM_Rate | 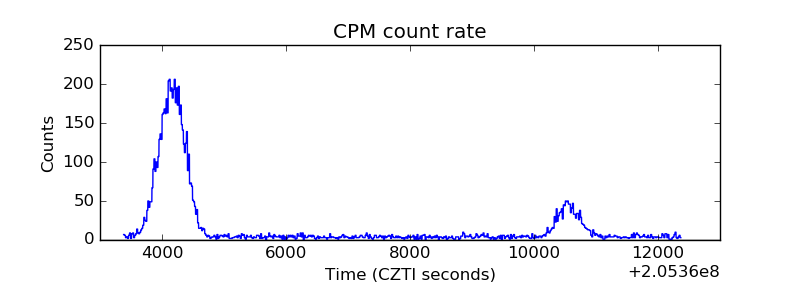 |
| CZT Counter | 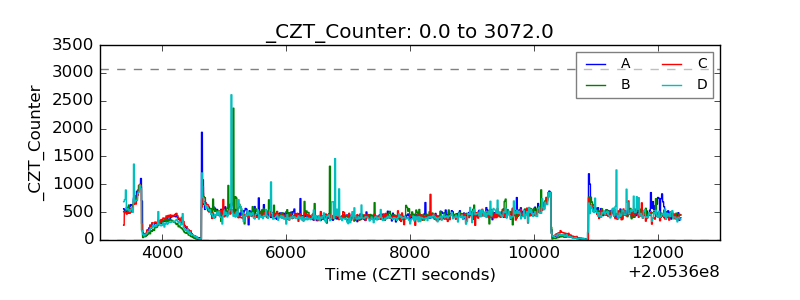 |
| +2.5 Volts monitor |  |
| +5 Volts monitor | 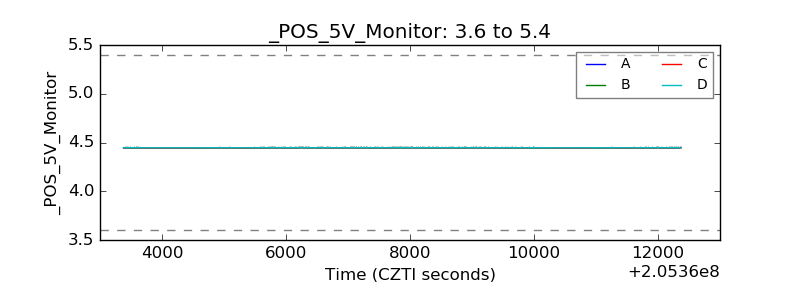 |
| _ROLL_ROT | 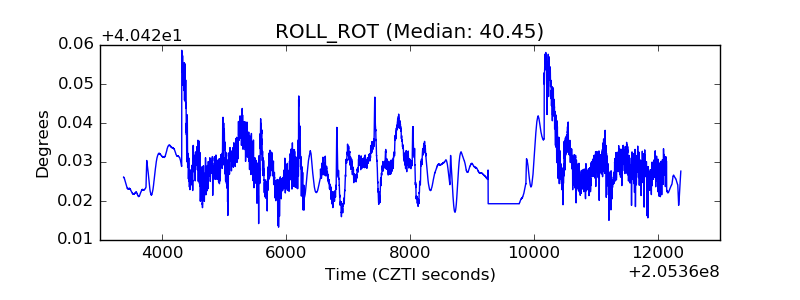 |
| _Roll_DEC | 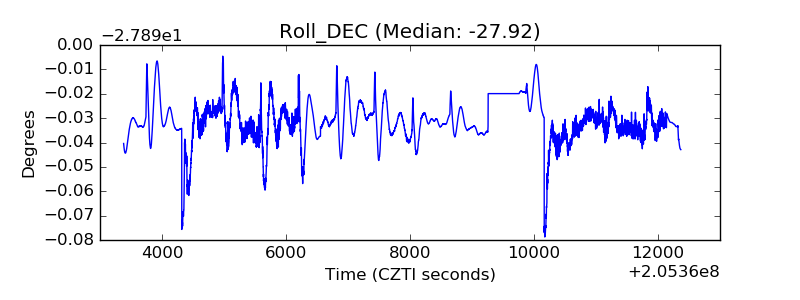 |
| _Roll_RA | 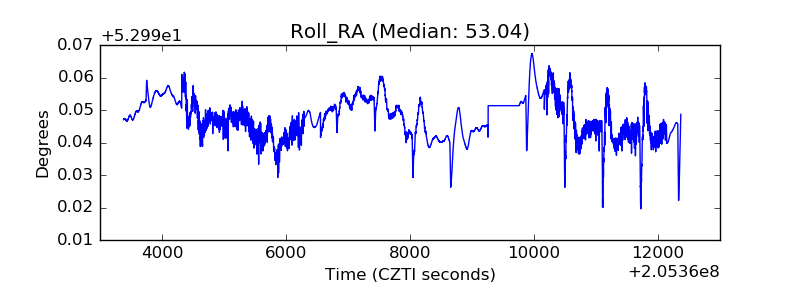 |
| Veto Counter |  |