| Param | Original file | Final file |
|---|---|---|
| Filename | modeM0/AS1G05_240T01_9000000536_04158cztM0_level2.evt | modeM0/AS1G05_240T01_9000000536_04158cztM0_level2_quad_clean.evt |
| Size (bytes) | 535,826,880 | 79,873,920 |
| Size | 511.0 MB | 76.2 MB |
| Events in quadrant A | 4,026,507 | 469,568 |
| Events in quadrant B | 4,110,587 | 472,558 |
| Events in quadrant C | 3,674,091 | 462,669 |
| Events in quadrant D | 3,866,295 | 450,865 |
| Mode SS | |||
|---|---|---|---|
| Quadrant | BADHDUFLAG | Total packets | Discarded packets |
| A | 0 | 166 | 0 |
| B | 0 | 166 | 0 |
| C | 0 | 166 | 0 |
| D | 0 | 166 | 0 |
| Mode M9 | |||
|---|---|---|---|
| Quadrant | BADHDUFLAG | Total packets | Discarded packets |
| A | 0 | 8 | 0 |
| B | 0 | 8 | 0 |
| C | 0 | 8 | 0 |
| D | 0 | 8 | 0 |
| Mode M0 | |||
|---|---|---|---|
| Quadrant | BADHDUFLAG | Total packets | Discarded packets |
| A | 0 | 17364 | 3 |
| B | 0 | 17551 | 2 |
| C | 0 | 16685 | 2 |
| D | 0 | 17250 | 2 |
| Quadrant | Total seconds | Saturated seconds | Saturation percentage |
|---|---|---|---|
| A | 8097 | 132 | 1.630233% |
| B | 8097 | 138 | 1.704335% |
| C | 8097 | 90 | 1.111523% |
| D | 8097 | 92 | 1.136223% |
Noise dominated data is calculated using 1-second bins in cleaned event files. If a bin has >2000 counts, and if more than 50% of those come from <1% of pixels, then it is considered to be noise-dominated and hence unusable.
| Quadrant | # 1 sec bins | Bins with >0 counts | Bins with >2000 counts | High rate bins dominated by noise | Noise dominated (total time) | Noise dominated (detector-on time) | Marked lightcurve |
|---|---|---|---|---|---|---|---|
| A | 8897 | 8100 | 26 | 26 | 0.29% | 0.32% | 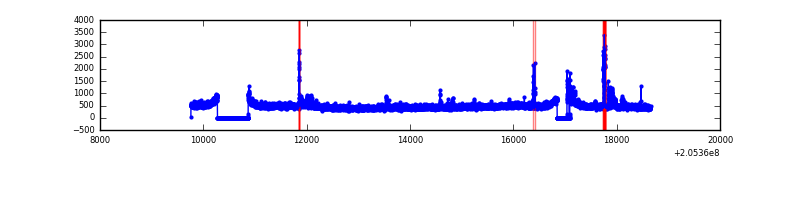 |
| B | 8897 | 8100 | 4 | 4 | 0.04% | 0.05% | 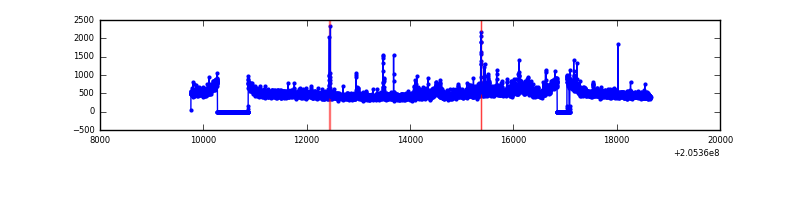 |
| C | 8897 | 8100 | 0 | 0 | 0.00% | 0.00% |  |
| D | 8897 | 8100 | 21 | 21 | 0.24% | 0.26% | 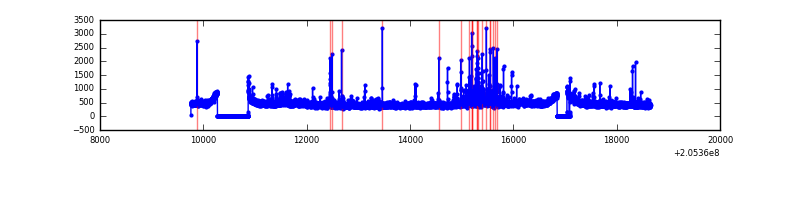 |
Top three noisy pixels from each quadrant. If the there are fewer than three noisy pixels in the level2.evt file, extra rows are filled as -1
| Pixel properties | Quadrant properties | ||||||
|---|---|---|---|---|---|---|---|
| Quadrant | DetID | PixID | Counts | Sigma | Mean | Median | Sigma |
| A | 0 | 199 | 93776 | 468.96 | 960 | 937 | 198.0 |
| A | 0 | 50 | 68307 | 340.31 | 960 | 937 | 198.0 |
| A | 15 | 234 | 50709 | 251.41 | 960 | 937 | 198.0 |
| B | 14 | 167 | 211454 | 1102.66 | 973 | 949 | 190.9 |
| B | 4 | 48 | 50336 | 258.7 | 973 | 949 | 190.9 |
| B | 15 | 204 | 50231 | 258.15 | 973 | 949 | 190.9 |
| C | 10 | 65 | 8905 | 36.43 | 935 | 939 | 218.7 |
| C | 13 | 61 | 7623 | 30.57 | 935 | 939 | 218.7 |
| C | 1 | 3 | 6892 | 27.23 | 935 | 939 | 218.7 |
| D | 10 | 172 | 142933 | 628.53 | 932 | 905 | 226.0 |
| D | 2 | 63 | 44572 | 193.24 | 932 | 905 | 226.0 |
| D | 12 | 233 | 42473 | 183.95 | 932 | 905 | 226.0 |
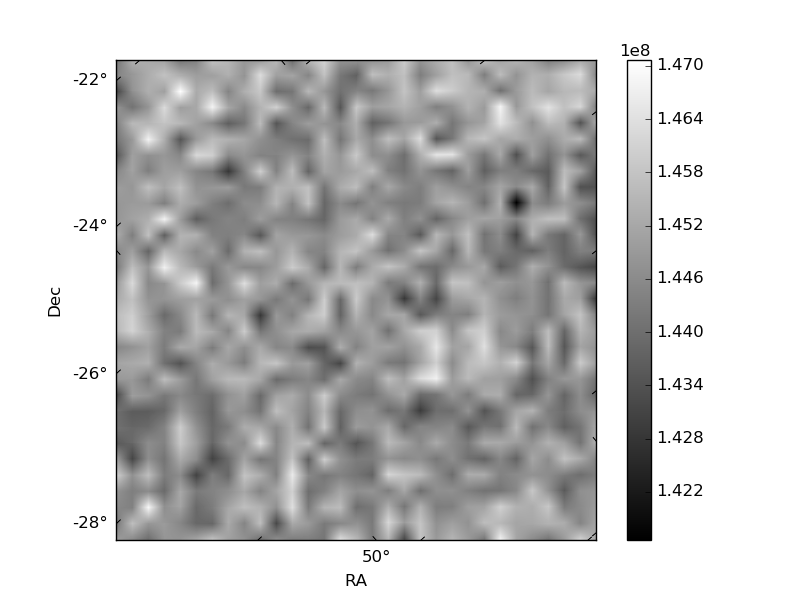
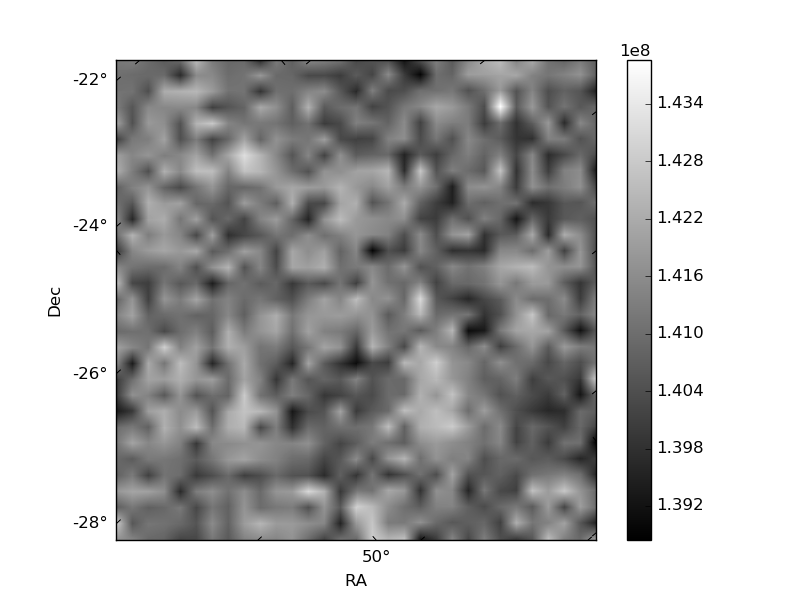
Histogram calculated using DETX and DETY for each event in the final _common_clean file
| Quadrant A | 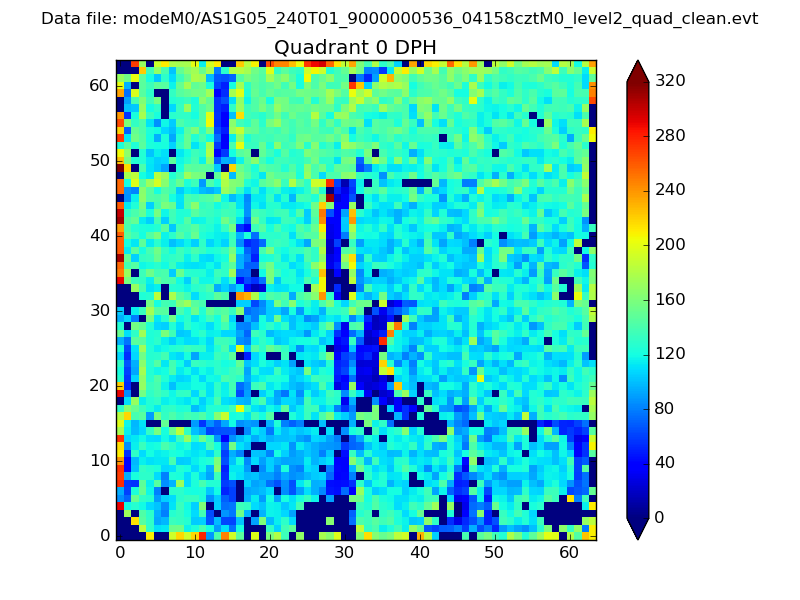 |
 |
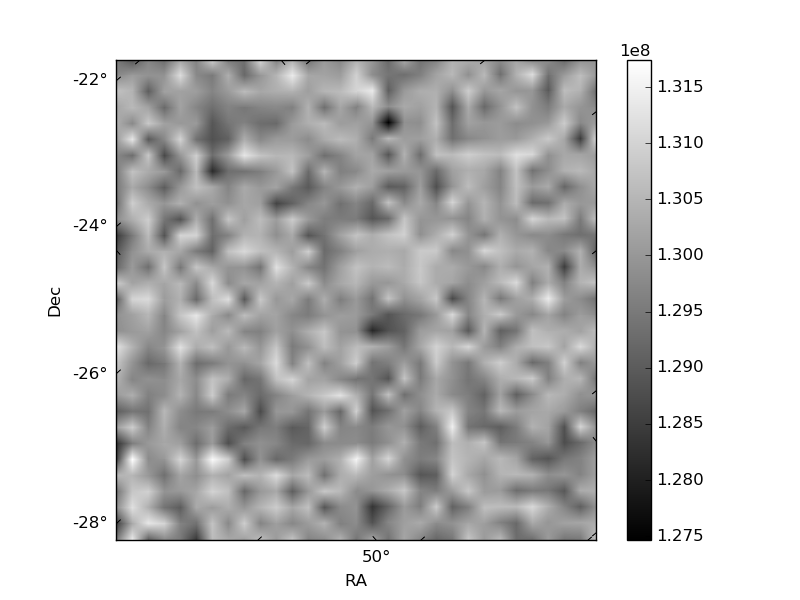
Quadrant B |
|---|---|---|---|
| Quadrant D | 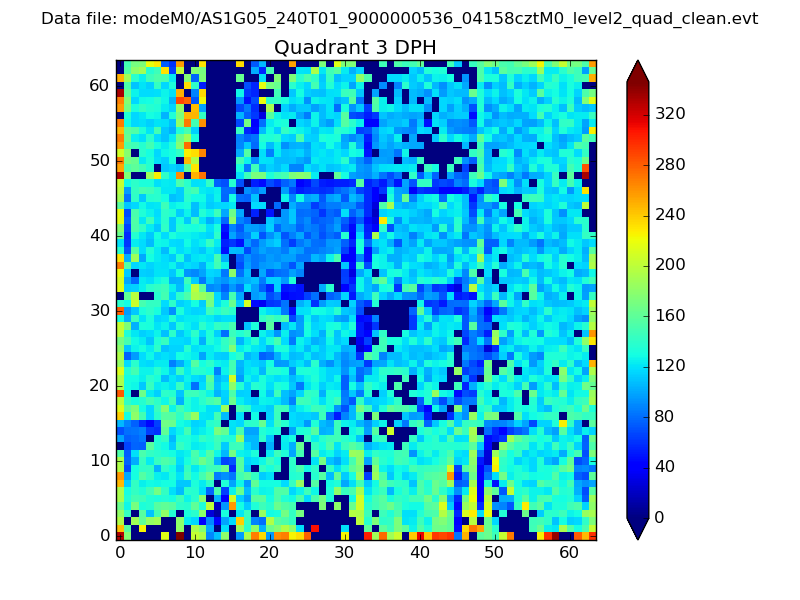 |
 |
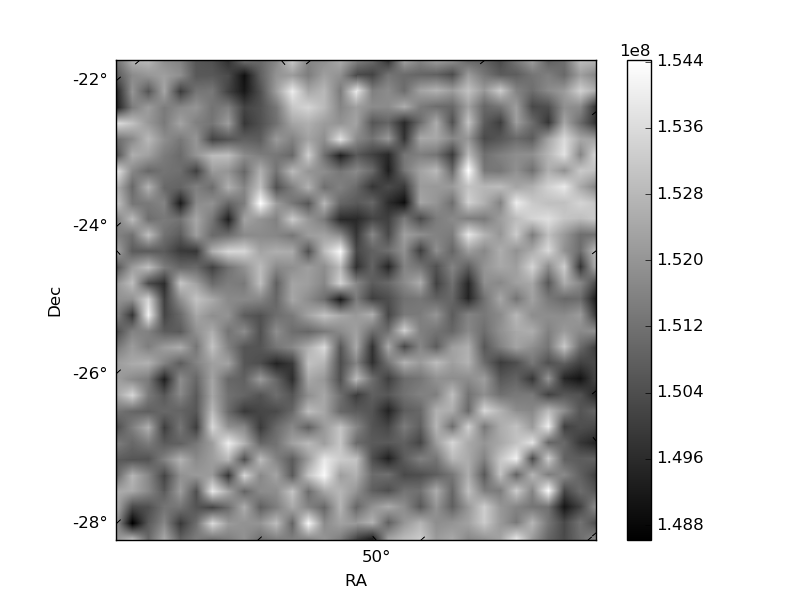
Quadrant C |
| Plot type | Count rate plots | Images |
|---|---|---|
| Comparison with Poisson distribution Blue bars denote a histogram of data divided into 1 sec bins. Red curve is a Poisson curve with rate = median count rate of data. |
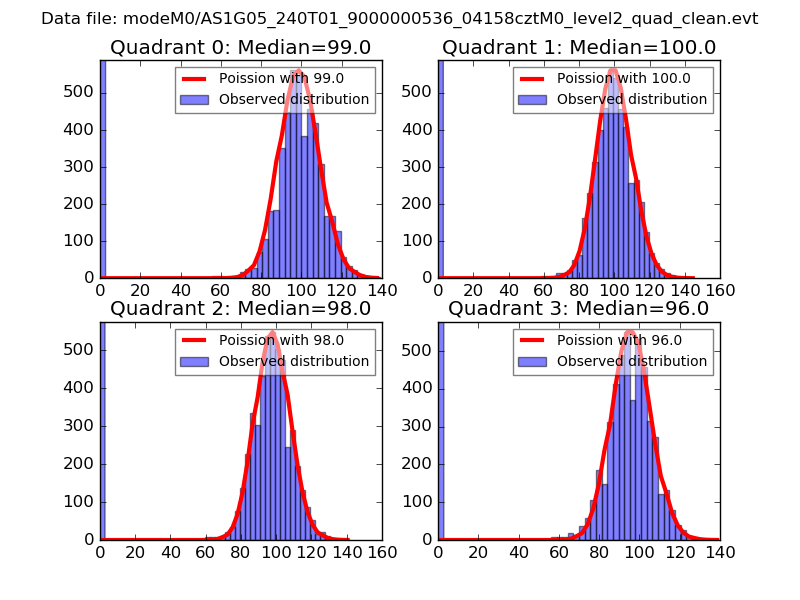 |
 |
| Quadrant-wise count rates Data is divided into 100 sec bins |
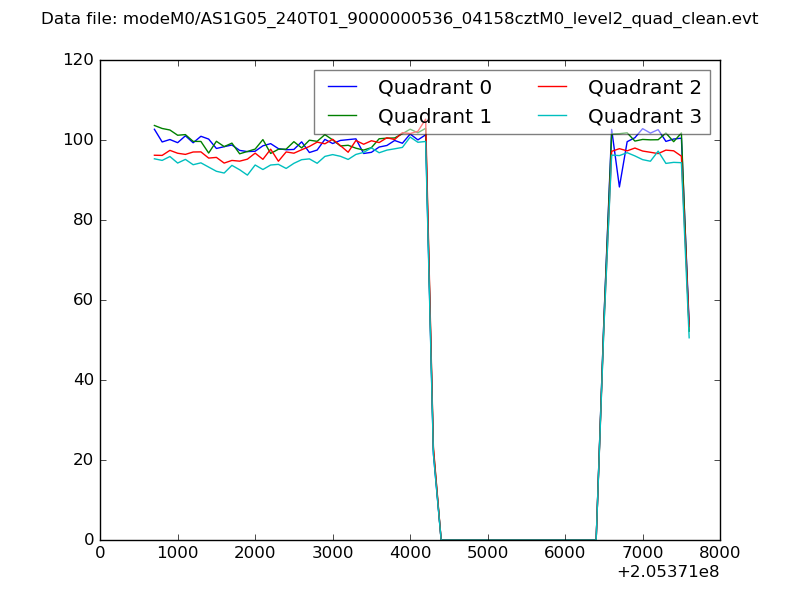 |
|
| Module-wise count rates for Quadrant A Data is divided into 100 sec bins |
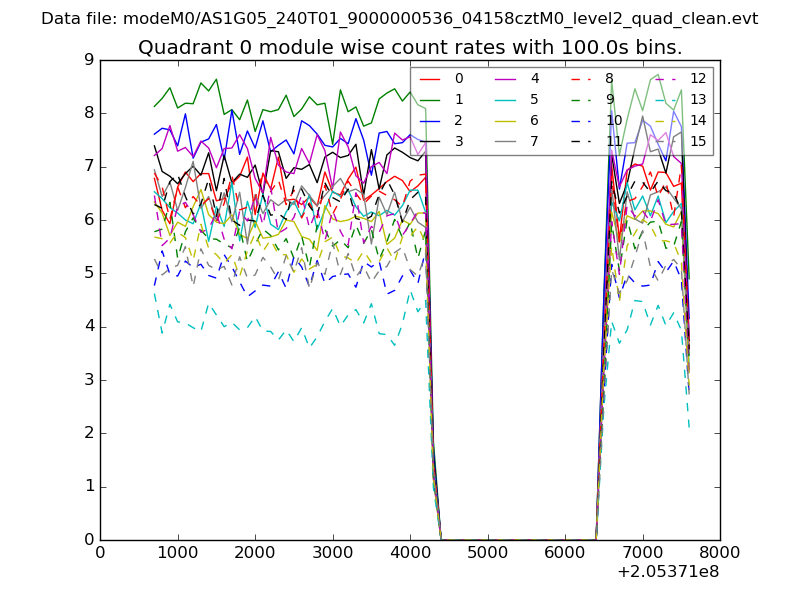 |
 |
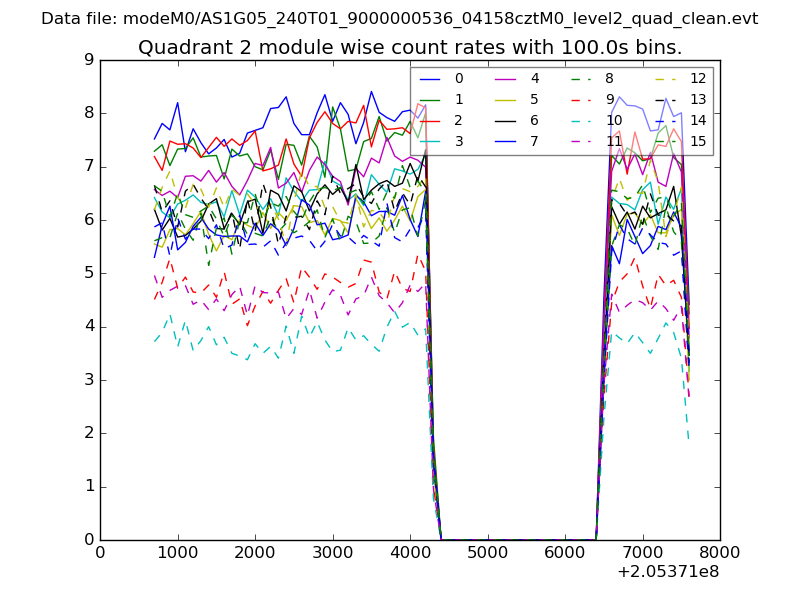
| Module-wise count rates for Quadrant B Data is divided into 100 sec bins |
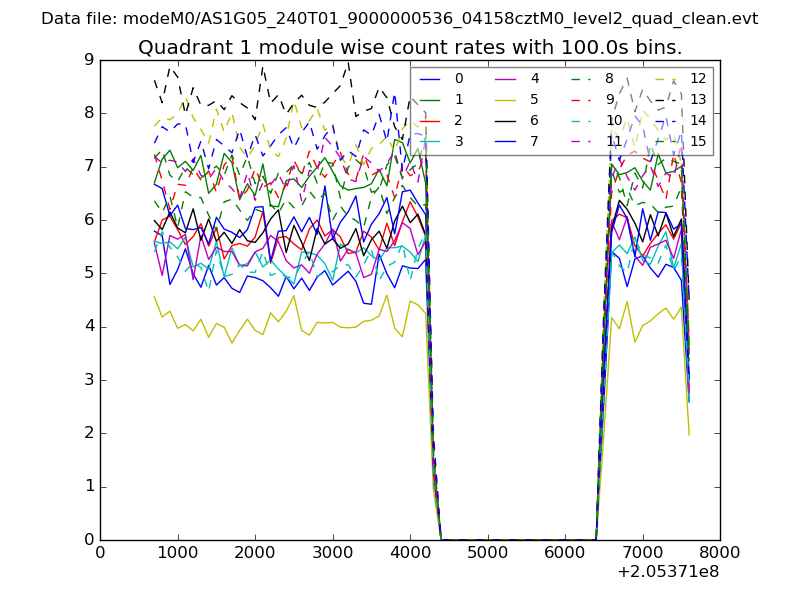 |
 |
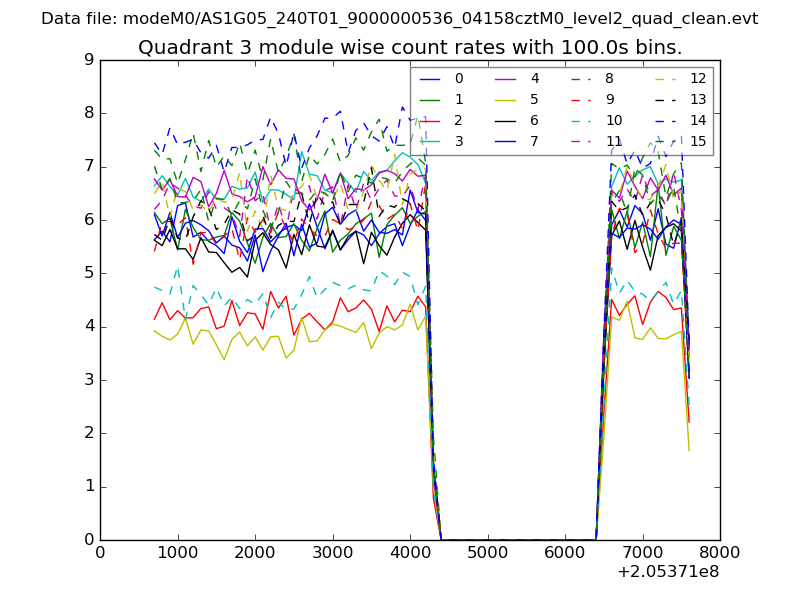
| Module-wise count rates for Quadrant C Data is divided into 100 sec bins |
 |
 |
| Module-wise count rates for Quadrant D Data is divided into 100 sec bins |
 |
 |
| Parameter | Plot |
|---|---|
| CZT HV Monitor | 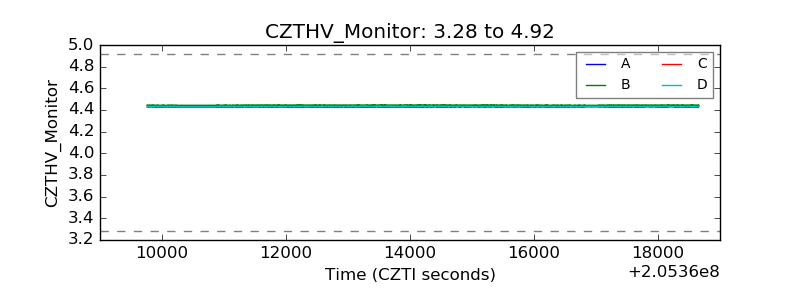 |
| D_VDD | 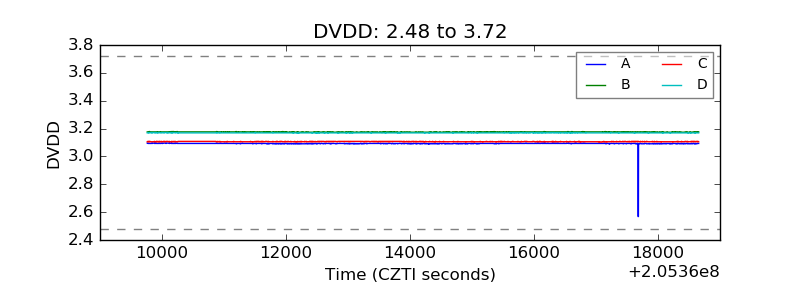 |
| Temperature 1 | 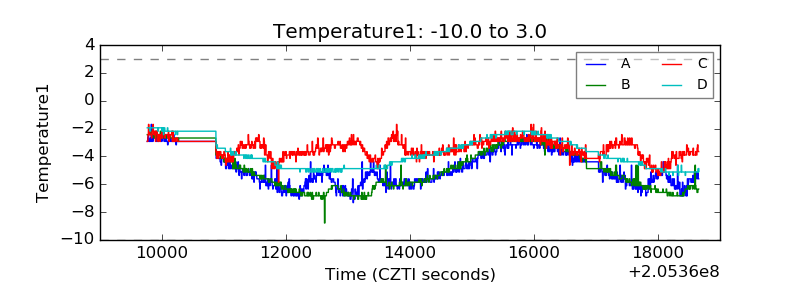 |
| Veto HV Monitor | 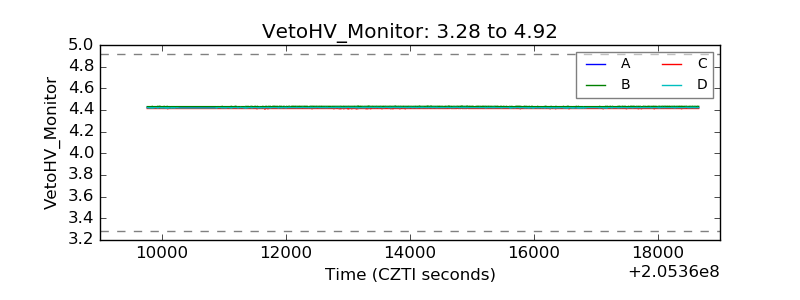 |
| Veto LLD | 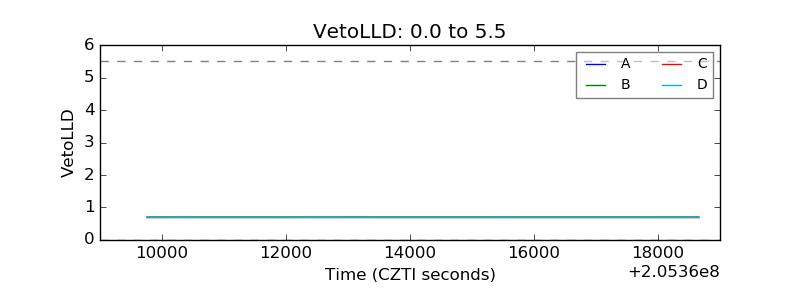 |
| Alpha Counter | 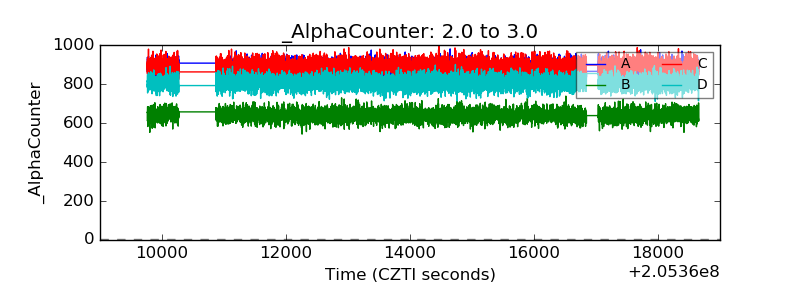 |
| _CPM_Rate | 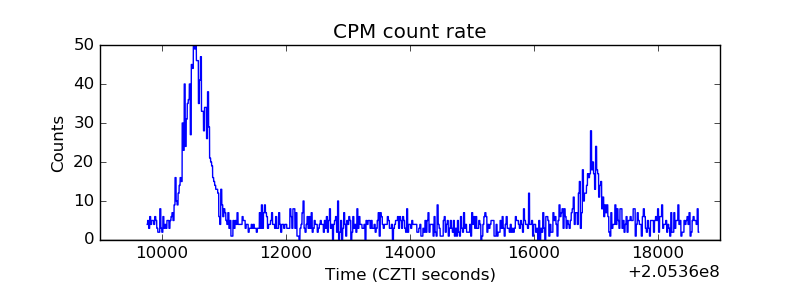 |
| CZT Counter |  |
| +2.5 Volts monitor |  |
| +5 Volts monitor |  |
| _ROLL_ROT | 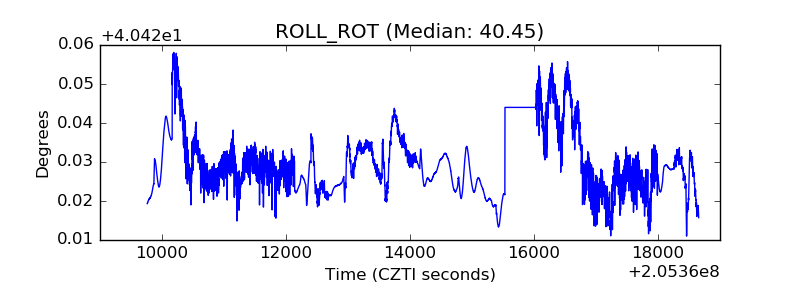 |
| _Roll_DEC | 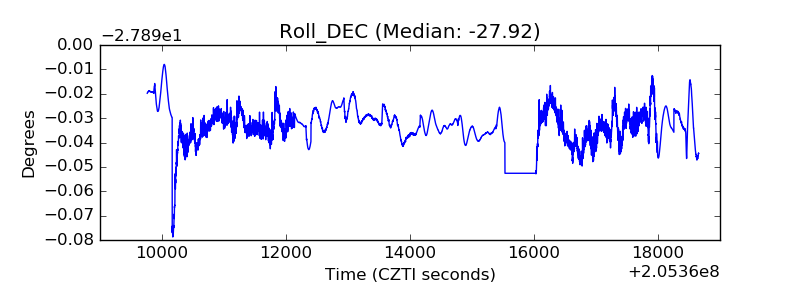 |
| _Roll_RA | 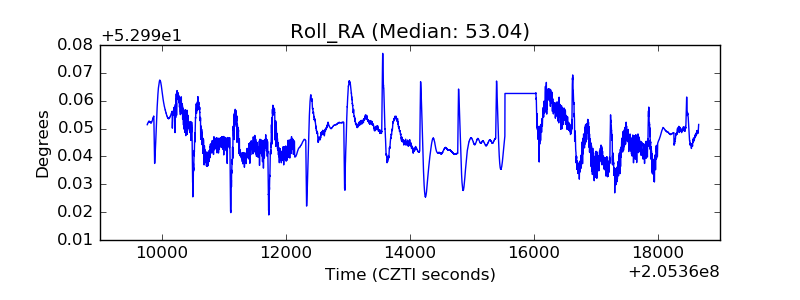 |
| Veto Counter | 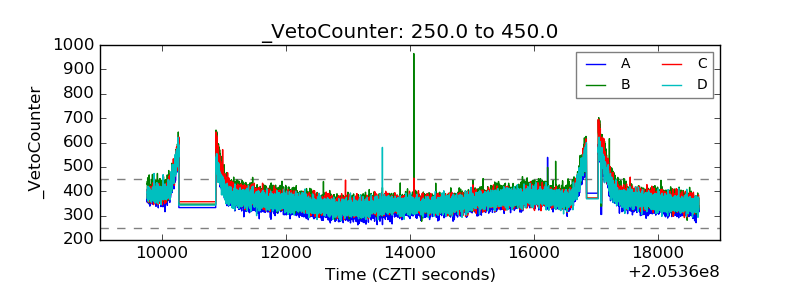 |