| Param | Original file | Final file |
|---|---|---|
| Filename | modeM0/AS1G05_240T01_9000000536_04164cztM0_level2.evt | modeM0/AS1G05_240T01_9000000536_04164cztM0_level2_quad_clean.evt |
| Size (bytes) | 422,824,320 | 67,775,040 |
| Size | 403.2 MB | 64.6 MB |
| Events in quadrant A | 3,091,841 | 413,313 |
| Events in quadrant B | 3,794,043 | 413,241 |
| Events in quadrant C | 2,671,953 | 407,718 |
| Events in quadrant D | 2,838,092 | 397,403 |
| Mode SS | |||
|---|---|---|---|
| Quadrant | BADHDUFLAG | Total packets | Discarded packets |
| A | 0 | 122 | 0 |
| B | 0 | 122 | 0 |
| C | 0 | 122 | 0 |
| D | 0 | 122 | 0 |
| Mode M9 | |||
|---|---|---|---|
| Quadrant | BADHDUFLAG | Total packets | Discarded packets |
| A | 0 | 11 | 0 |
| B | 0 | 11 | 0 |
| C | 0 | 11 | 0 |
| D | 0 | 11 | 0 |
| Mode M0 | |||
|---|---|---|---|
| Quadrant | BADHDUFLAG | Total packets | Discarded packets |
| A | 0 | 13141 | 2 |
| B | 0 | 15143 | 1 |
| C | 0 | 12192 | 1 |
| D | 0 | 12711 | 1 |
| Quadrant | Total seconds | Saturated seconds | Saturation percentage |
|---|---|---|---|
| A | 6020 | 106 | 1.760797% |
| B | 6020 | 154 | 2.558140% |
| C | 6020 | 10 | 0.166113% |
| D | 6020 | 40 | 0.664452% |
Noise dominated data is calculated using 1-second bins in cleaned event files. If a bin has >2000 counts, and if more than 50% of those come from <1% of pixels, then it is considered to be noise-dominated and hence unusable.
| Quadrant | # 1 sec bins | Bins with >0 counts | Bins with >2000 counts | High rate bins dominated by noise | Noise dominated (total time) | Noise dominated (detector-on time) | Marked lightcurve |
|---|---|---|---|---|---|---|---|
| A | 7120 | 6021 | 74 | 74 | 1.04% | 1.23% | 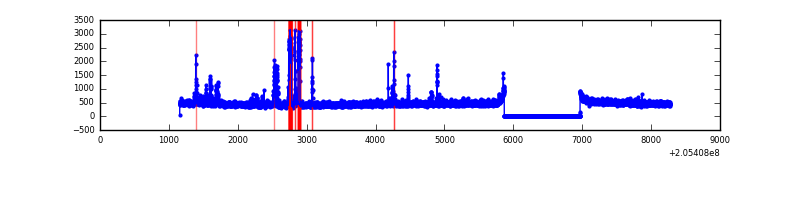 |
| B | 7120 | 6021 | 110 | 110 | 1.54% | 1.83% | 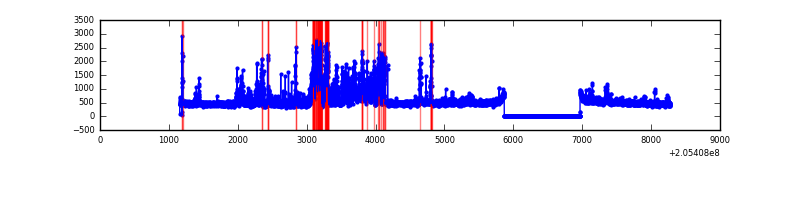 |
| C | 7120 | 6021 | 1 | 1 | 0.01% | 0.02% | 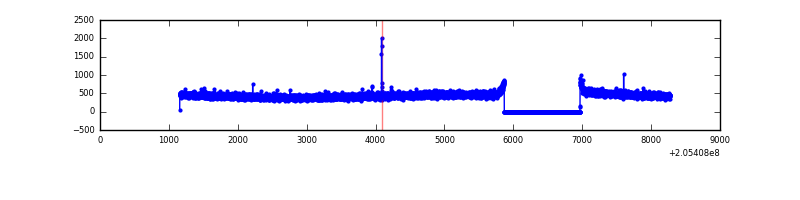 |
| D | 7120 | 6021 | 23 | 23 | 0.32% | 0.38% | 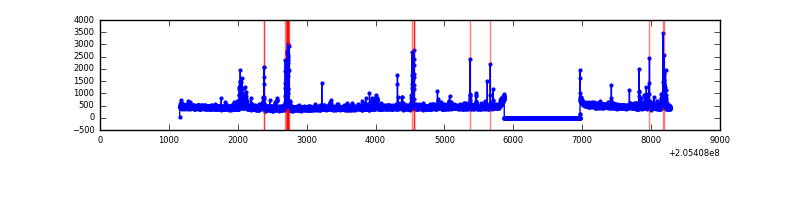 |
Top three noisy pixels from each quadrant. If the there are fewer than three noisy pixels in the level2.evt file, extra rows are filled as -1
| Pixel properties | Quadrant properties | ||||||
|---|---|---|---|---|---|---|---|
| Quadrant | DetID | PixID | Counts | Sigma | Mean | Median | Sigma |
| A | 0 | 199 | 280313 | 1918.11 | 705 | 690 | 145.8 |
| A | 0 | 226 | 32706 | 219.62 | 705 | 690 | 145.8 |
| A | 0 | 50 | 27450 | 183.56 | 705 | 690 | 145.8 |
| B | 14 | 167 | 651700 | 4747.84 | 704 | 688 | 137.1 |
| B | 10 | 16 | 342572 | 2493.37 | 704 | 688 | 137.1 |
| B | 4 | 48 | 24197 | 171.45 | 704 | 688 | 137.1 |
| C | 9 | 144 | 8650 | 50.37 | 679 | 682 | 158.2 |
| C | 13 | 61 | 5603 | 31.11 | 679 | 682 | 158.2 |
| C | 7 | 222 | 5325 | 29.35 | 679 | 682 | 158.2 |
| D | 13 | 239 | 135435 | 812.64 | 684 | 664 | 165.8 |
| D | 12 | 233 | 41787 | 247.96 | 684 | 664 | 165.8 |
| D | 2 | 232 | 29689 | 175.01 | 684 | 664 | 165.8 |
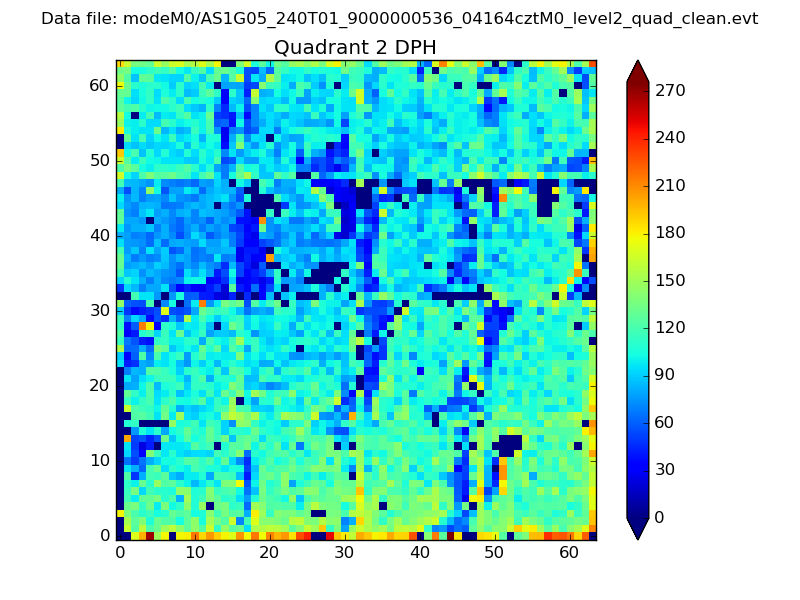
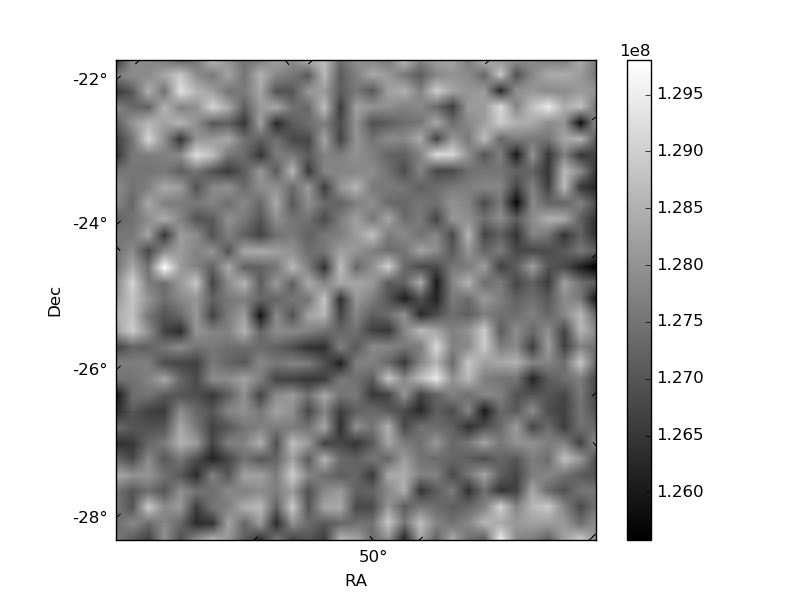
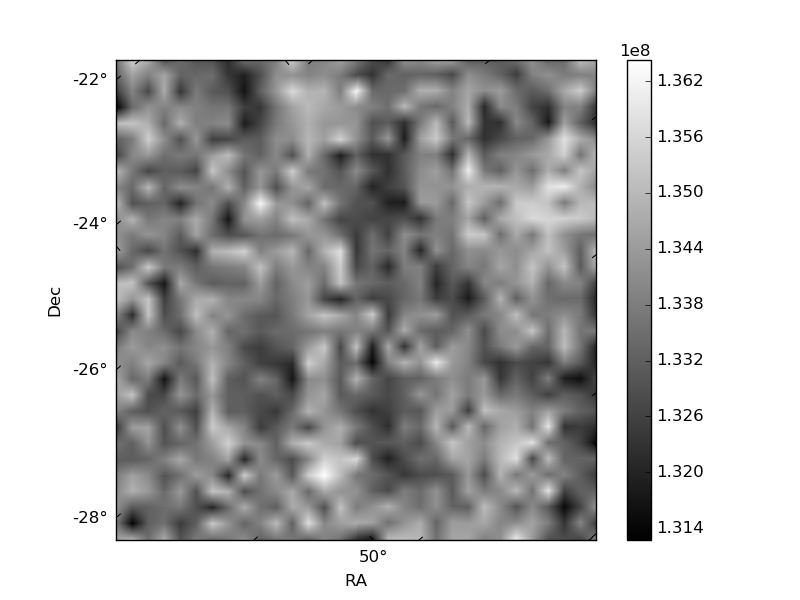
Histogram calculated using DETX and DETY for each event in the final _common_clean file
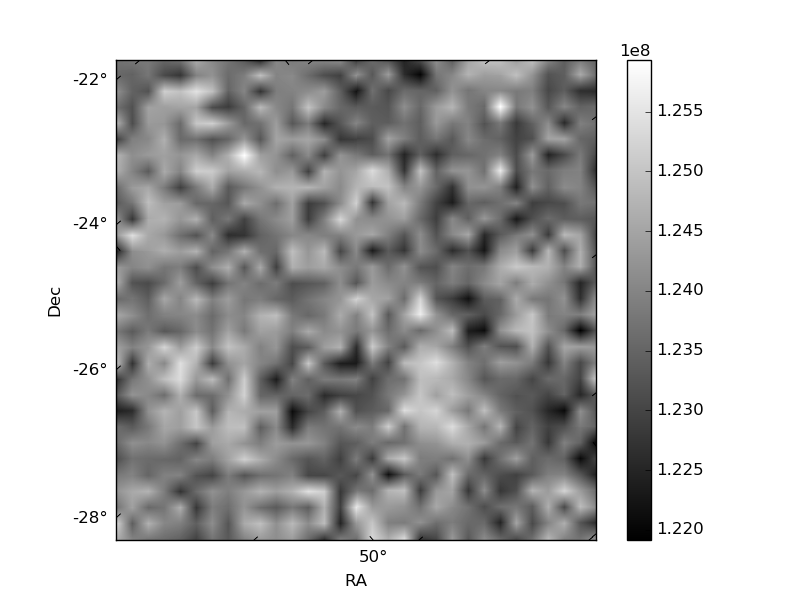
| Quadrant A | 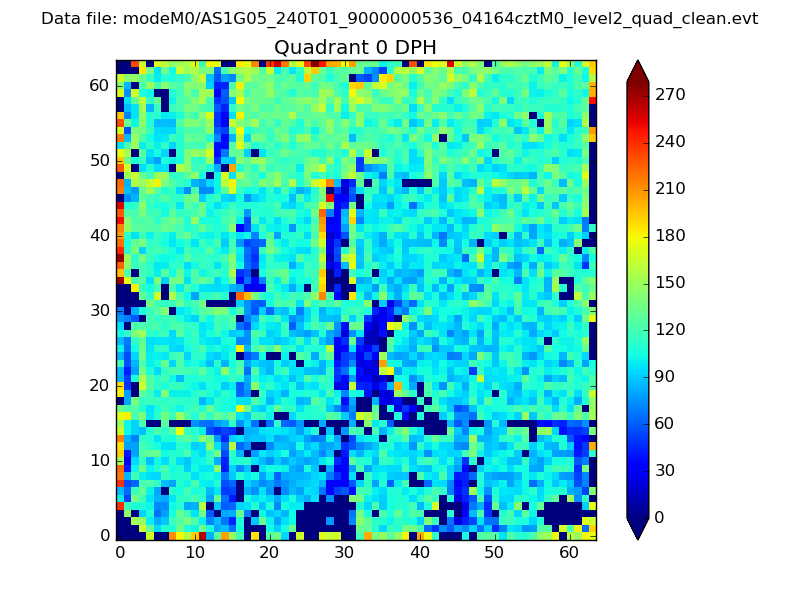 |
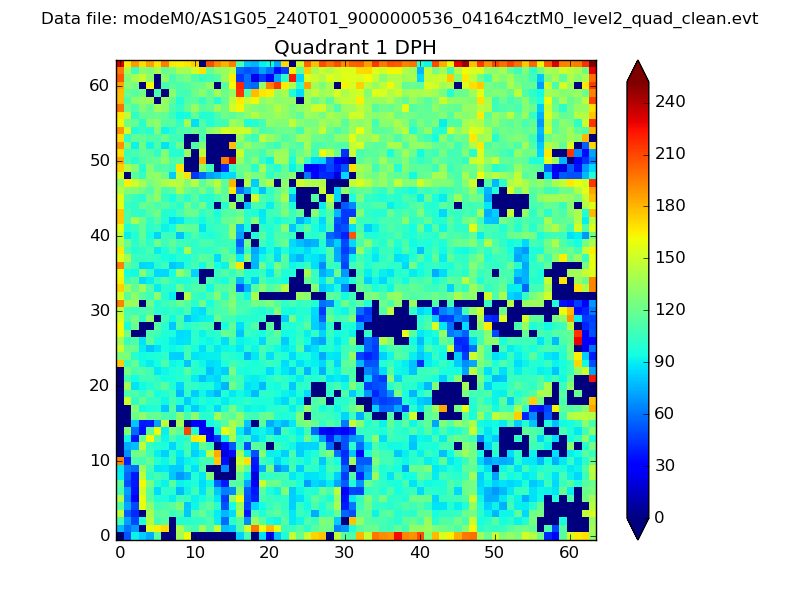 |
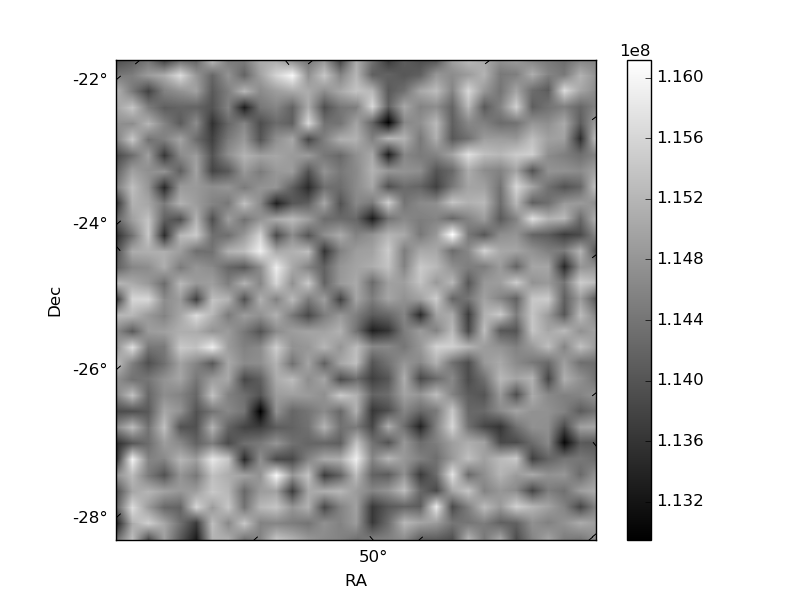
Quadrant B |
|---|---|---|---|
| Quadrant D | 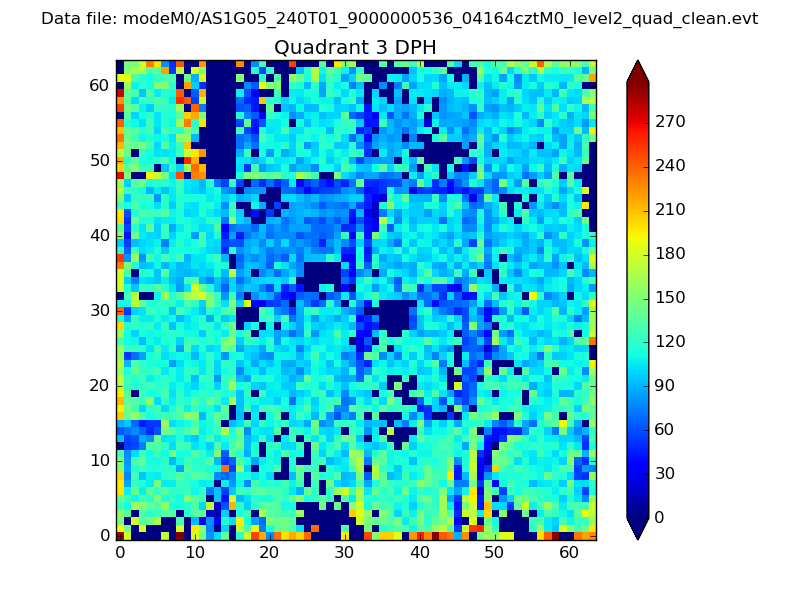 |
 |
Quadrant C |
| Plot type | Count rate plots | Images |
|---|---|---|
| Comparison with Poisson distribution Blue bars denote a histogram of data divided into 1 sec bins. Red curve is a Poisson curve with rate = median count rate of data. |
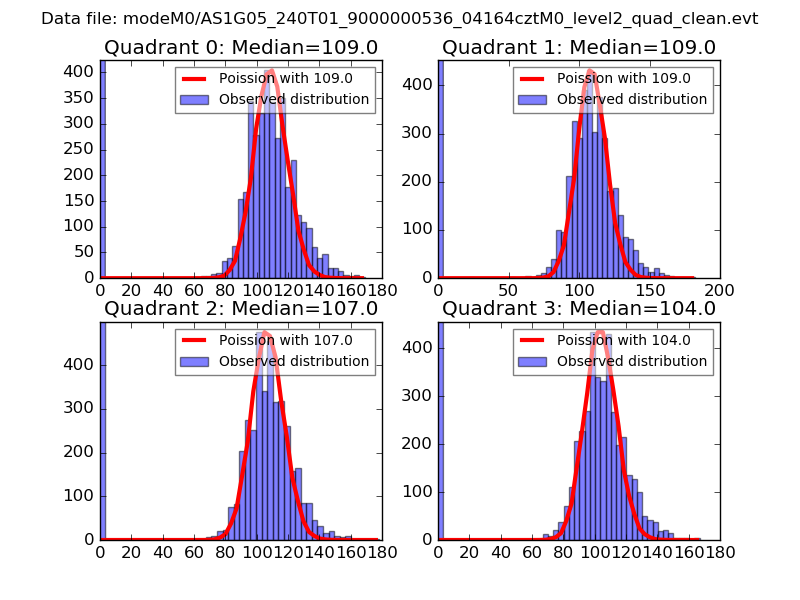 |
 |
| Quadrant-wise count rates Data is divided into 100 sec bins |
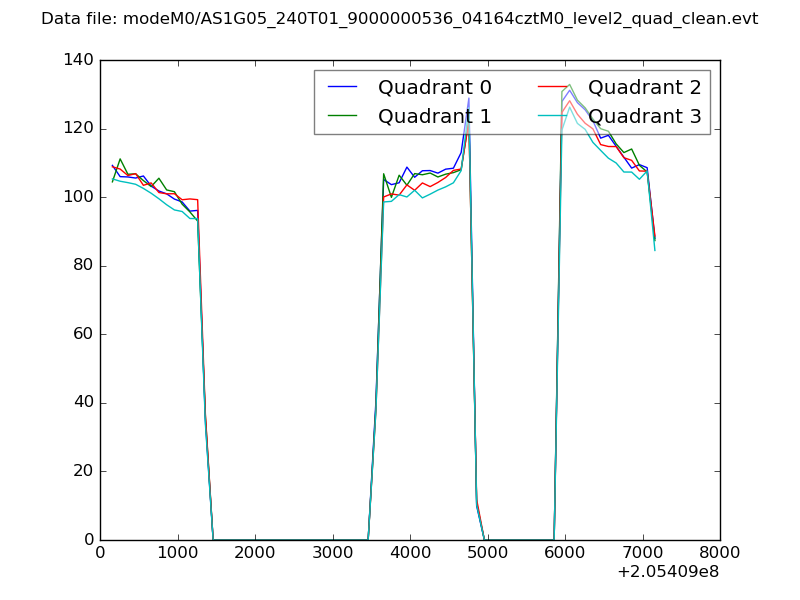 |
|
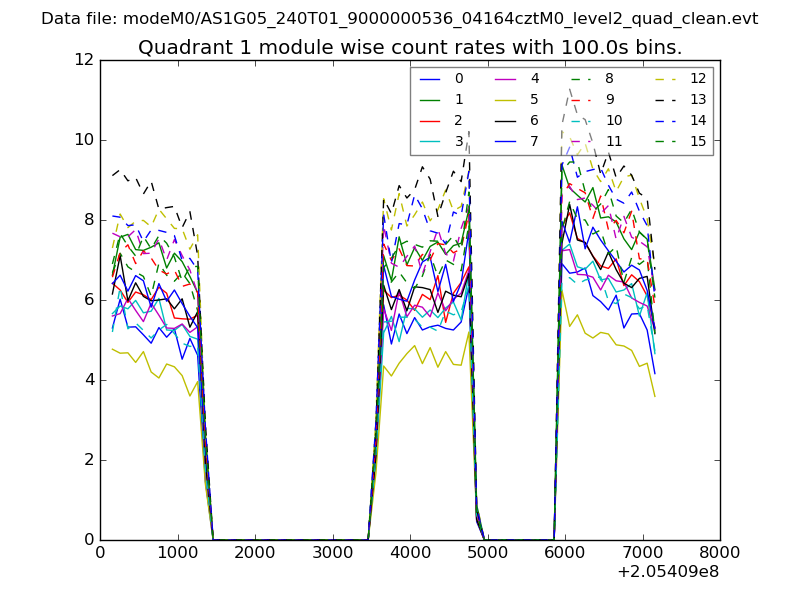
| Module-wise count rates for Quadrant A Data is divided into 100 sec bins |
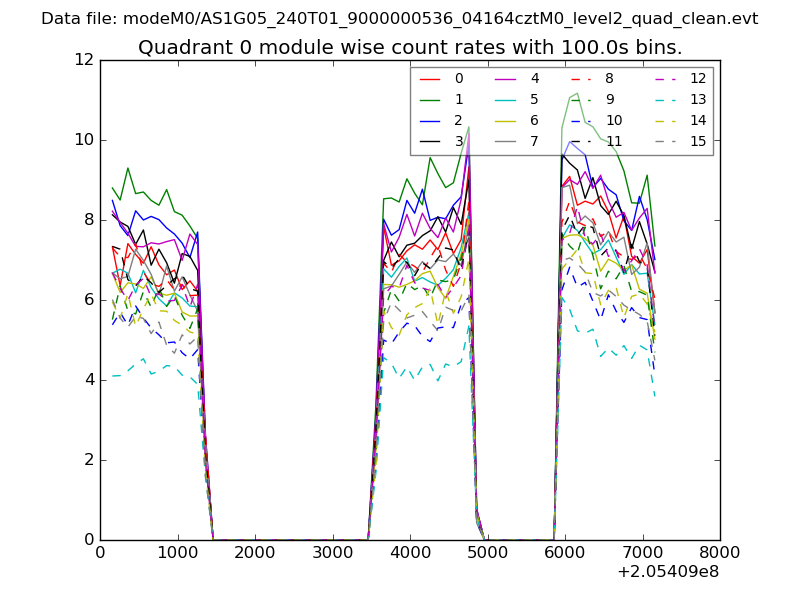 |
 |
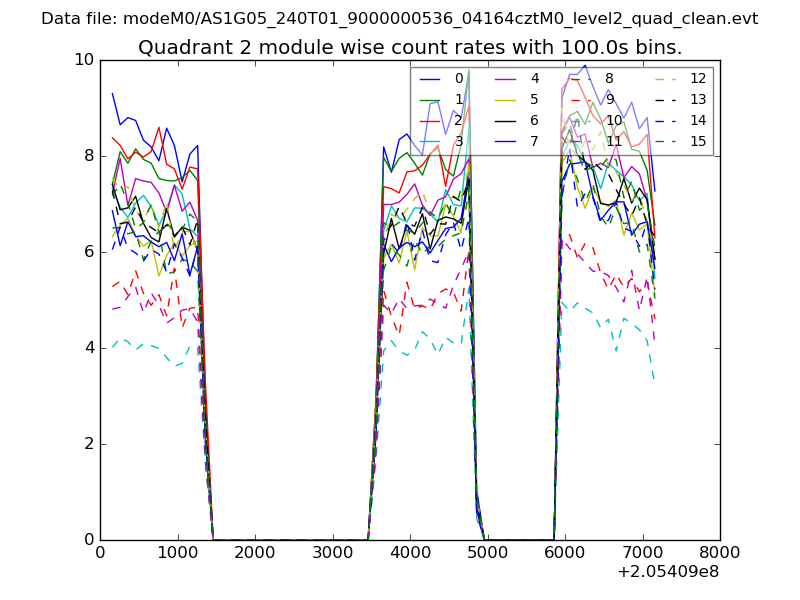
| Module-wise count rates for Quadrant B Data is divided into 100 sec bins |
 |
 |
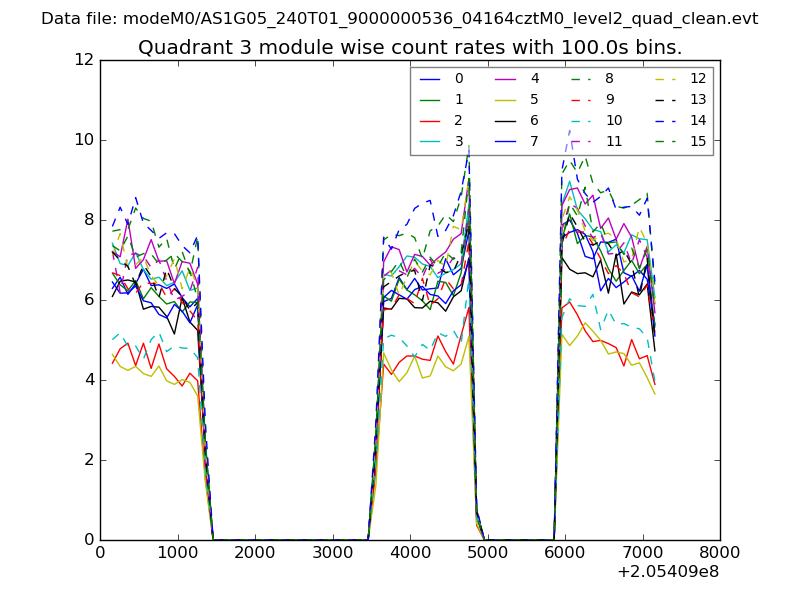
| Module-wise count rates for Quadrant C Data is divided into 100 sec bins |
 |
 |
| Module-wise count rates for Quadrant D Data is divided into 100 sec bins |
 |
 |
| Parameter | Plot |
|---|---|
| CZT HV Monitor | 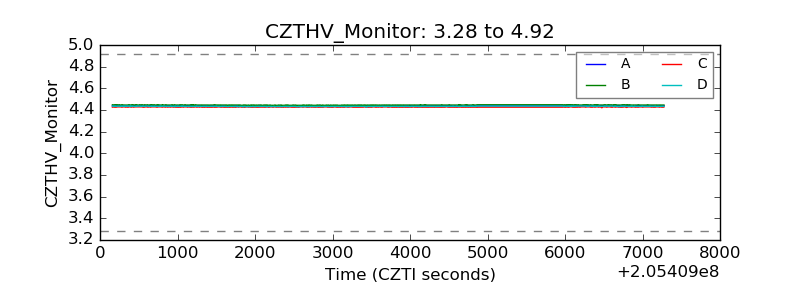 |
| D_VDD | 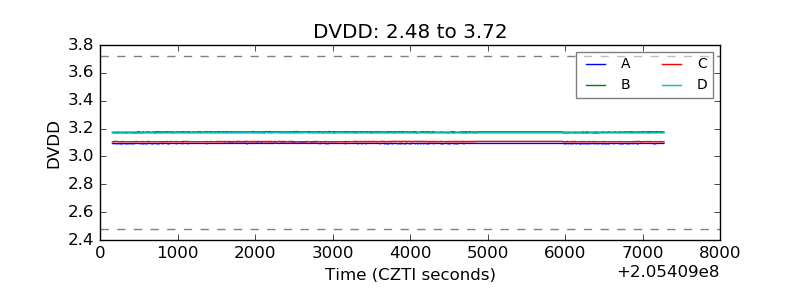 |
| Temperature 1 | 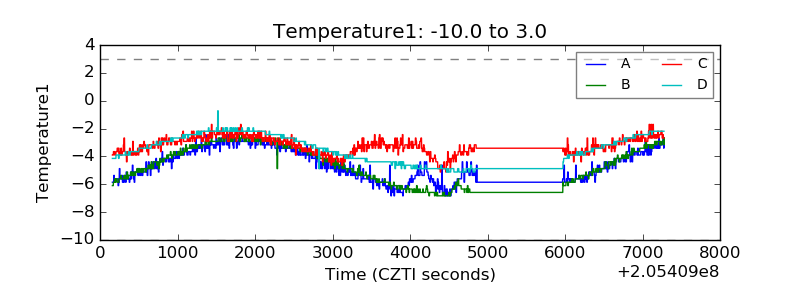 |
| Veto HV Monitor | 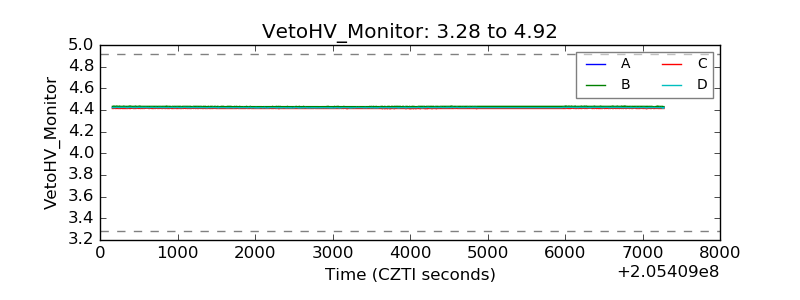 |
| Veto LLD | 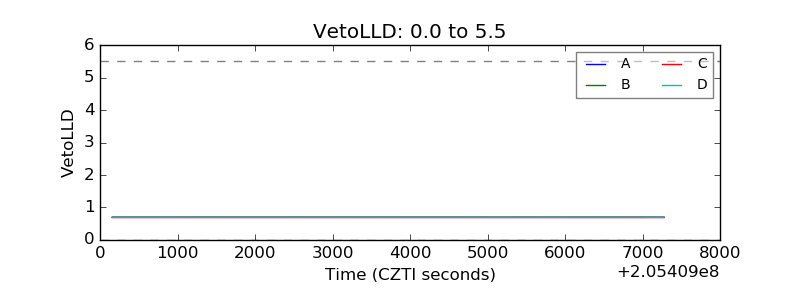 |
| Alpha Counter | 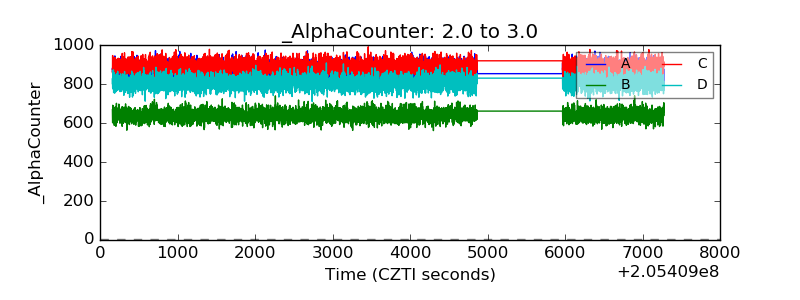 |
| _CPM_Rate |  |
| CZT Counter | 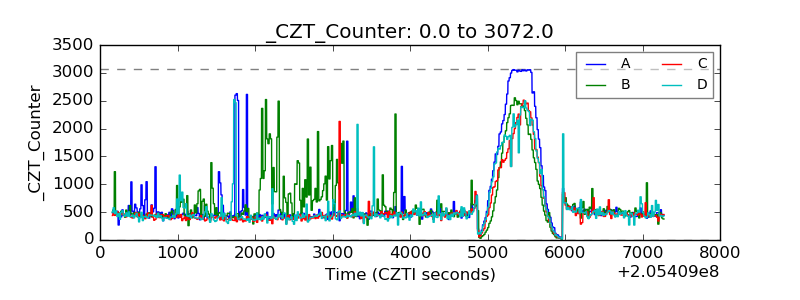 |
| +2.5 Volts monitor |  |
| +5 Volts monitor |  |
| _ROLL_ROT | 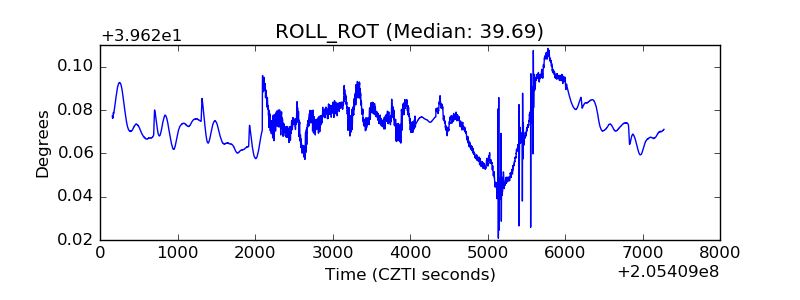 |
| _Roll_DEC | 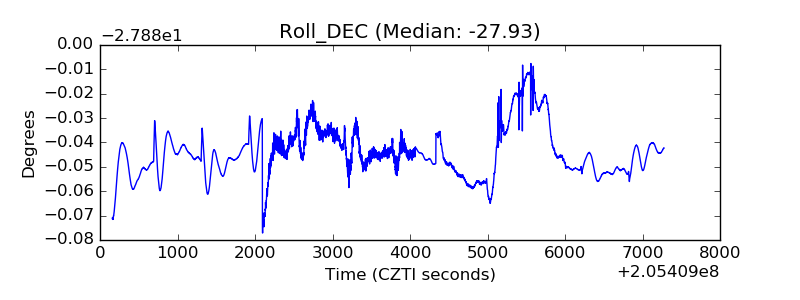 |
| _Roll_RA |  |
| Veto Counter | 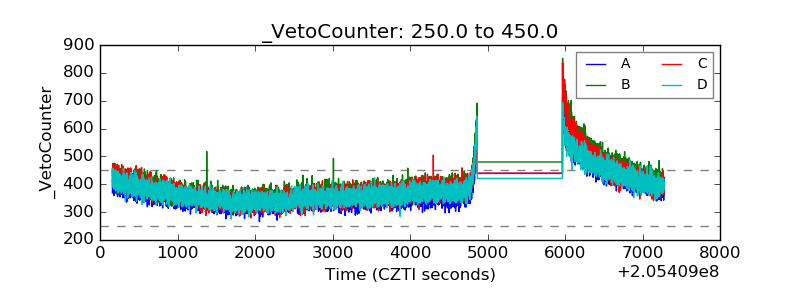 |