| Param | Original file | Final file |
|---|---|---|
| Filename | modeM0/AS1G05_240T01_9000000536_04166cztM0_level2.evt | modeM0/AS1G05_240T01_9000000536_04166cztM0_level2_quad_clean.evt |
| Size (bytes) | 444,461,760 | 63,869,760 |
| Size | 423.9 MB | 60.9 MB |
| Events in quadrant A | 3,418,455 | 382,797 |
| Events in quadrant B | 3,411,004 | 387,393 |
| Events in quadrant C | 2,811,302 | 375,730 |
| Events in quadrant D | 3,402,902 | 359,216 |
| Mode SS | |||
|---|---|---|---|
| Quadrant | BADHDUFLAG | Total packets | Discarded packets |
| A | 0 | 124 | 0 |
| B | 0 | 124 | 0 |
| C | 0 | 124 | 0 |
| D | 0 | 124 | 0 |
| Mode M9 | |||
|---|---|---|---|
| Quadrant | BADHDUFLAG | Total packets | Discarded packets |
| A | 0 | 12 | 0 |
| B | 0 | 12 | 0 |
| C | 0 | 12 | 0 |
| D | 0 | 12 | 0 |
| Mode M0 | |||
|---|---|---|---|
| Quadrant | BADHDUFLAG | Total packets | Discarded packets |
| A | 0 | 14268 | 2 |
| B | 0 | 14004 | 1 |
| C | 0 | 12498 | 1 |
| D | 0 | 14468 | 1 |
| Quadrant | Total seconds | Saturated seconds | Saturation percentage |
|---|---|---|---|
| A | 6140 | 82 | 1.335505% |
| B | 6140 | 83 | 1.351792% |
| C | 6140 | 24 | 0.390879% |
| D | 6140 | 108 | 1.758958% |
Noise dominated data is calculated using 1-second bins in cleaned event files. If a bin has >2000 counts, and if more than 50% of those come from <1% of pixels, then it is considered to be noise-dominated and hence unusable.
| Quadrant | # 1 sec bins | Bins with >0 counts | Bins with >2000 counts | High rate bins dominated by noise | Noise dominated (total time) | Noise dominated (detector-on time) | Marked lightcurve |
|---|---|---|---|---|---|---|---|
| A | 7315 | 6141 | 8 | 8 | 0.11% | 0.13% | 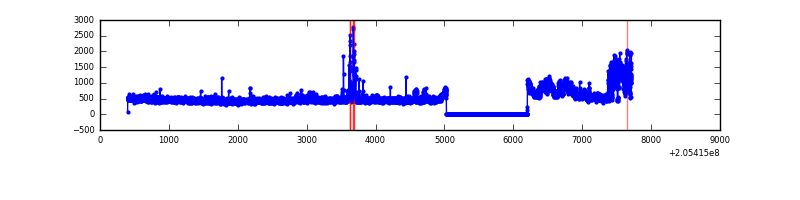 |
| B | 7315 | 6141 | 26 | 26 | 0.36% | 0.42% | 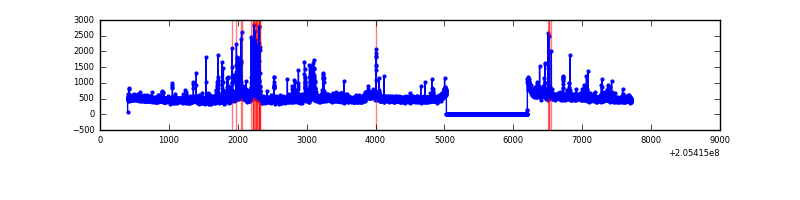 |
| C | 7315 | 6141 | 0 | 0 | 0.00% | 0.00% | 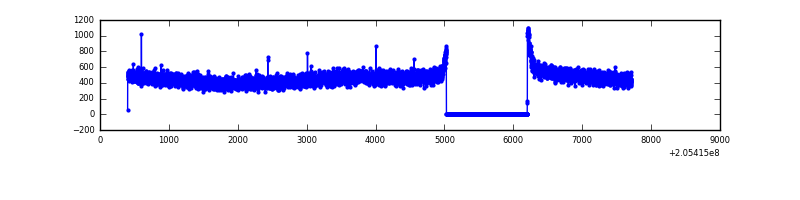 |
| D | 7315 | 6141 | 45 | 45 | 0.62% | 0.73% | 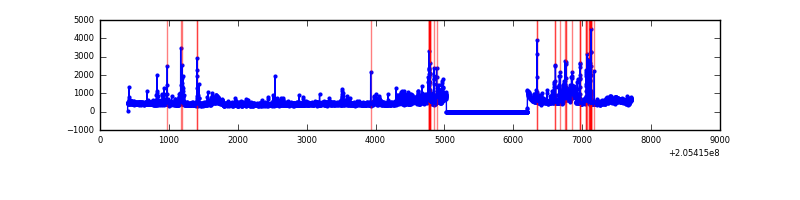 |
Top three noisy pixels from each quadrant. If the there are fewer than three noisy pixels in the level2.evt file, extra rows are filled as -1
| Pixel properties | Quadrant properties | ||||||
|---|---|---|---|---|---|---|---|
| Quadrant | DetID | PixID | Counts | Sigma | Mean | Median | Sigma |
| A | 0 | 199 | 390484 | 2572.58 | 748 | 733 | 151.5 |
| A | 0 | 50 | 76070 | 497.27 | 748 | 733 | 151.5 |
| A | 0 | 226 | 43454 | 281.98 | 748 | 733 | 151.5 |
| B | 10 | 16 | 360060 | 2490.32 | 749 | 732 | 144.3 |
| B | 14 | 167 | 72162 | 495.04 | 749 | 732 | 144.3 |
| B | 4 | 81 | 30422 | 205.77 | 749 | 732 | 144.3 |
| C | 9 | 144 | 17081 | 97.9 | 715 | 718 | 167.1 |
| C | 13 | 61 | 5976 | 31.46 | 715 | 718 | 167.1 |
| C | 3 | 202 | 1820 | 6.59 | 715 | 718 | 167.1 |
| D | 2 | 63 | 239720 | 1373.05 | 718 | 697 | 174.1 |
| D | 2 | 232 | 184750 | 1057.28 | 718 | 697 | 174.1 |
| D | 13 | 239 | 104396 | 595.69 | 718 | 697 | 174.1 |
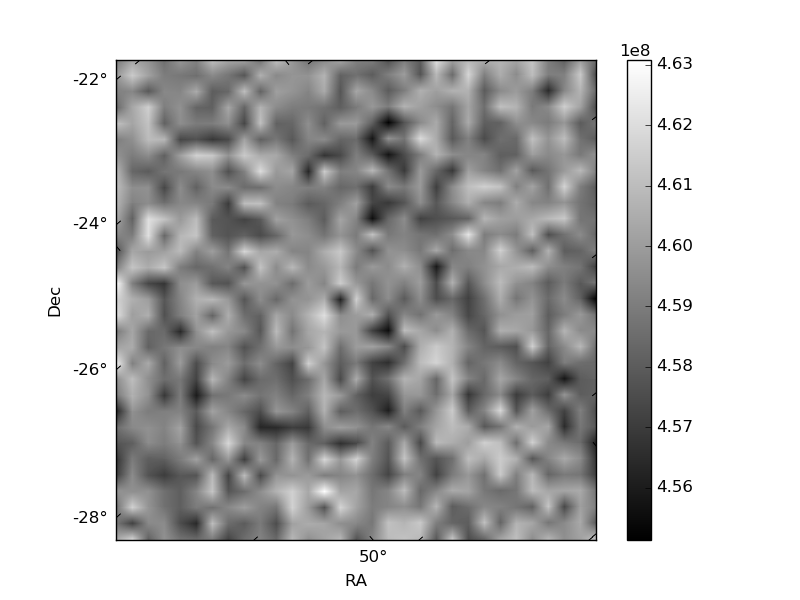
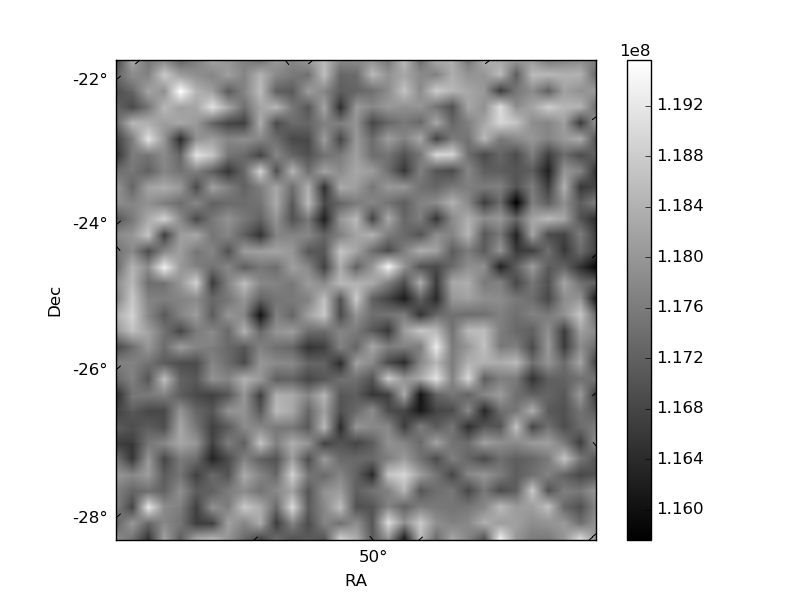
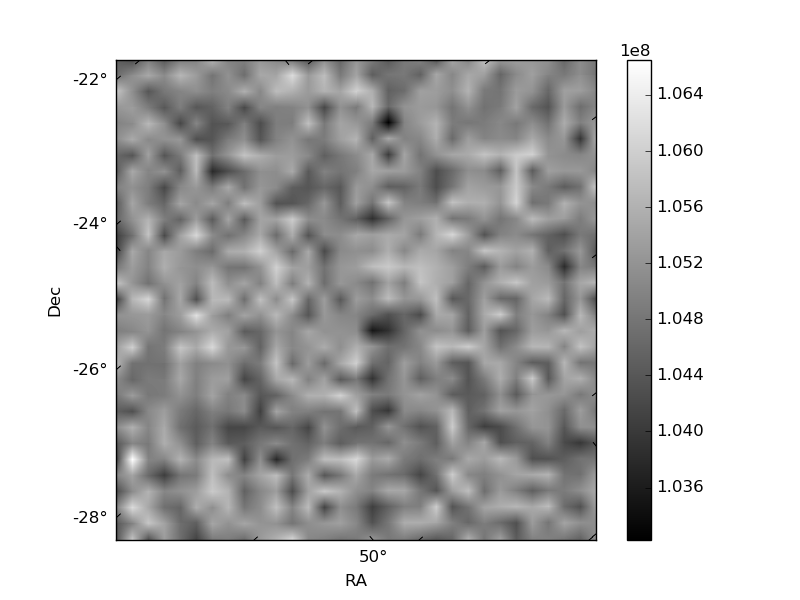
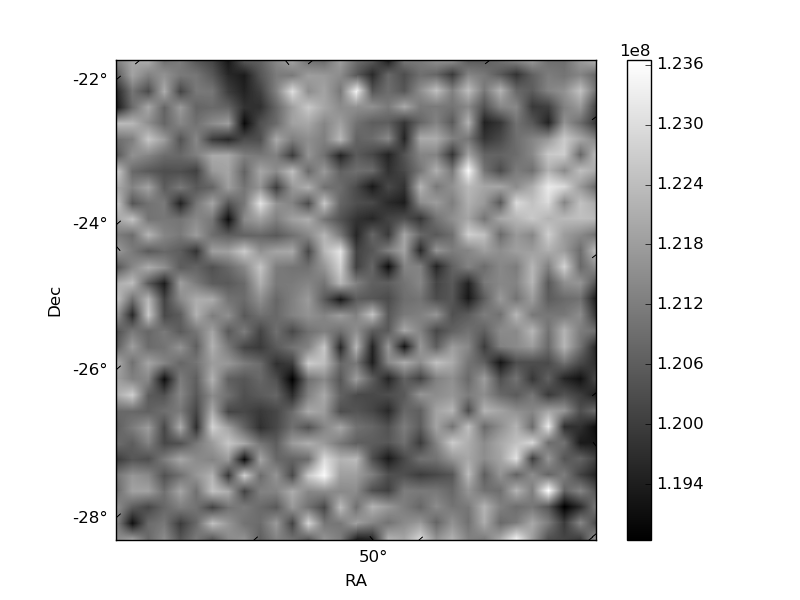
Histogram calculated using DETX and DETY for each event in the final _common_clean file
| Quadrant A | 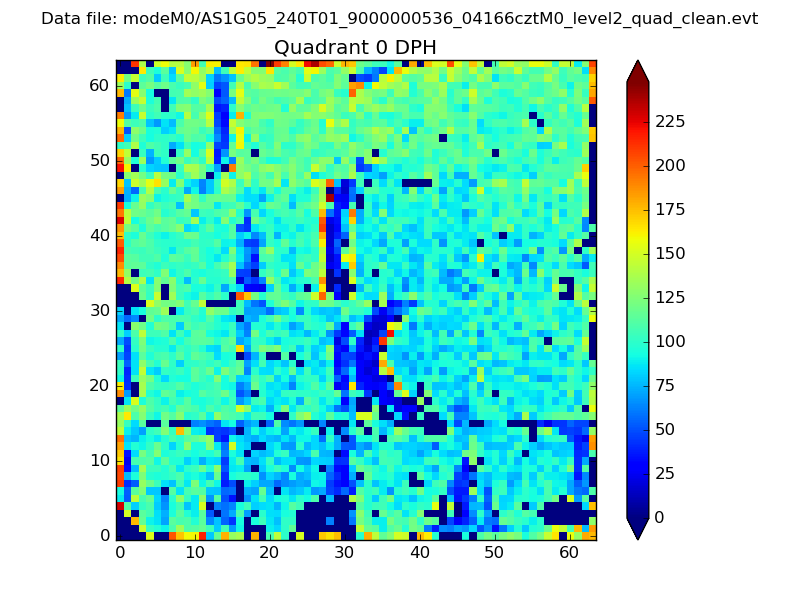 |
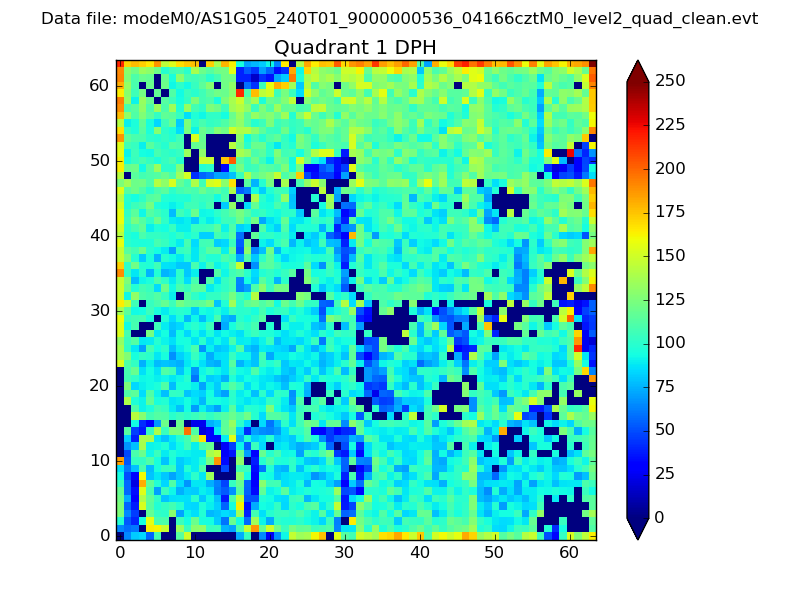 |
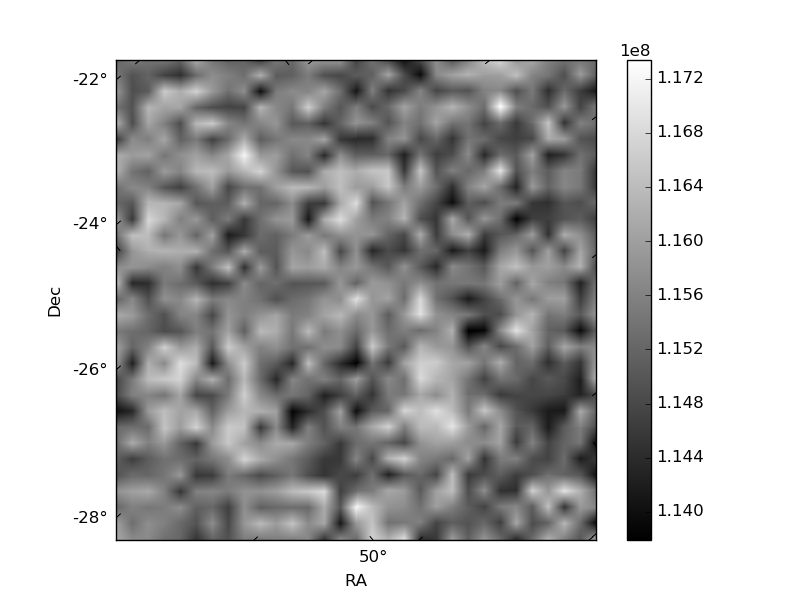
Quadrant B |
|---|---|---|---|
| Quadrant D | 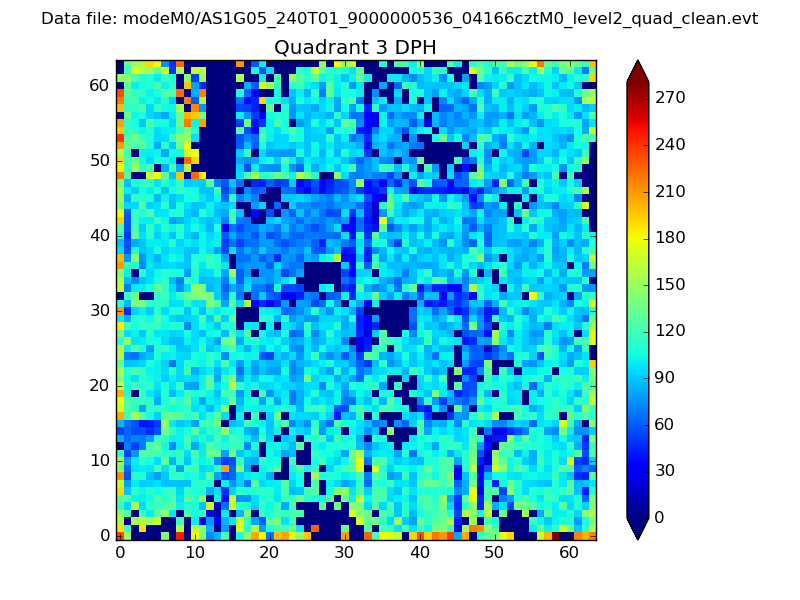 |
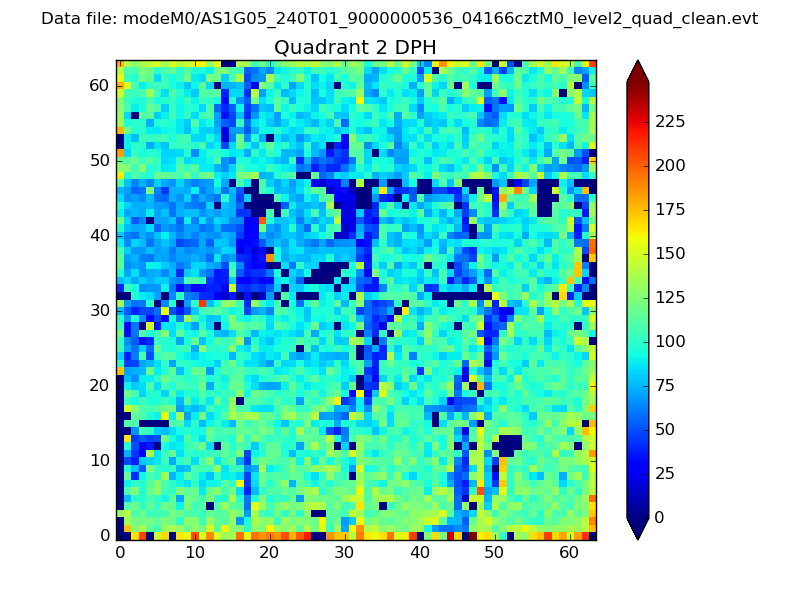 |
Quadrant C |
| Plot type | Count rate plots | Images |
|---|---|---|
| Comparison with Poisson distribution Blue bars denote a histogram of data divided into 1 sec bins. Red curve is a Poisson curve with rate = median count rate of data. |
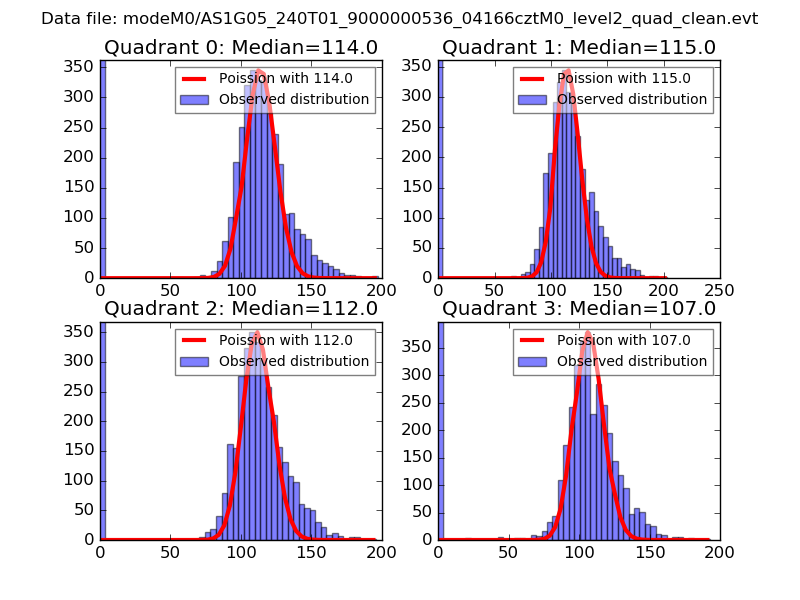 |
 |
| Quadrant-wise count rates Data is divided into 100 sec bins |
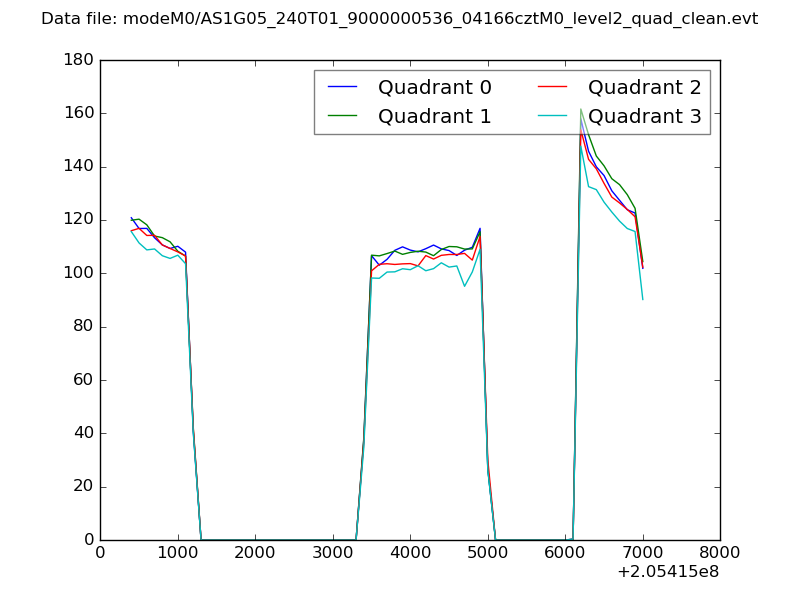 |
|
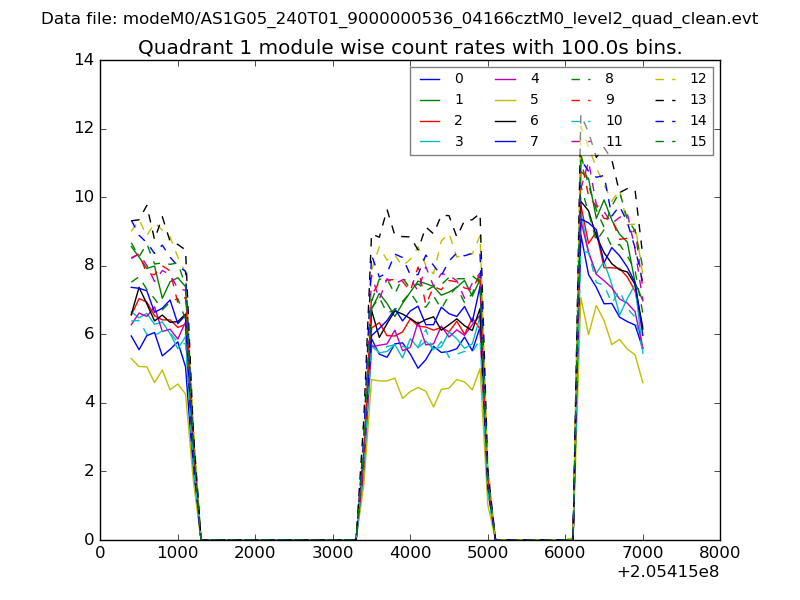
| Module-wise count rates for Quadrant A Data is divided into 100 sec bins |
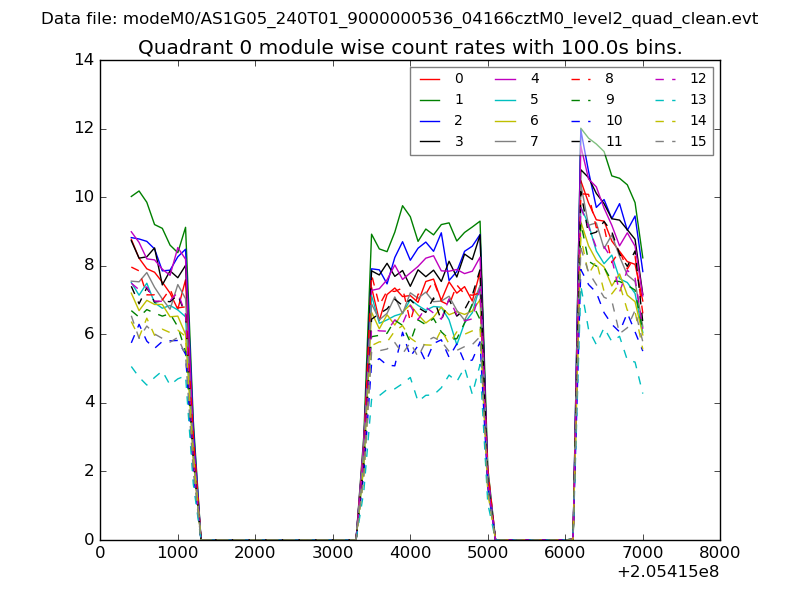 |
 |
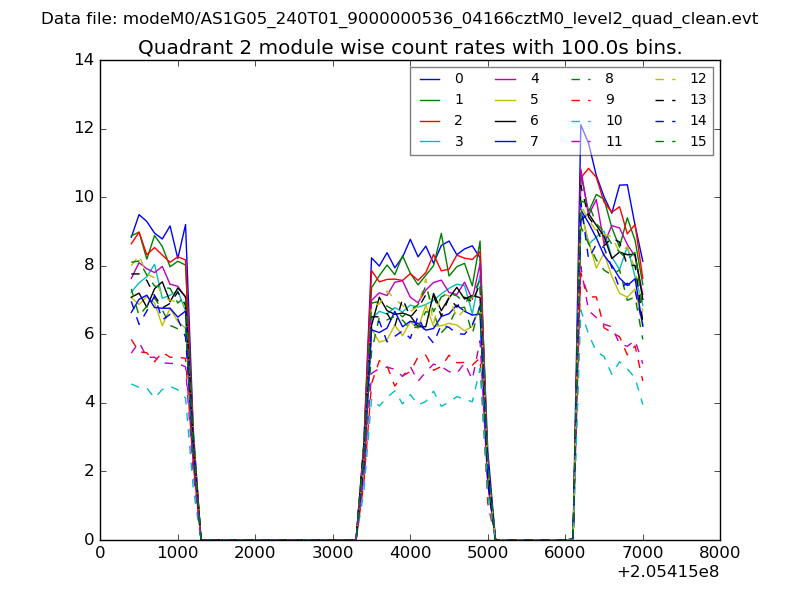
| Module-wise count rates for Quadrant B Data is divided into 100 sec bins |
 |
 |
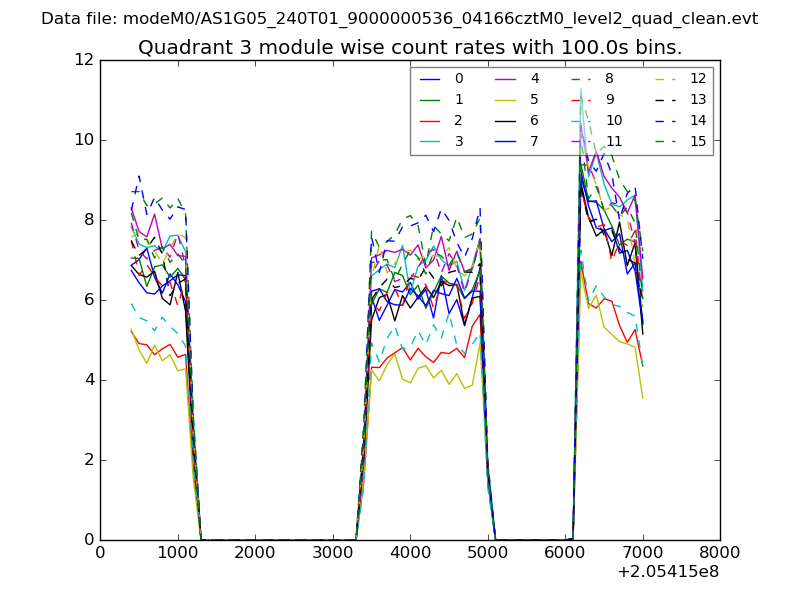
| Module-wise count rates for Quadrant C Data is divided into 100 sec bins |
 |
 |
| Module-wise count rates for Quadrant D Data is divided into 100 sec bins |
 |
 |
| Parameter | Plot |
|---|---|
| CZT HV Monitor | 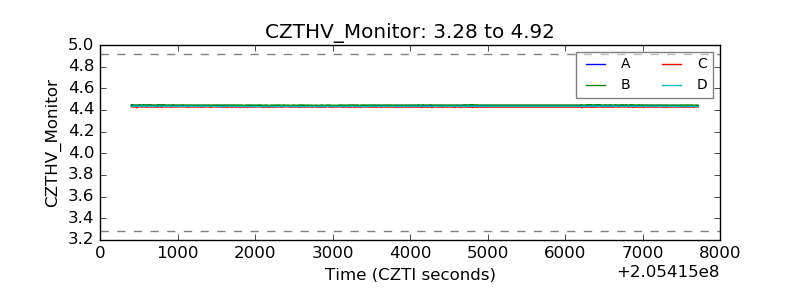 |
| D_VDD | 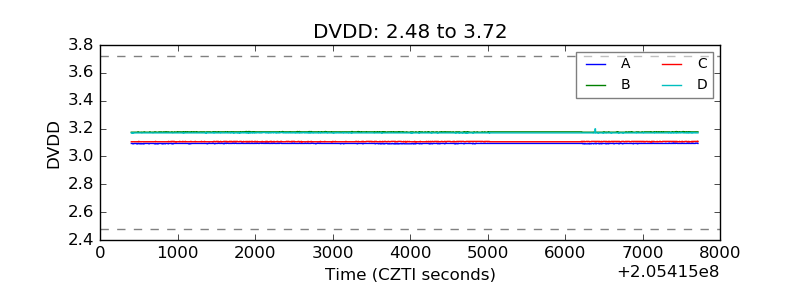 |
| Temperature 1 | 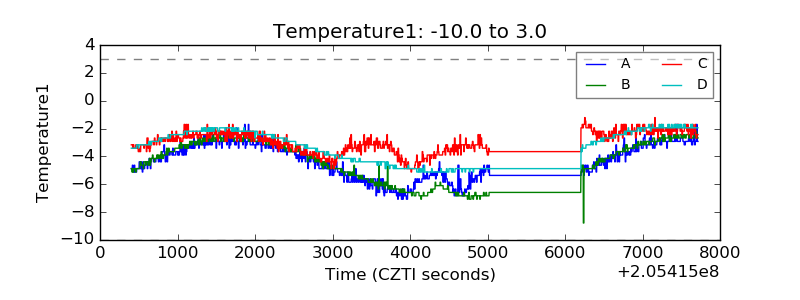 |
| Veto HV Monitor | 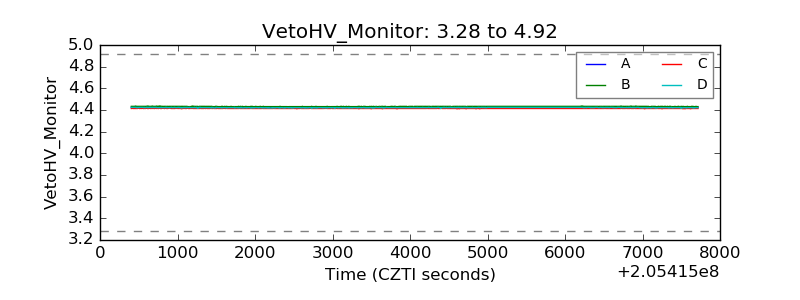 |
| Veto LLD | 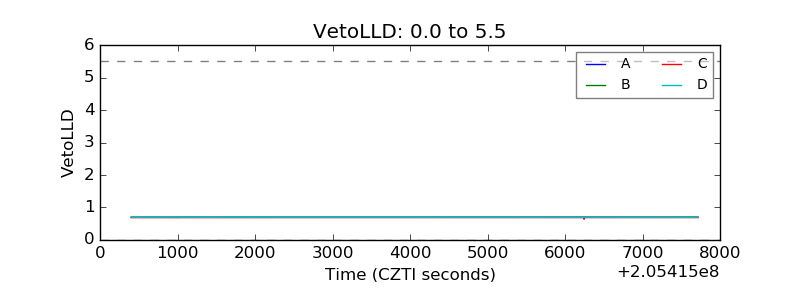 |
| Alpha Counter | 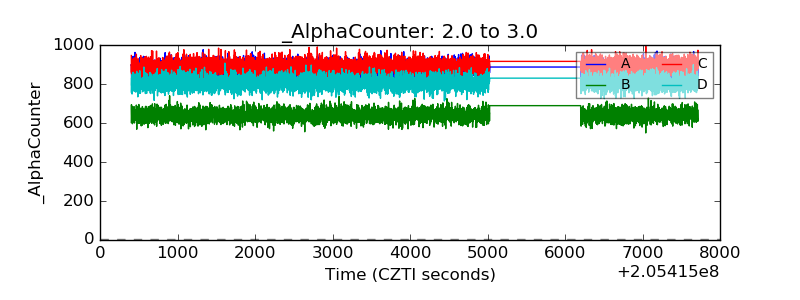 |
| _CPM_Rate | 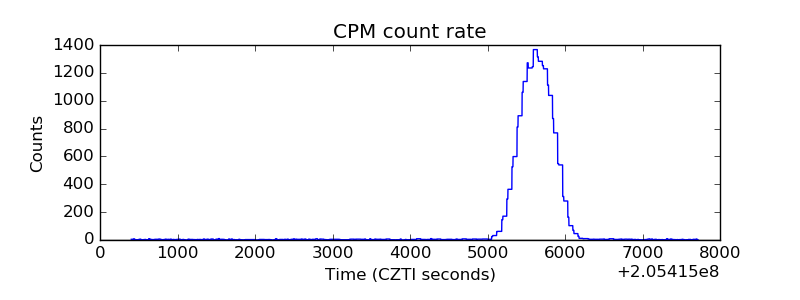 |
| CZT Counter | 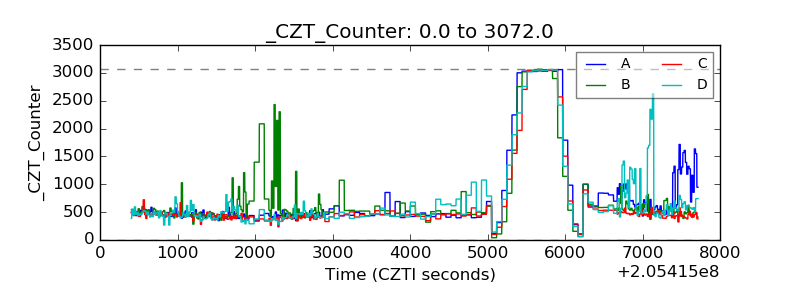 |
| +2.5 Volts monitor |  |
| +5 Volts monitor |  |
| _ROLL_ROT | 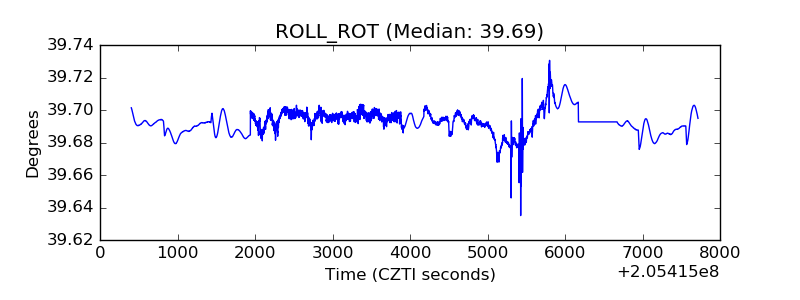 |
| _Roll_DEC | 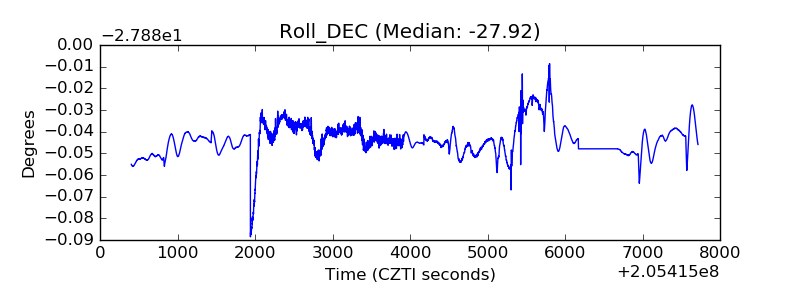 |
| _Roll_RA | 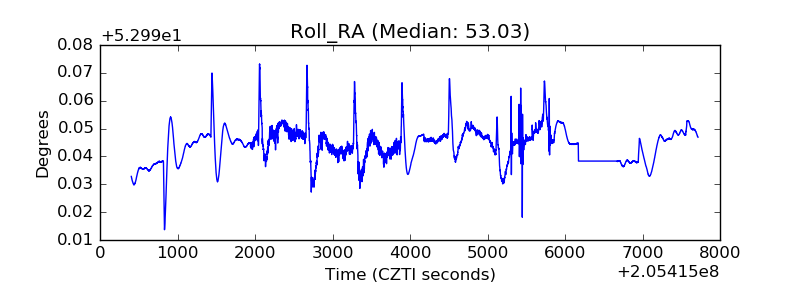 |
| Veto Counter | 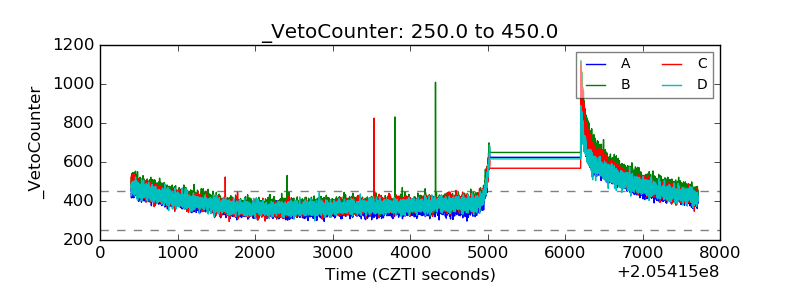 |