| Param | Original file | Final file |
|---|---|---|
| Filename | modeM0/AS1G05_240T01_9000000536_04167cztM0_level2.evt | modeM0/AS1G05_240T01_9000000536_04167cztM0_level2_quad_clean.evt |
| Size (bytes) | 463,746,240 | 57,084,480 |
| Size | 442.3 MB | 54.4 MB |
| Events in quadrant A | 3,894,625 | 332,525 |
| Events in quadrant B | 3,481,067 | 339,805 |
| Events in quadrant C | 2,792,303 | 327,609 |
| Events in quadrant D | 3,473,843 | 313,762 |
| Mode SS | |||
|---|---|---|---|
| Quadrant | BADHDUFLAG | Total packets | Discarded packets |
| A | 0 | 122 | 0 |
| B | 0 | 122 | 0 |
| C | 0 | 122 | 0 |
| D | 0 | 122 | 0 |
| Mode M9 | |||
|---|---|---|---|
| Quadrant | BADHDUFLAG | Total packets | Discarded packets |
| A | 0 | 12 | 0 |
| B | 0 | 12 | 0 |
| C | 0 | 12 | 0 |
| D | 0 | 12 | 0 |
| Mode M0 | |||
|---|---|---|---|
| Quadrant | BADHDUFLAG | Total packets | Discarded packets |
| A | 0 | 15386 | 2 |
| B | 0 | 14093 | 1 |
| C | 0 | 12169 | 1 |
| D | 0 | 14413 | 1 |
| Quadrant | Total seconds | Saturated seconds | Saturation percentage |
|---|---|---|---|
| A | 5927 | 212 | 3.576852% |
| B | 5927 | 149 | 2.513919% |
| C | 5927 | 57 | 0.961701% |
| D | 5927 | 107 | 1.805298% |
Noise dominated data is calculated using 1-second bins in cleaned event files. If a bin has >2000 counts, and if more than 50% of those come from <1% of pixels, then it is considered to be noise-dominated and hence unusable.
| Quadrant | # 1 sec bins | Bins with >0 counts | Bins with >2000 counts | High rate bins dominated by noise | Noise dominated (total time) | Noise dominated (detector-on time) | Marked lightcurve |
|---|---|---|---|---|---|---|---|
| A | 7162 | 5928 | 88 | 88 | 1.23% | 1.48% |  |
| B | 7162 | 5928 | 42 | 42 | 0.59% | 0.71% |  |
| C | 7162 | 5928 | 0 | 0 | 0.00% | 0.00% | 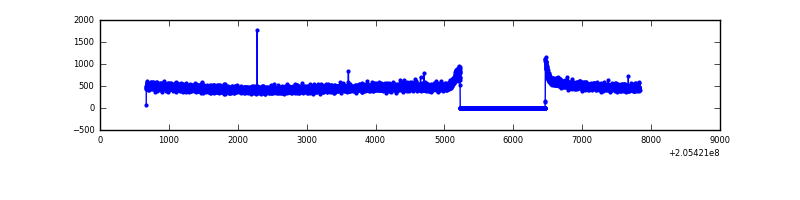 |
| D | 7162 | 5928 | 31 | 31 | 0.43% | 0.52% | 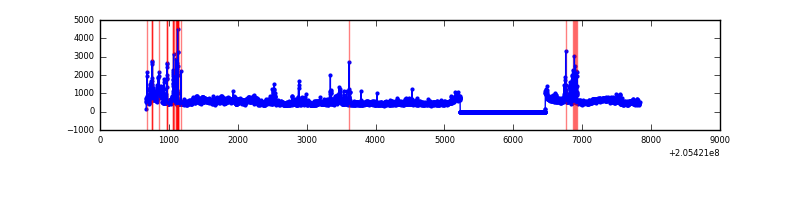 |
Top three noisy pixels from each quadrant. If the there are fewer than three noisy pixels in the level2.evt file, extra rows are filled as -1
| Pixel properties | Quadrant properties | ||||||
|---|---|---|---|---|---|---|---|
| Quadrant | DetID | PixID | Counts | Sigma | Mean | Median | Sigma |
| A | 0 | 199 | 664636 | 4409.03 | 742 | 727 | 150.6 |
| A | 0 | 50 | 281784 | 1866.5 | 742 | 727 | 150.6 |
| A | 0 | 226 | 69645 | 457.69 | 742 | 727 | 150.6 |
| B | 10 | 16 | 255768 | 1780.49 | 749 | 733 | 143.2 |
| B | 8 | 3 | 146427 | 1017.14 | 749 | 733 | 143.2 |
| B | 14 | 167 | 103015 | 714.07 | 749 | 733 | 143.2 |
| C | 13 | 61 | 5918 | 31.51 | 712 | 717 | 165.1 |
| C | 10 | 65 | 5510 | 29.04 | 712 | 717 | 165.1 |
| C | 9 | 144 | 3831 | 18.86 | 712 | 717 | 165.1 |
| D | 2 | 232 | 406365 | 2381.74 | 714 | 694 | 170.3 |
| D | 10 | 172 | 144137 | 842.17 | 714 | 694 | 170.3 |
| D | 2 | 63 | 93002 | 541.95 | 714 | 694 | 170.3 |
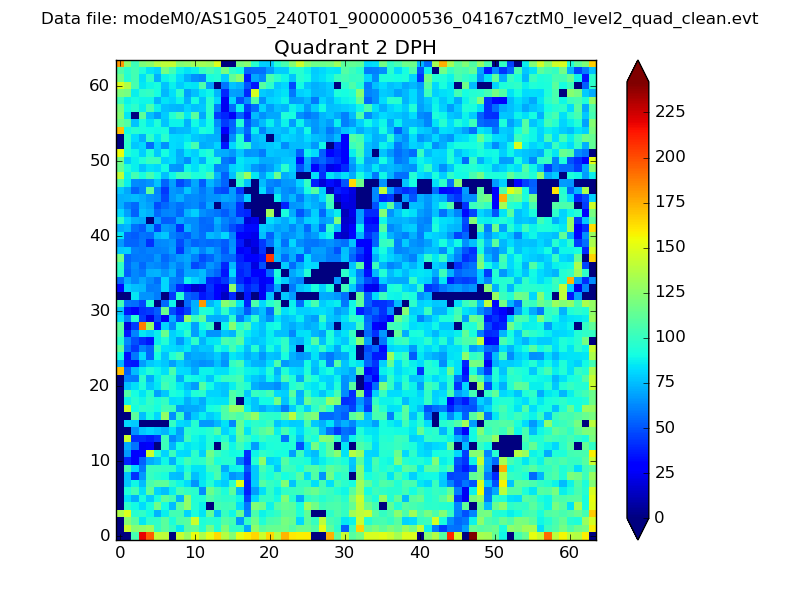
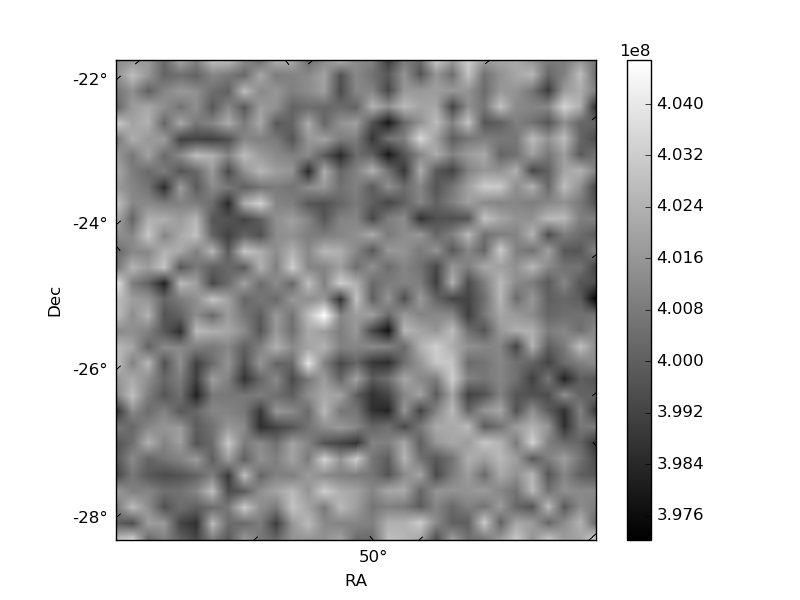
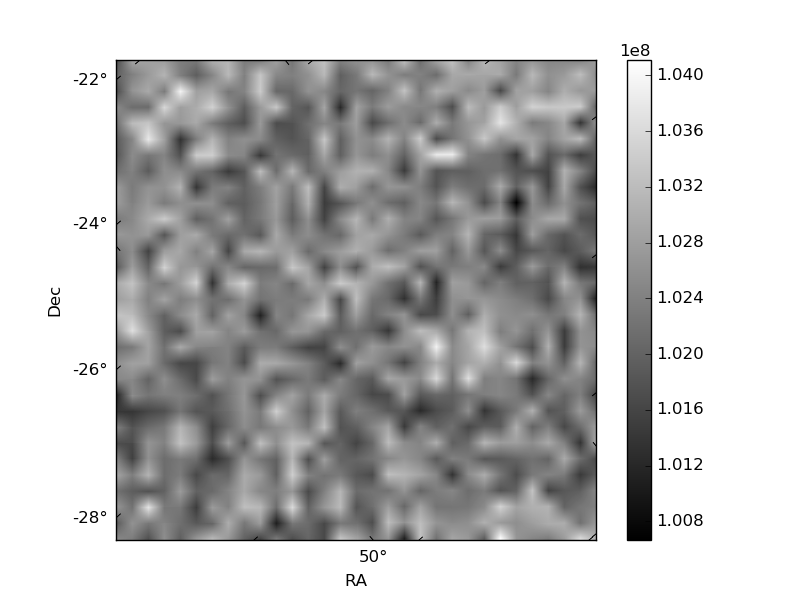
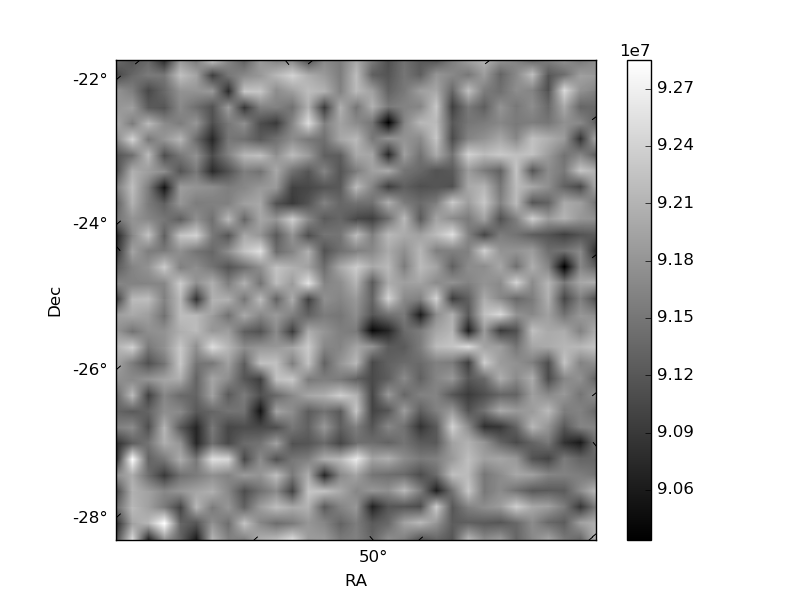
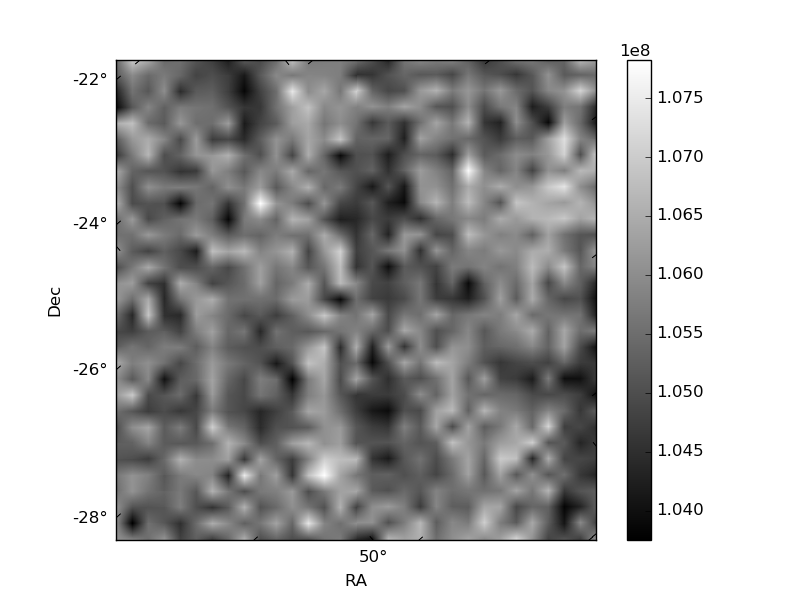
Histogram calculated using DETX and DETY for each event in the final _common_clean file
| Quadrant A |  |
 |
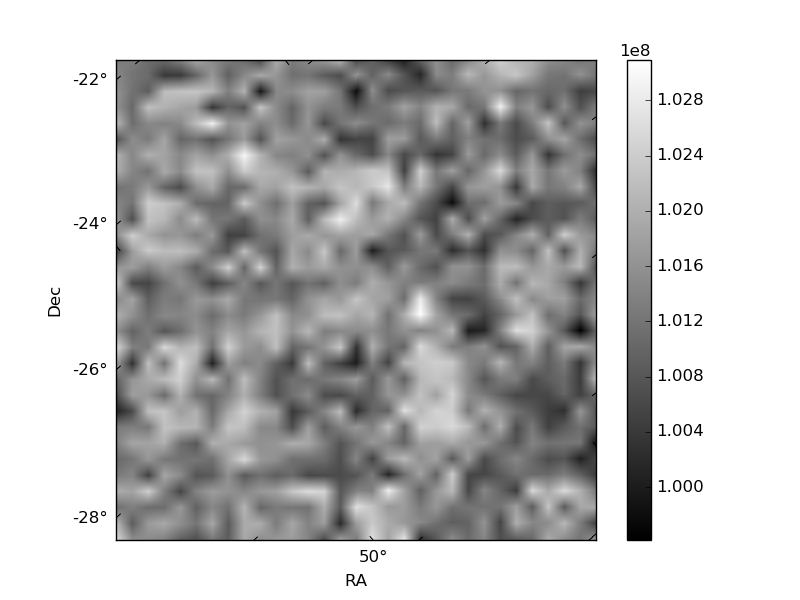
Quadrant B |
|---|---|---|---|
| Quadrant D | 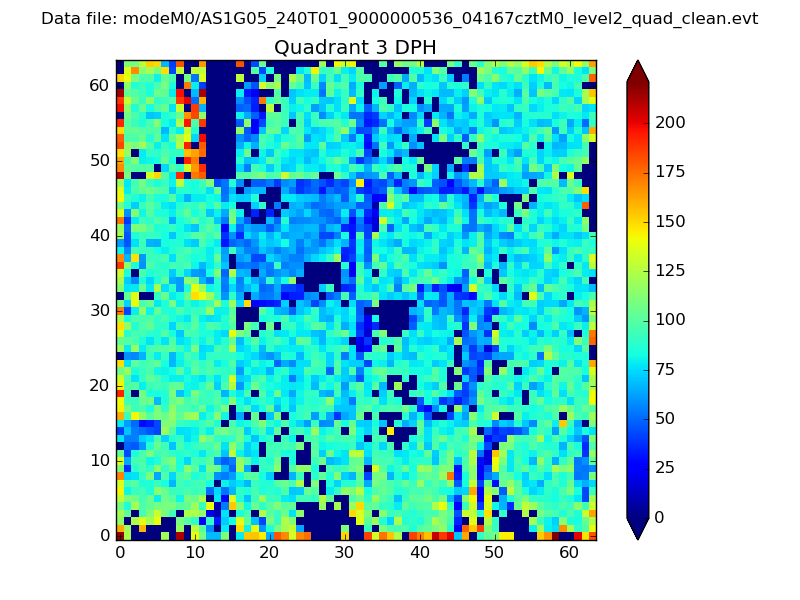 |
 |
Quadrant C |
| Plot type | Count rate plots | Images |
|---|---|---|
| Comparison with Poisson distribution Blue bars denote a histogram of data divided into 1 sec bins. Red curve is a Poisson curve with rate = median count rate of data. |
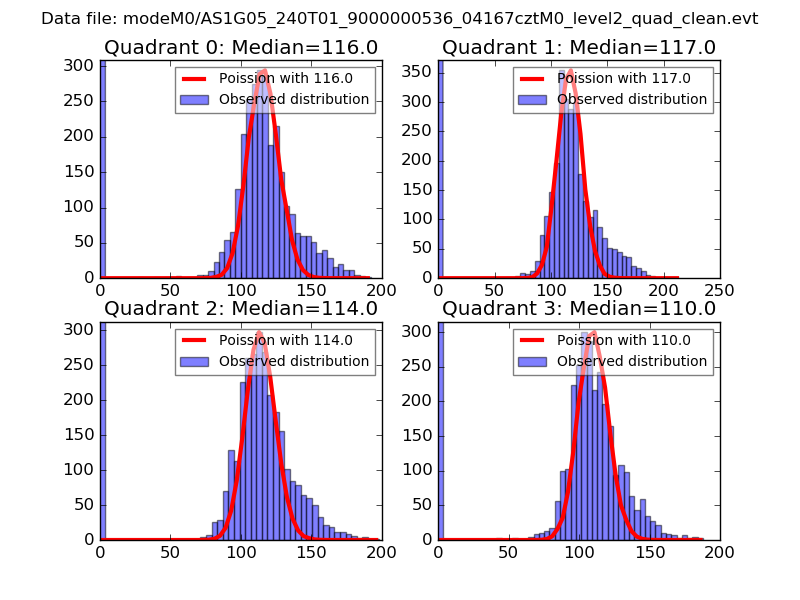 |
 |
| Quadrant-wise count rates Data is divided into 100 sec bins |
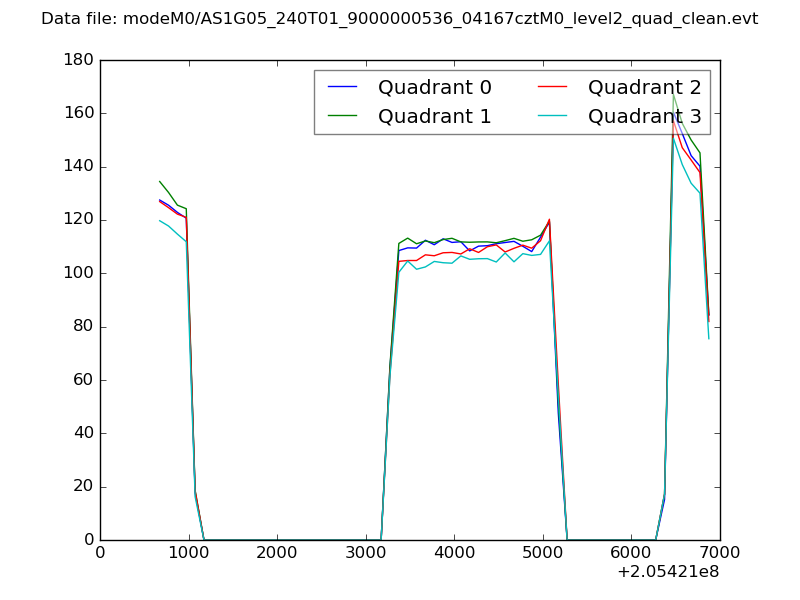 |
|
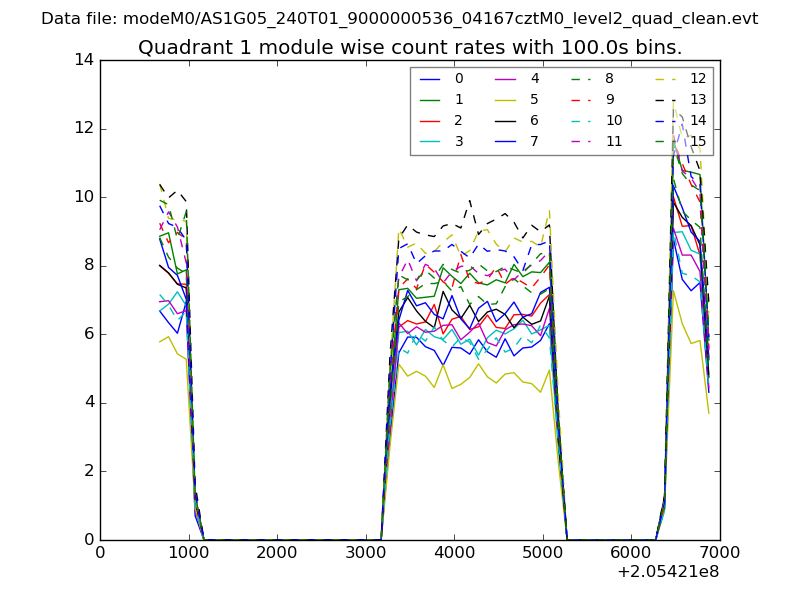
| Module-wise count rates for Quadrant A Data is divided into 100 sec bins |
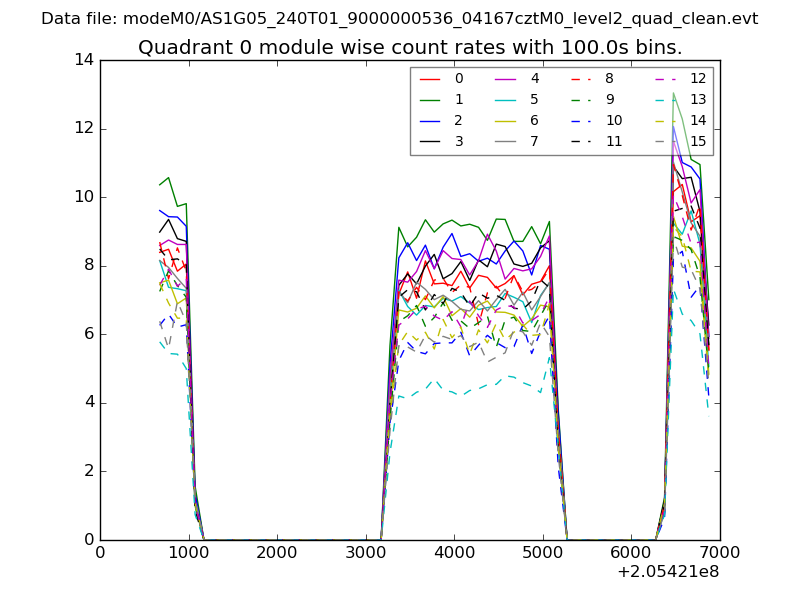 |
 |
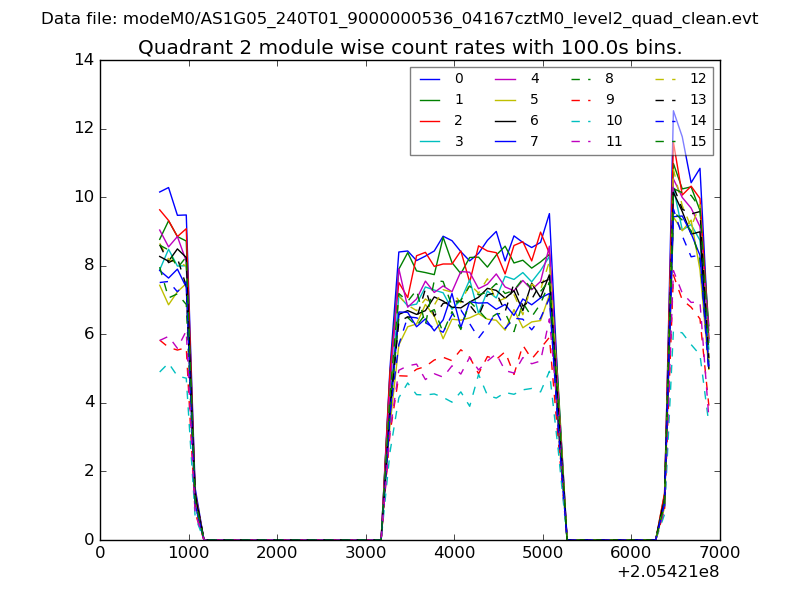
| Module-wise count rates for Quadrant B Data is divided into 100 sec bins |
 |
 |
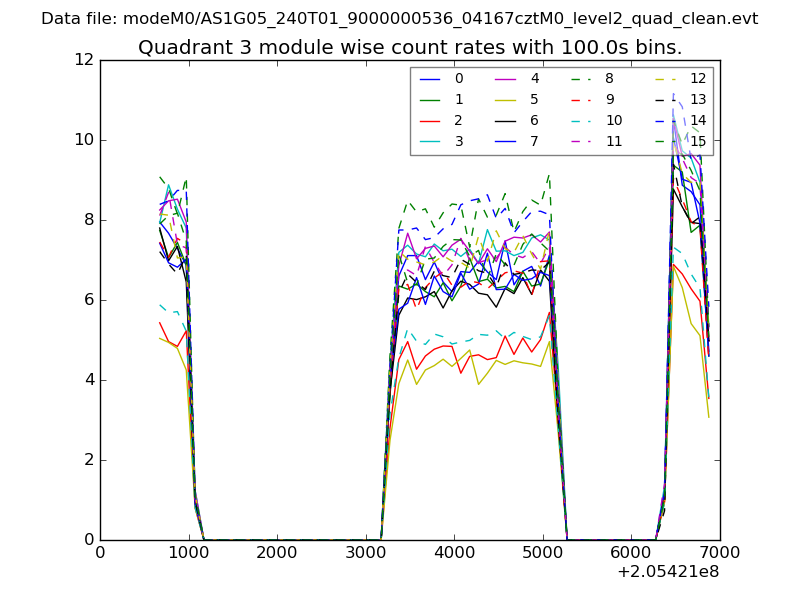
| Module-wise count rates for Quadrant C Data is divided into 100 sec bins |
 |
 |
| Module-wise count rates for Quadrant D Data is divided into 100 sec bins |
 |
 |
| Parameter | Plot |
|---|---|
| CZT HV Monitor | 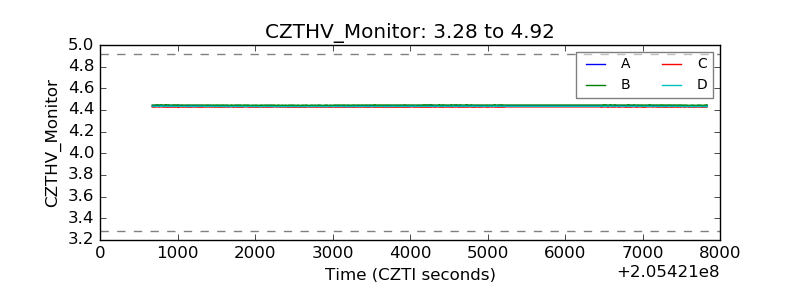 |
| D_VDD | 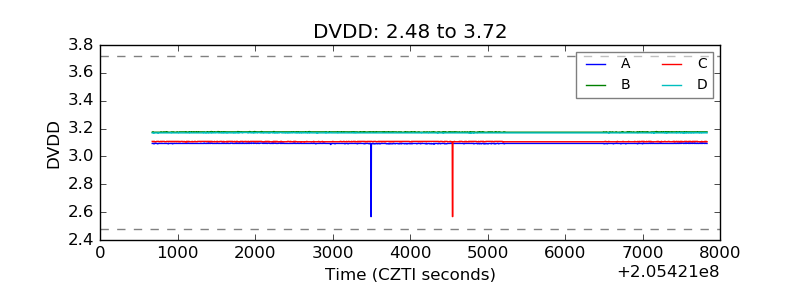 |
| Temperature 1 | 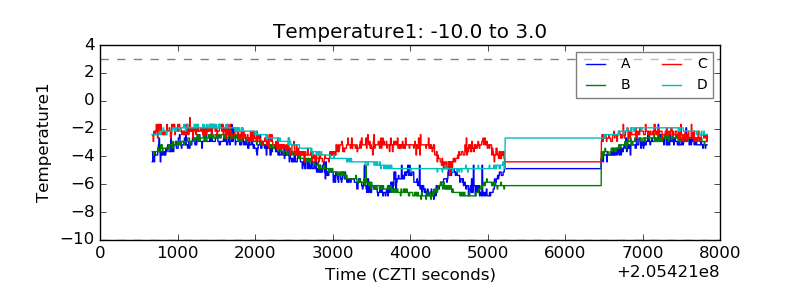 |
| Veto HV Monitor | 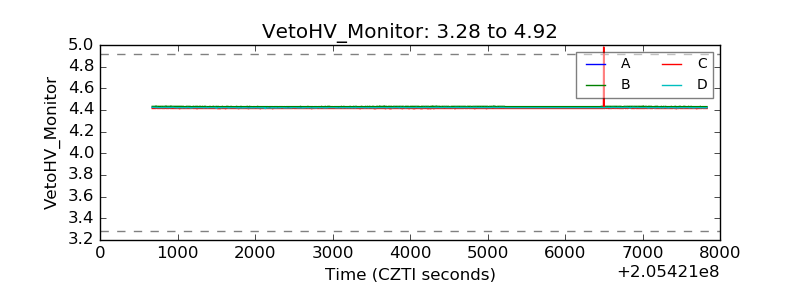 |
| Veto LLD | 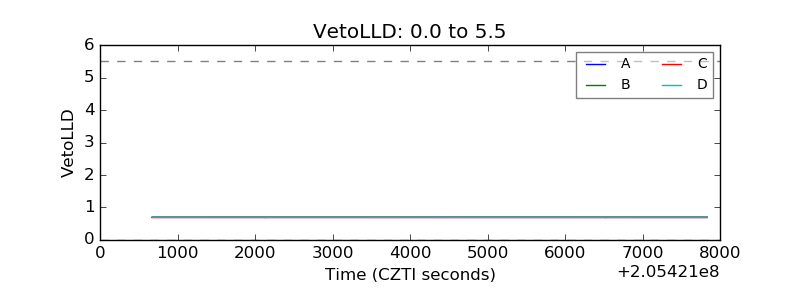 |
| Alpha Counter | 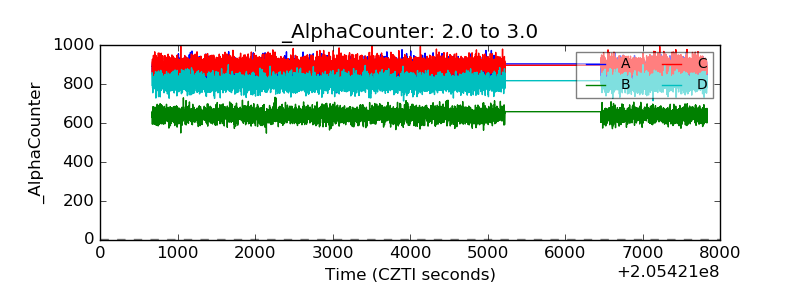 |
| _CPM_Rate | 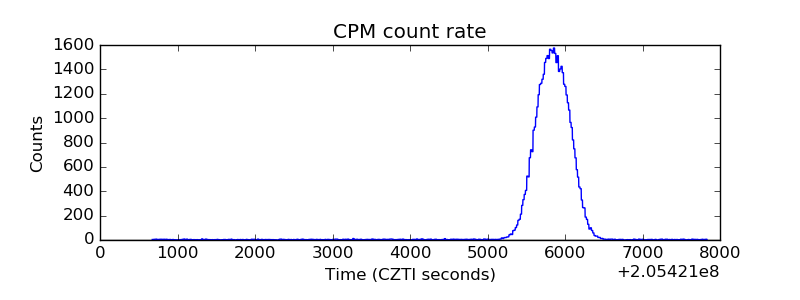 |
| CZT Counter | 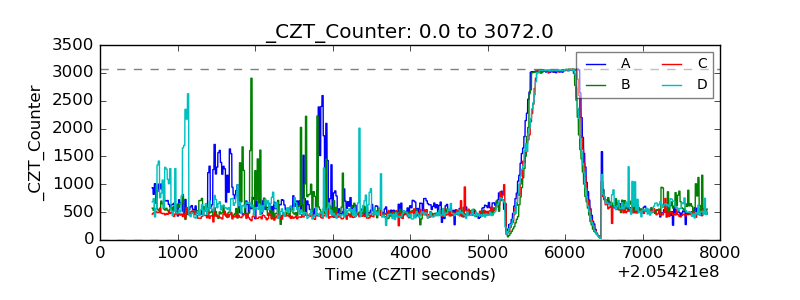 |
| +2.5 Volts monitor | 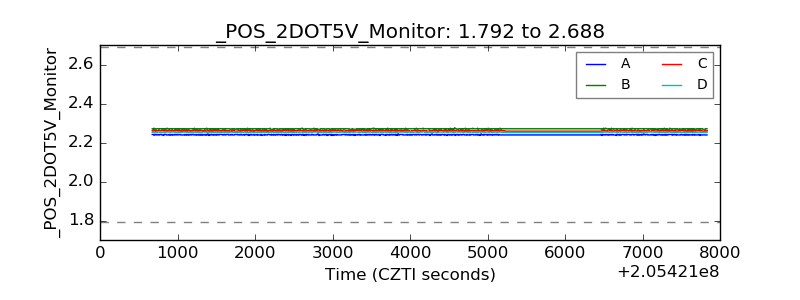 |
| +5 Volts monitor |  |
| _ROLL_ROT | 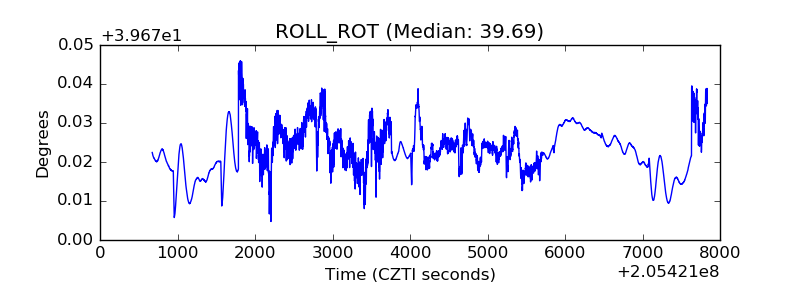 |
| _Roll_DEC | 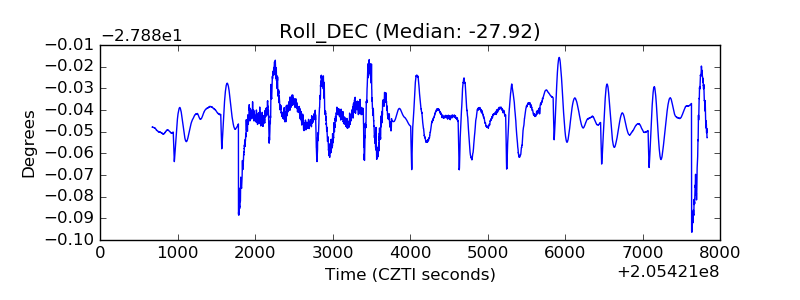 |
| _Roll_RA | 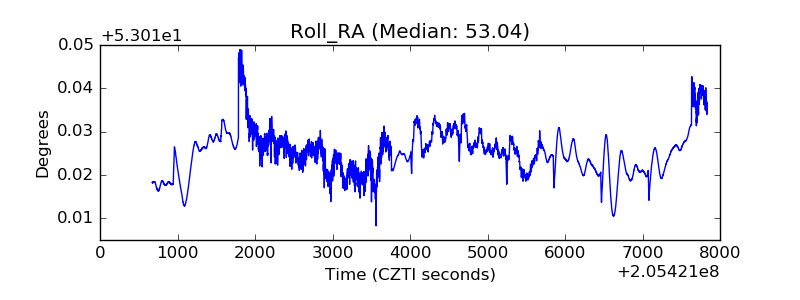 |
| Veto Counter | 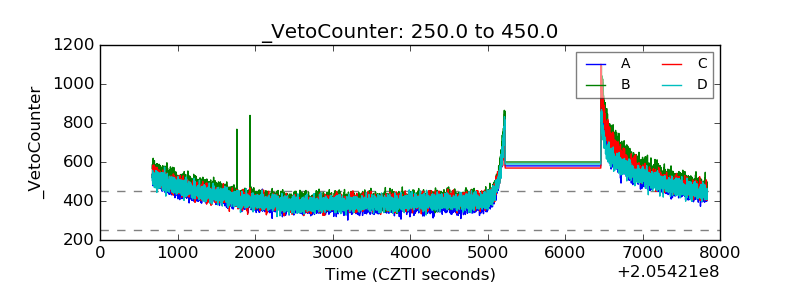 |