| Param | Original file | Final file |
|---|---|---|
| Filename | modeM0/AS1G05_240T01_9000000536_04170cztM0_level2.evt | modeM0/AS1G05_240T01_9000000536_04170cztM0_level2_quad_clean.evt |
| Size (bytes) | 458,369,280 | 60,405,120 |
| Size | 437.1 MB | 57.6 MB |
| Events in quadrant A | 3,583,702 | 351,156 |
| Events in quadrant B | 3,598,631 | 351,982 |
| Events in quadrant C | 3,014,638 | 342,773 |
| Events in quadrant D | 3,245,171 | 331,511 |
| Mode SS | |||
|---|---|---|---|
| Quadrant | BADHDUFLAG | Total packets | Discarded packets |
| A | 0 | 130 | 0 |
| B | 0 | 130 | 0 |
| C | 0 | 130 | 0 |
| D | 0 | 130 | 0 |
| Mode M9 | |||
|---|---|---|---|
| Quadrant | BADHDUFLAG | Total packets | Discarded packets |
| A | 0 | 15 | 0 |
| B | 0 | 15 | 0 |
| C | 0 | 15 | 0 |
| D | 0 | 16 | 0 |
| Mode M0 | |||
|---|---|---|---|
| Quadrant | BADHDUFLAG | Total packets | Discarded packets |
| A | 0 | 14724 | 3 |
| B | 0 | 15004 | 2 |
| C | 0 | 13296 | 2 |
| D | 0 | 13997 | 2 |
| Quadrant | Total seconds | Saturated seconds | Saturation percentage |
|---|---|---|---|
| A | 6474 | 143 | 2.208835% |
| B | 6474 | 95 | 1.467408% |
| C | 6474 | 26 | 0.401606% |
| D | 6474 | 25 | 0.386160% |
Noise dominated data is calculated using 1-second bins in cleaned event files. If a bin has >2000 counts, and if more than 50% of those come from <1% of pixels, then it is considered to be noise-dominated and hence unusable.
| Quadrant | # 1 sec bins | Bins with >0 counts | Bins with >2000 counts | High rate bins dominated by noise | Noise dominated (total time) | Noise dominated (detector-on time) | Marked lightcurve |
|---|---|---|---|---|---|---|---|
| A | 7629 | 6475 | 39 | 39 | 0.51% | 0.60% | 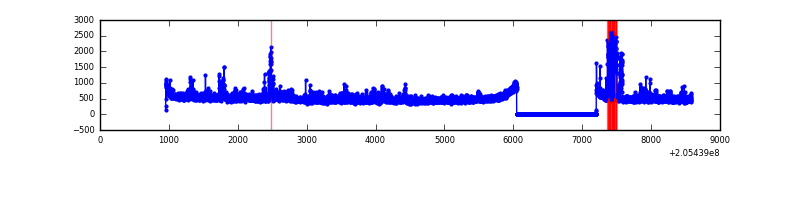 |
| B | 7629 | 6475 | 9 | 9 | 0.12% | 0.14% | 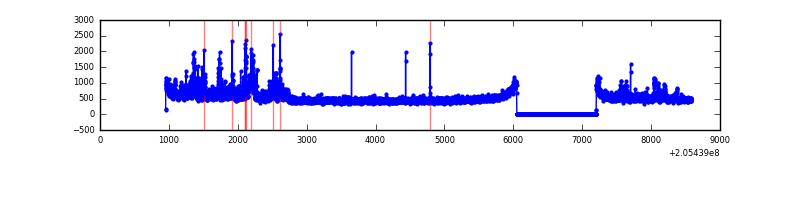 |
| C | 7629 | 6475 | 0 | 0 | 0.00% | 0.00% | 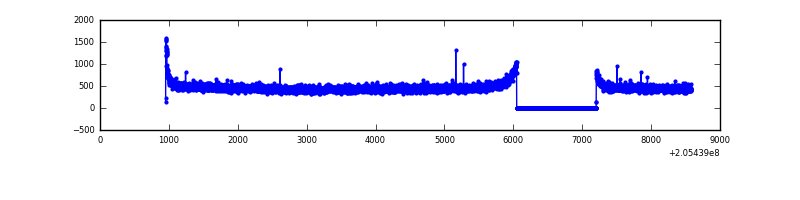 |
| D | 7629 | 6475 | 0 | 0 | 0.00% | 0.00% | 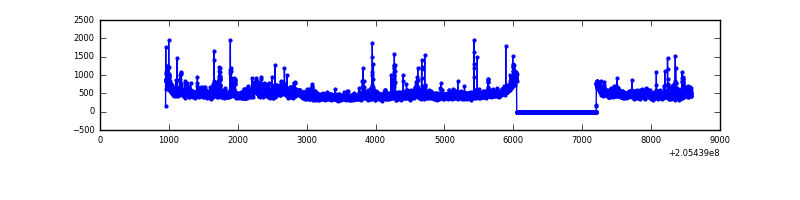 |
Top three noisy pixels from each quadrant. If the there are fewer than three noisy pixels in the level2.evt file, extra rows are filled as -1
| Pixel properties | Quadrant properties | ||||||
|---|---|---|---|---|---|---|---|
| Quadrant | DetID | PixID | Counts | Sigma | Mean | Median | Sigma |
| A | 3 | 1 | 254081 | 1575.39 | 792 | 775 | 160.8 |
| A | 0 | 199 | 179048 | 1108.74 | 792 | 775 | 160.8 |
| A | 15 | 234 | 77142 | 474.95 | 792 | 775 | 160.8 |
| B | 14 | 167 | 142214 | 919.93 | 801 | 783 | 153.7 |
| B | 4 | 81 | 119137 | 769.82 | 801 | 783 | 153.7 |
| B | 8 | 3 | 90107 | 581.0 | 801 | 783 | 153.7 |
| C | 9 | 144 | 18805 | 100.98 | 765 | 771 | 178.6 |
| C | 13 | 61 | 6425 | 31.66 | 765 | 771 | 178.6 |
| C | 10 | 65 | 3594 | 15.81 | 765 | 771 | 178.6 |
| D | 2 | 232 | 221994 | 1192.56 | 763 | 740 | 185.5 |
| D | 2 | 14 | 29162 | 153.19 | 763 | 740 | 185.5 |
| D | 12 | 233 | 25985 | 136.07 | 763 | 740 | 185.5 |
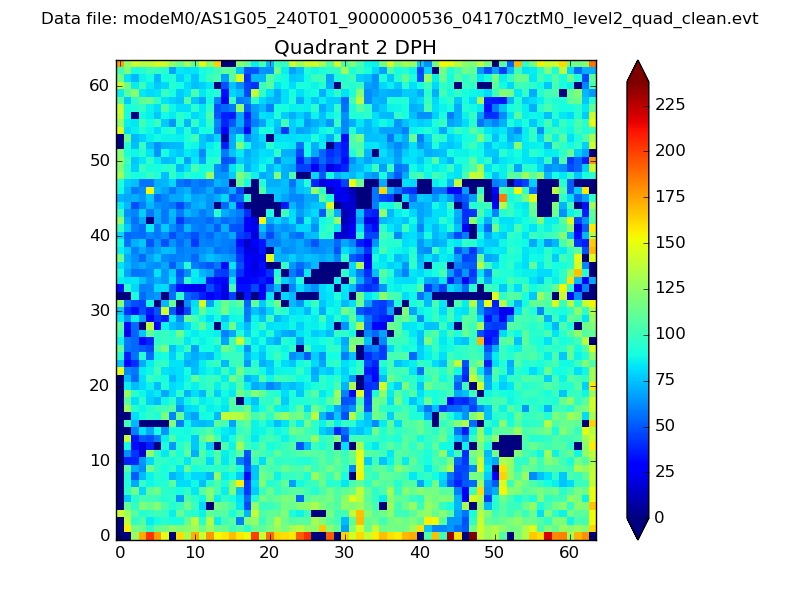
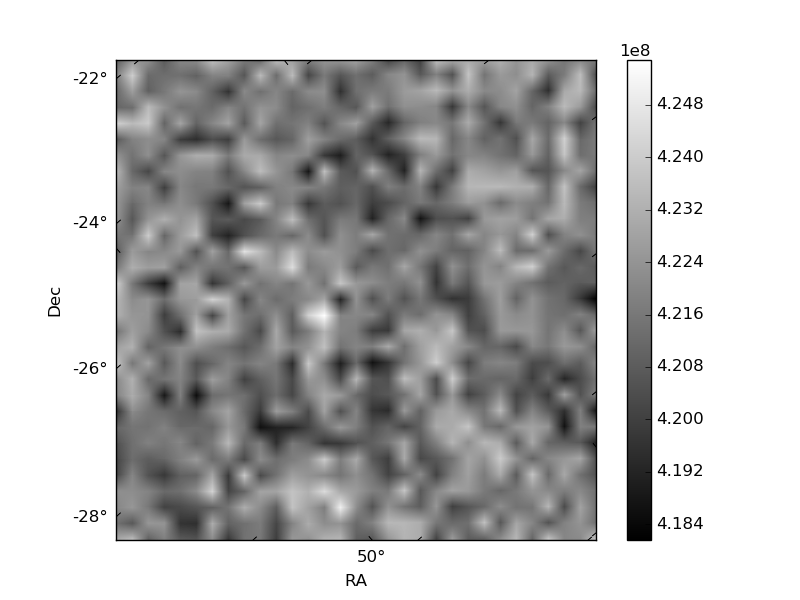
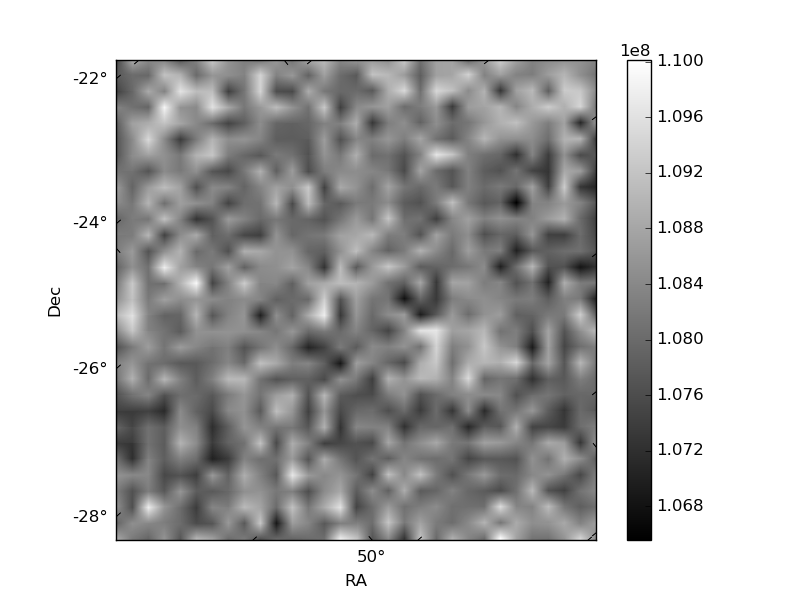
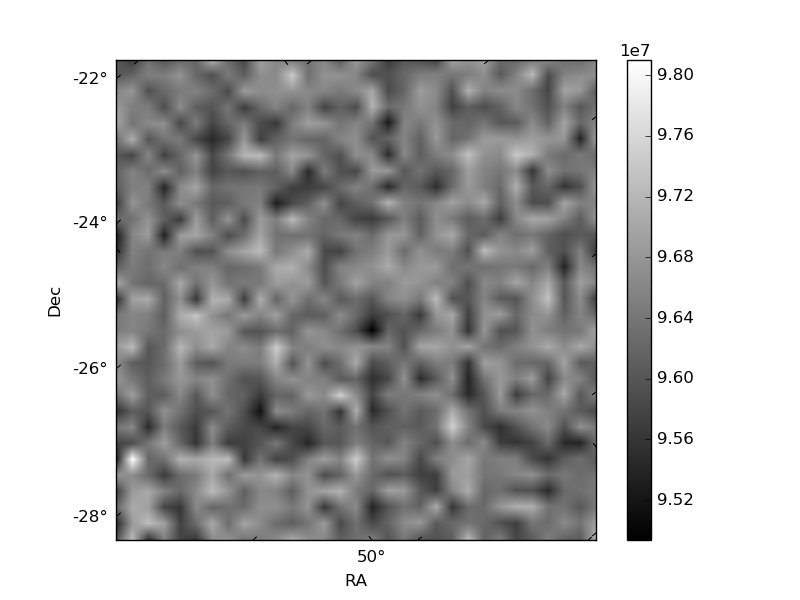
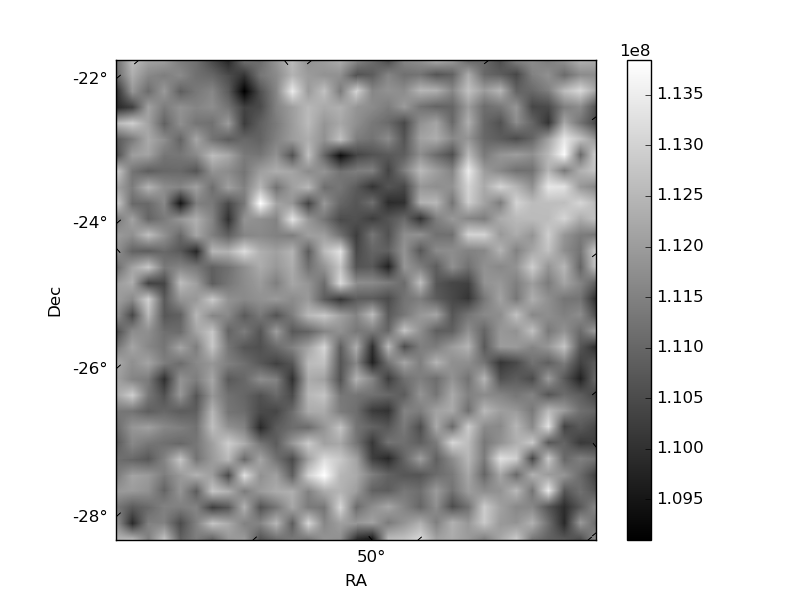
Histogram calculated using DETX and DETY for each event in the final _common_clean file
| Quadrant A | 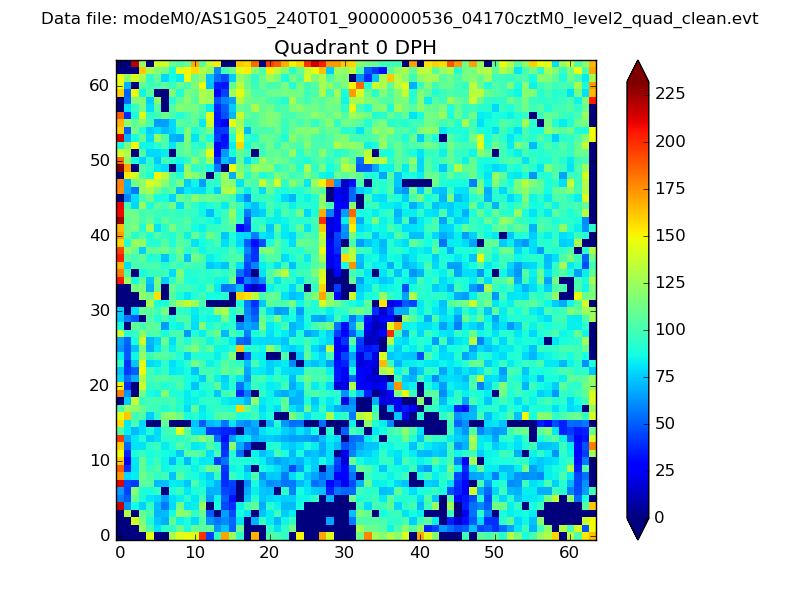 |
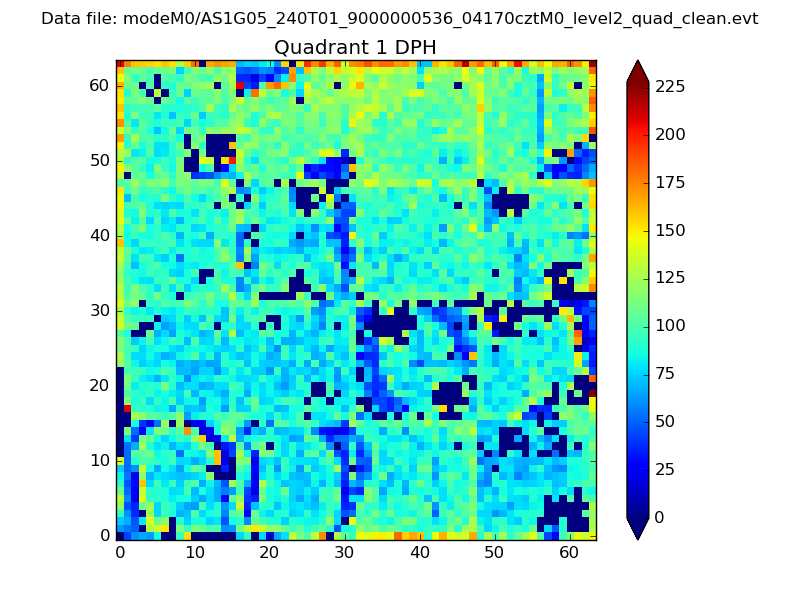 |
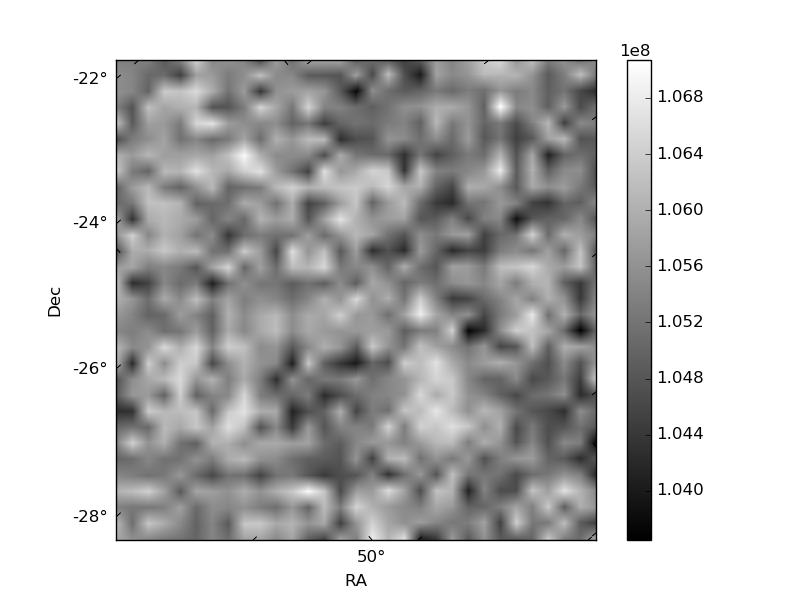
Quadrant B |
|---|---|---|---|
| Quadrant D | 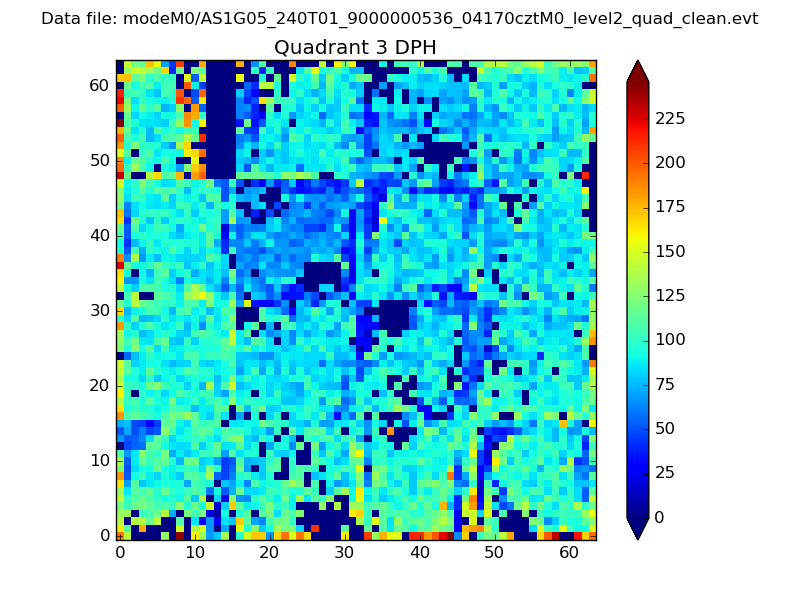 |
 |
Quadrant C |
| Plot type | Count rate plots | Images |
|---|---|---|
| Comparison with Poisson distribution Blue bars denote a histogram of data divided into 1 sec bins. Red curve is a Poisson curve with rate = median count rate of data. |
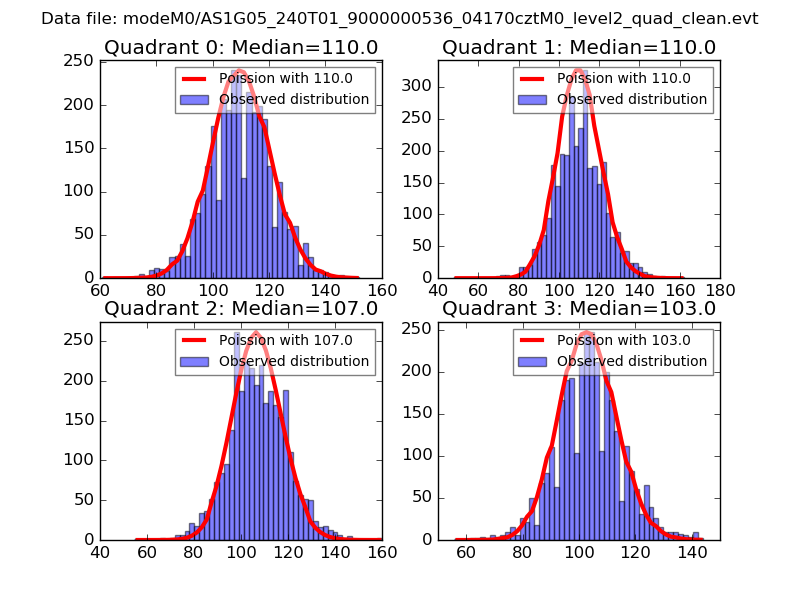 |
 |
| Quadrant-wise count rates Data is divided into 100 sec bins |
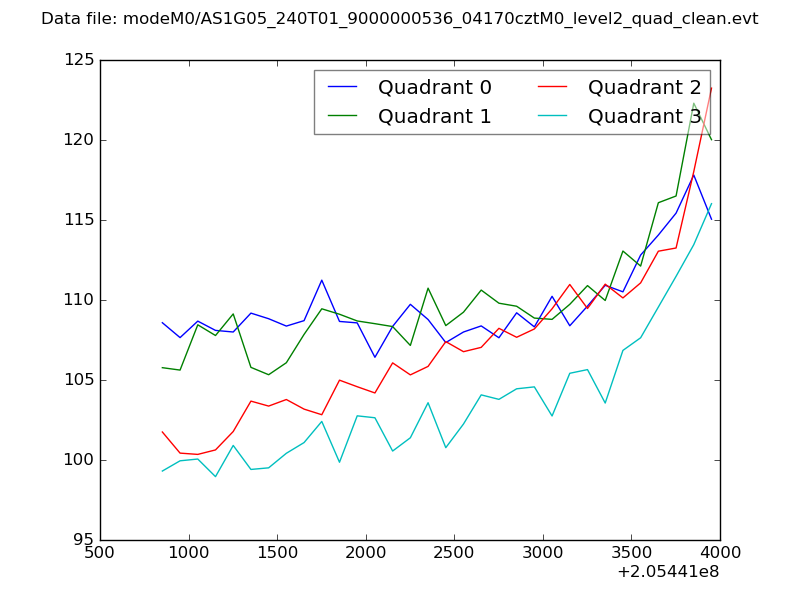 |
|
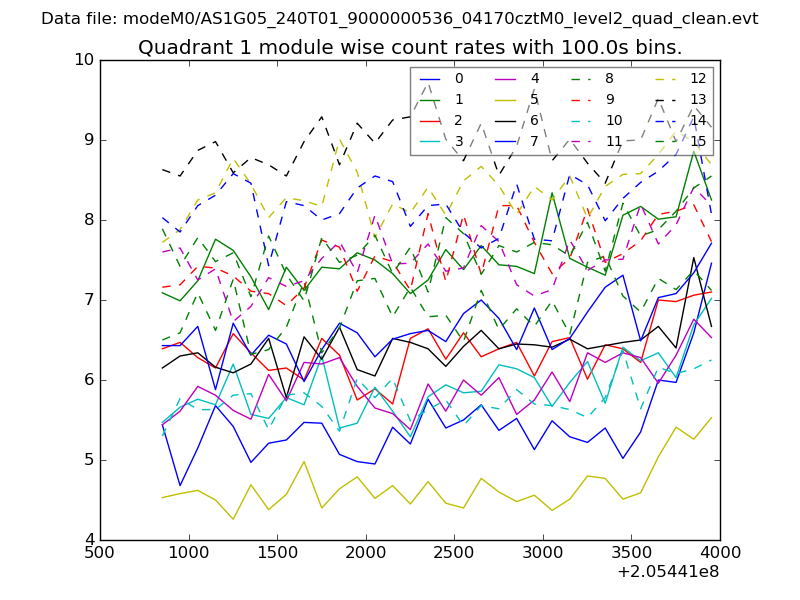
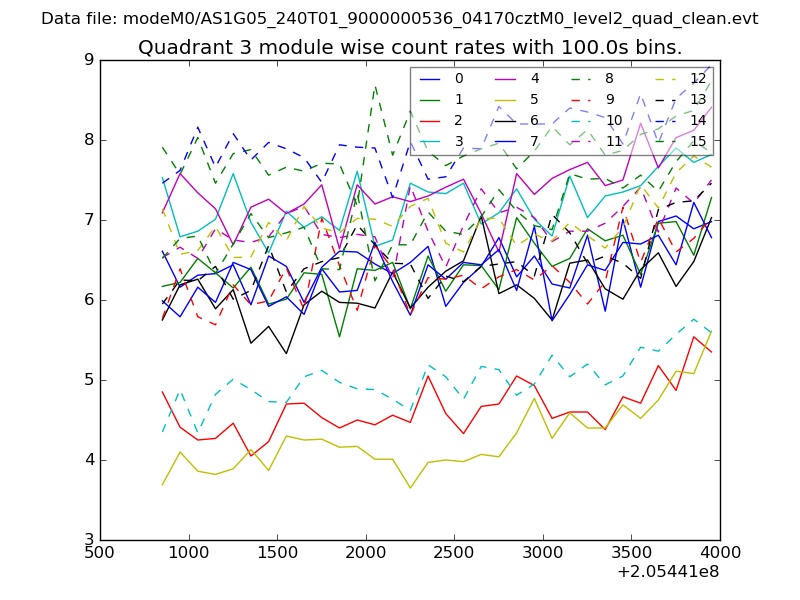
| Module-wise count rates for Quadrant A Data is divided into 100 sec bins |
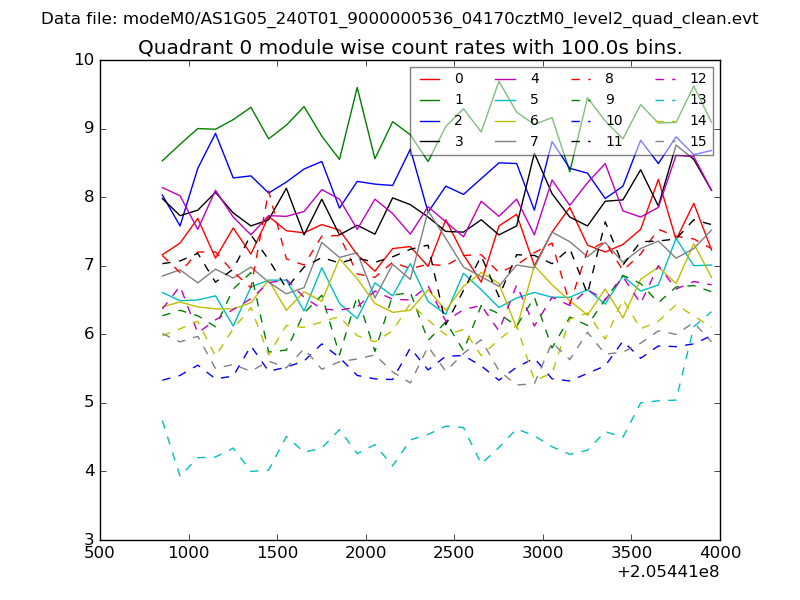 |
 |
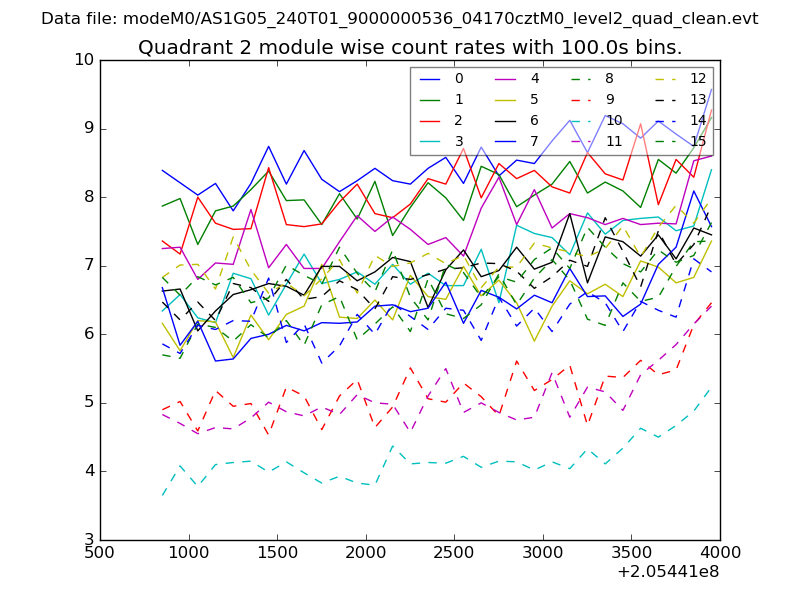
| Module-wise count rates for Quadrant B Data is divided into 100 sec bins |
 |
 |
| Module-wise count rates for Quadrant C Data is divided into 100 sec bins |
 |
 |
| Module-wise count rates for Quadrant D Data is divided into 100 sec bins |
 |
 |
| Parameter | Plot |
|---|---|
| CZT HV Monitor | 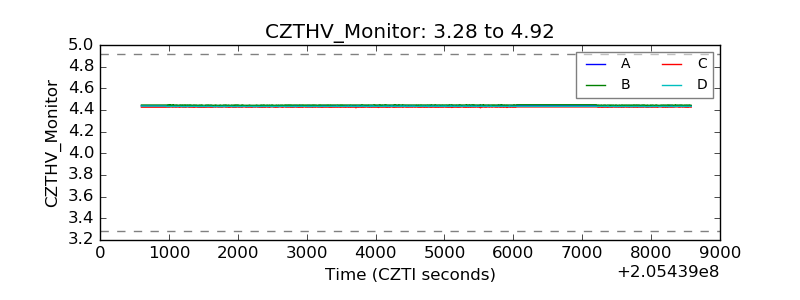 |
| D_VDD | 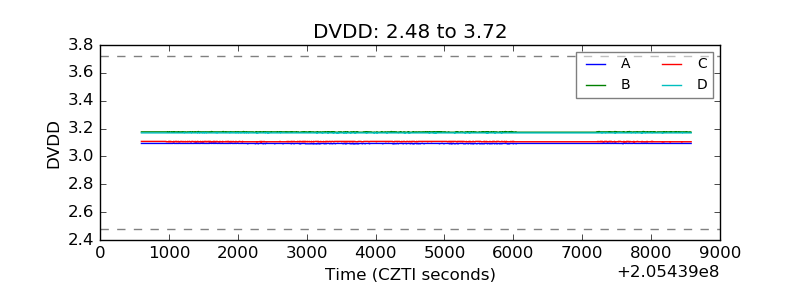 |
| Temperature 1 | 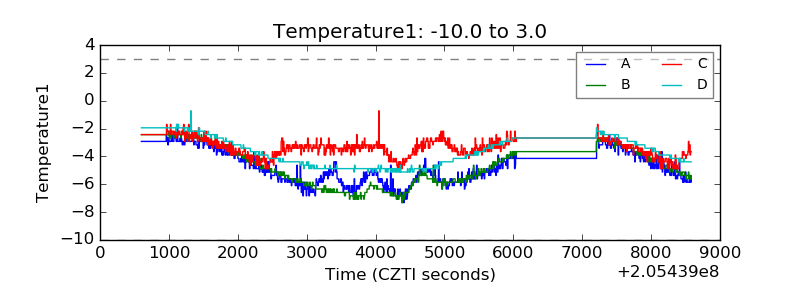 |
| Veto HV Monitor | 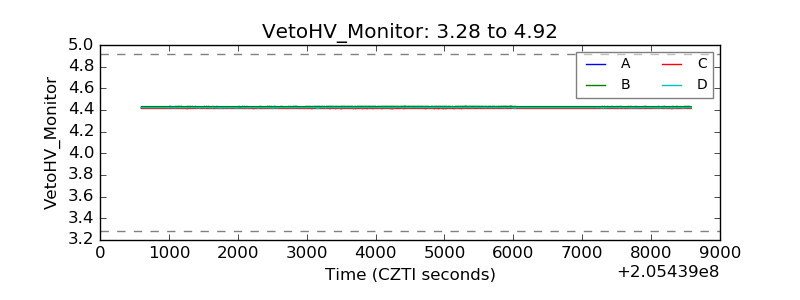 |
| Veto LLD | 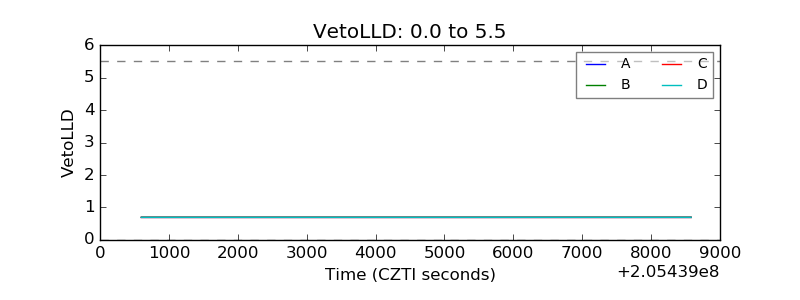 |
| Alpha Counter | 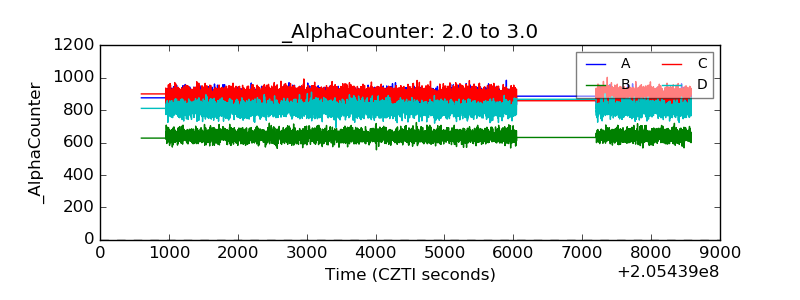 |
| _CPM_Rate | 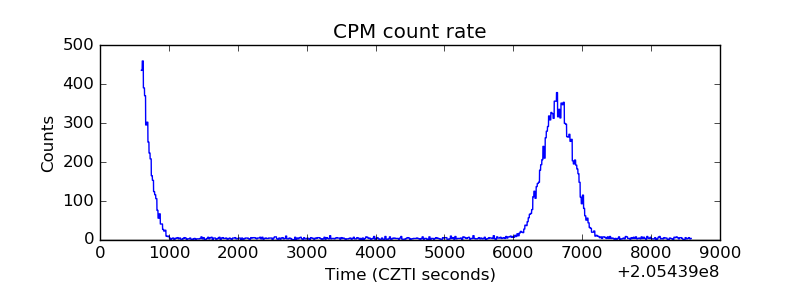 |
| CZT Counter | 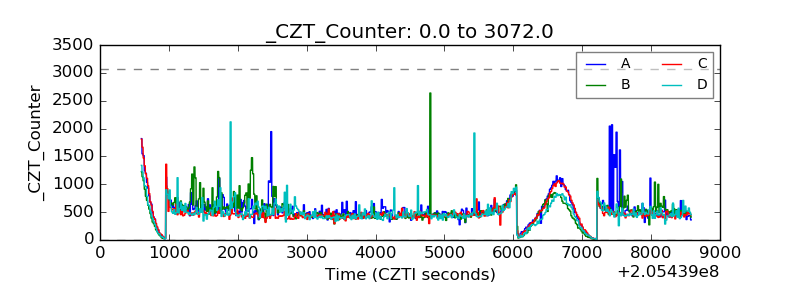 |
| +2.5 Volts monitor | 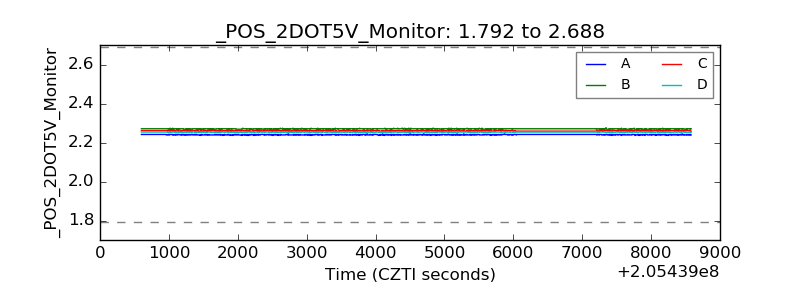 |
| +5 Volts monitor |  |
| _ROLL_ROT | 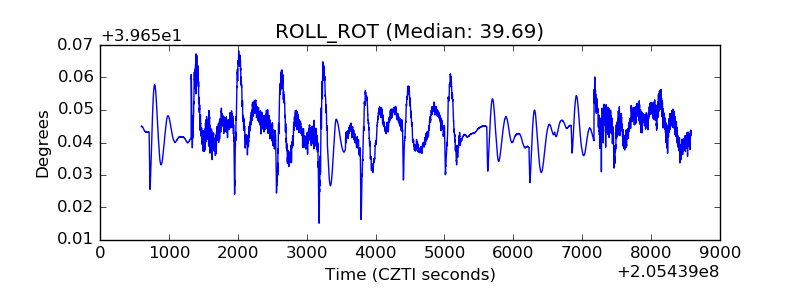 |
| _Roll_DEC | 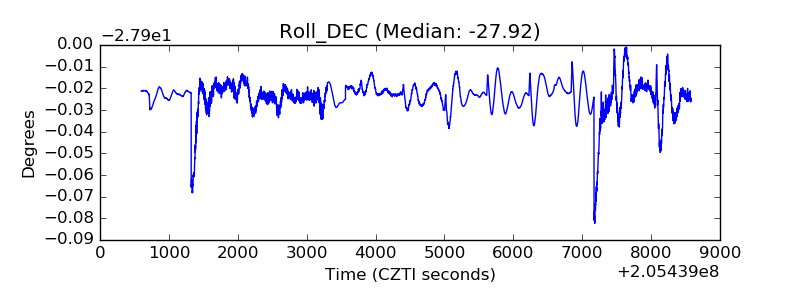 |
| _Roll_RA | 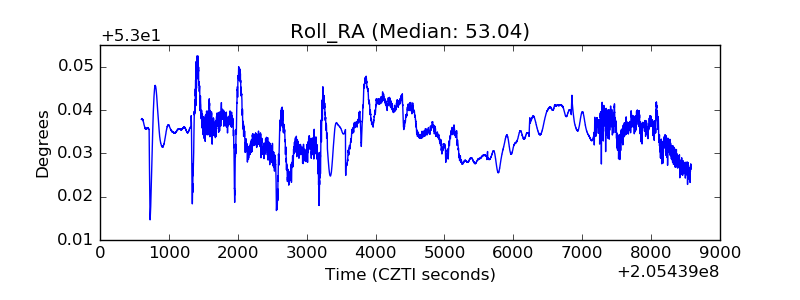 |
| Veto Counter | 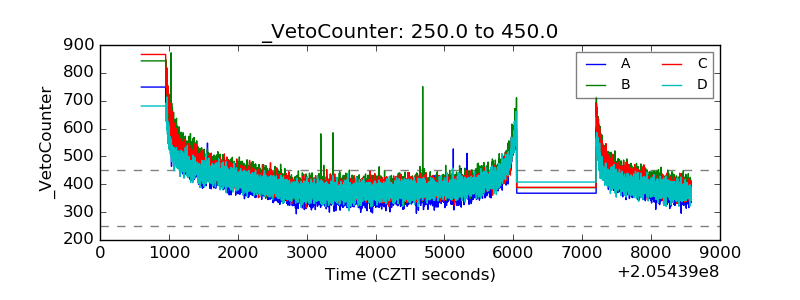 |