| Param | Original file | Final file |
|---|---|---|
| Filename | modeM0/AS1G05_240T01_9000000536_04171cztM0_level2.evt | modeM0/AS1G05_240T01_9000000536_04171cztM0_level2_quad_clean.evt |
| Size (bytes) | 496,558,080 | 69,287,040 |
| Size | 473.6 MB | 66.1 MB |
| Events in quadrant A | 4,417,259 | 402,396 |
| Events in quadrant B | 3,536,660 | 416,431 |
| Events in quadrant C | 3,092,600 | 405,957 |
| Events in quadrant D | 3,523,108 | 392,230 |
| Mode SS | |||
|---|---|---|---|
| Quadrant | BADHDUFLAG | Total packets | Discarded packets |
| A | 0 | 140 | 0 |
| B | 0 | 140 | 0 |
| C | 0 | 140 | 0 |
| D | 0 | 140 | 0 |
| Mode M9 | |||
|---|---|---|---|
| Quadrant | BADHDUFLAG | Total packets | Discarded packets |
| A | 0 | 9 | 0 |
| B | 0 | 9 | 0 |
| C | 0 | 9 | 0 |
| D | 0 | 10 | 0 |
| Mode M0 | |||
|---|---|---|---|
| Quadrant | BADHDUFLAG | Total packets | Discarded packets |
| A | 0 | 17609 | 3 |
| B | 0 | 14973 | 2 |
| C | 0 | 14042 | 2 |
| D | 0 | 15148 | 2 |
| Quadrant | Total seconds | Saturated seconds | Saturation percentage |
|---|---|---|---|
| A | 6900 | 424 | 6.144928% |
| B | 6900 | 79 | 1.144928% |
| C | 6900 | 30 | 0.434783% |
| D | 6900 | 82 | 1.188406% |
Noise dominated data is calculated using 1-second bins in cleaned event files. If a bin has >2000 counts, and if more than 50% of those come from <1% of pixels, then it is considered to be noise-dominated and hence unusable.
| Quadrant | # 1 sec bins | Bins with >0 counts | Bins with >2000 counts | High rate bins dominated by noise | Noise dominated (total time) | Noise dominated (detector-on time) | Marked lightcurve |
|---|---|---|---|---|---|---|---|
| A | 7710 | 6901 | 346 | 346 | 4.49% | 5.01% |  |
| B | 7710 | 6901 | 6 | 6 | 0.08% | 0.09% |  |
| C | 7710 | 6901 | 0 | 0 | 0.00% | 0.00% | 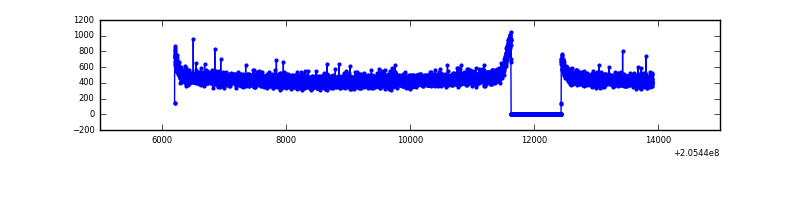 |
| D | 7710 | 6901 | 47 | 47 | 0.61% | 0.68% |  |
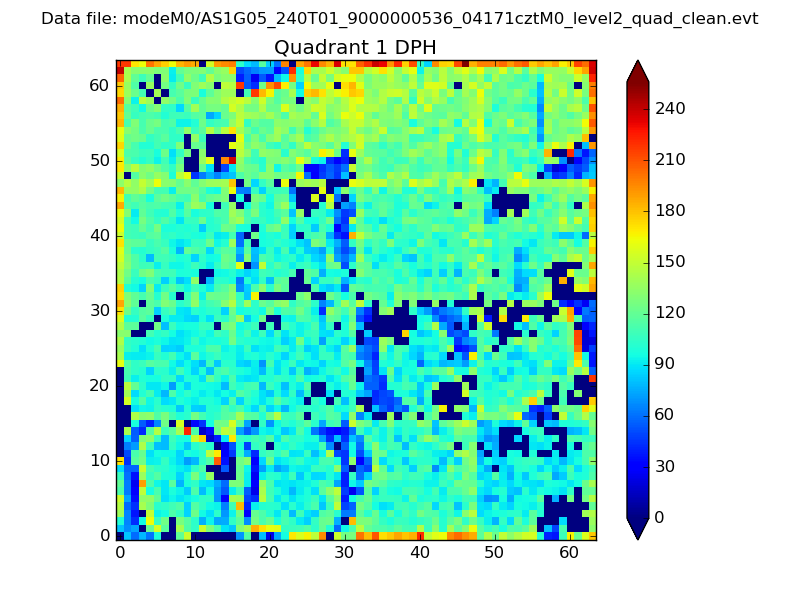
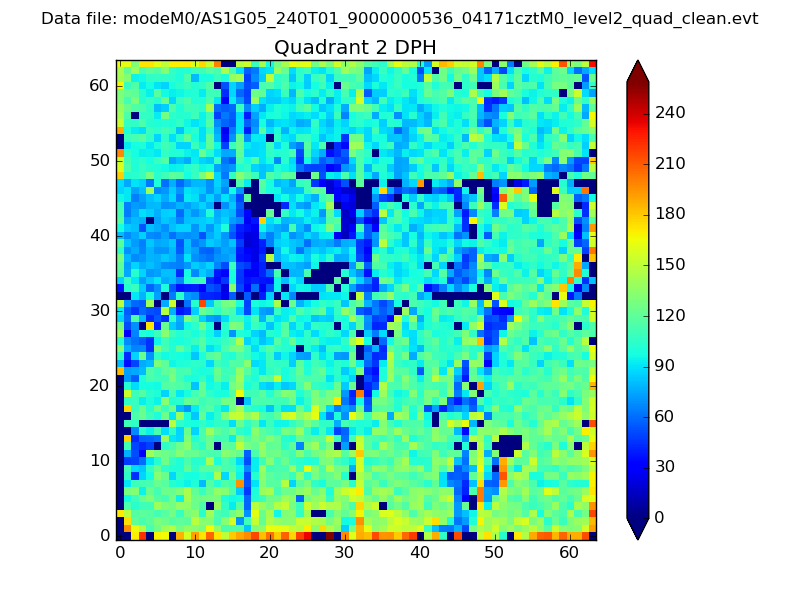
Top three noisy pixels from each quadrant. If the there are fewer than three noisy pixels in the level2.evt file, extra rows are filled as -1
| Pixel properties | Quadrant properties | ||||||
|---|---|---|---|---|---|---|---|
| Quadrant | DetID | PixID | Counts | Sigma | Mean | Median | Sigma |
| A | 15 | 234 | 990649 | 6056.88 | 802 | 787 | 163.4 |
| A | 0 | 199 | 164463 | 1001.52 | 802 | 787 | 163.4 |
| A | 3 | 1 | 132335 | 804.93 | 802 | 787 | 163.4 |
| B | 15 | 204 | 101726 | 628.2 | 824 | 805 | 160.6 |
| B | 14 | 167 | 58303 | 357.91 | 824 | 805 | 160.6 |
| B | 7 | 252 | 56732 | 348.13 | 824 | 805 | 160.6 |
| C | 13 | 61 | 6475 | 30.74 | 789 | 793 | 184.8 |
| C | 10 | 65 | 4357 | 19.28 | 789 | 793 | 184.8 |
| C | 12 | 4 | 3405 | 14.13 | 789 | 793 | 184.8 |
| D | 2 | 232 | 161790 | 832.79 | 786 | 763 | 193.4 |
| D | 13 | 239 | 105726 | 542.84 | 786 | 763 | 193.4 |
| D | 13 | 61 | 90136 | 462.22 | 786 | 763 | 193.4 |
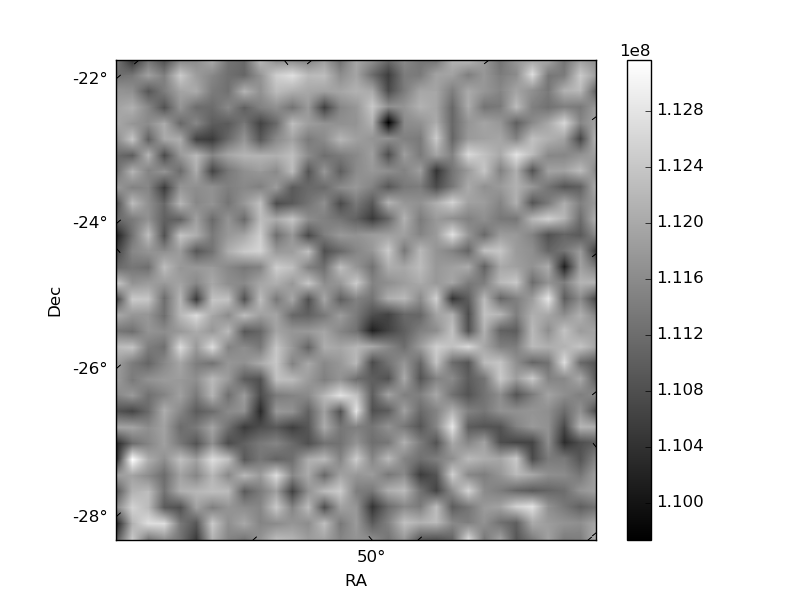
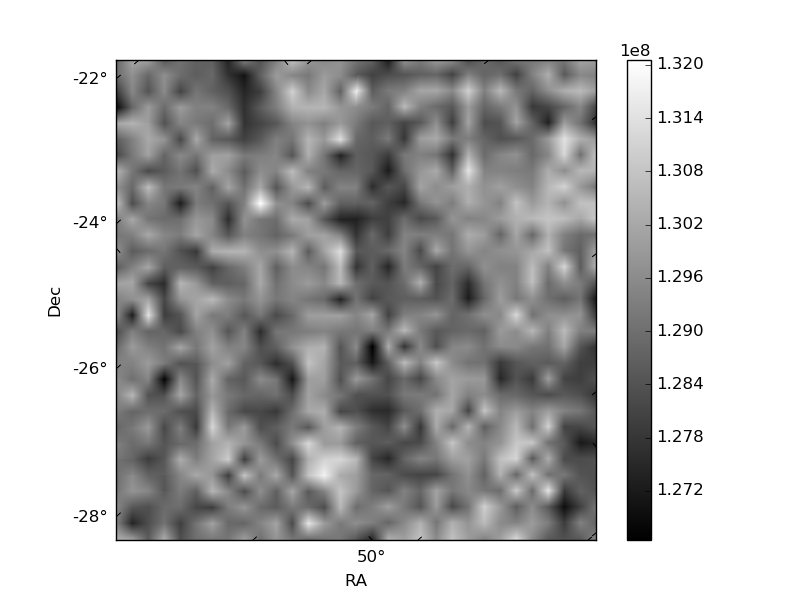
Histogram calculated using DETX and DETY for each event in the final _common_clean file
| Quadrant A | 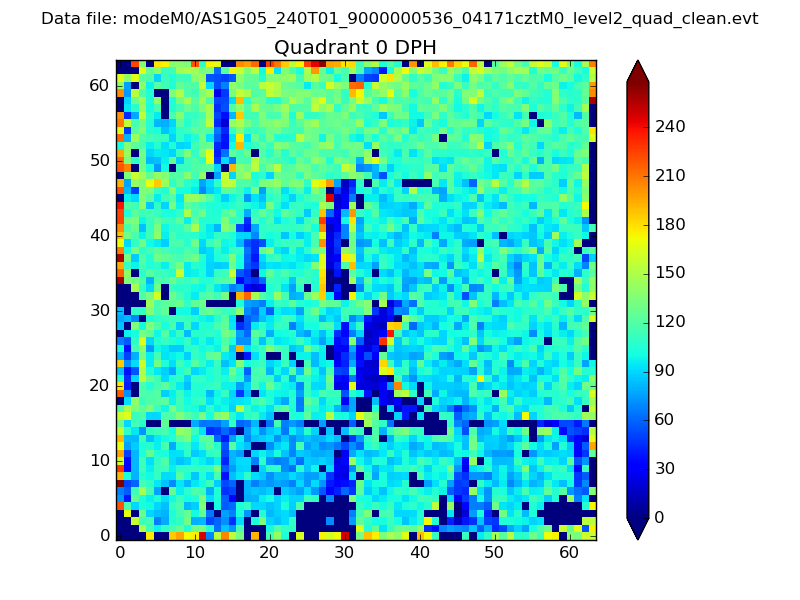 |
 |
Quadrant B |
|---|---|---|---|
| Quadrant D |  |
 |
Quadrant C |
| Plot type | Count rate plots | Images |
|---|---|---|
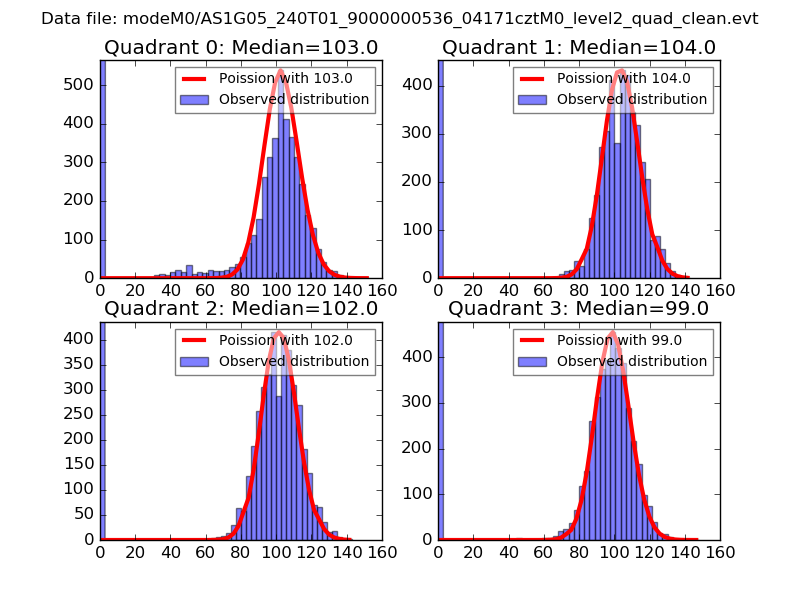
| Comparison with Poisson distribution Blue bars denote a histogram of data divided into 1 sec bins. Red curve is a Poisson curve with rate = median count rate of data. |
 |
 |
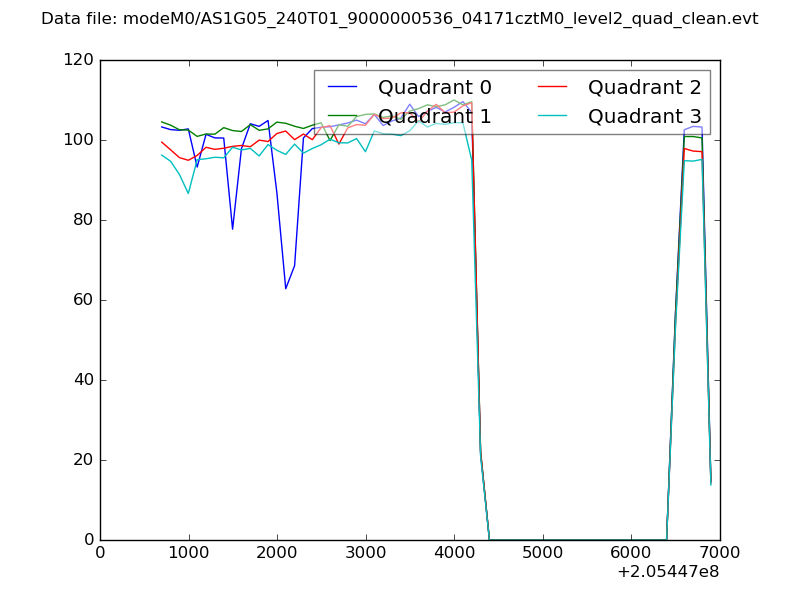
| Quadrant-wise count rates Data is divided into 100 sec bins |
 |
|
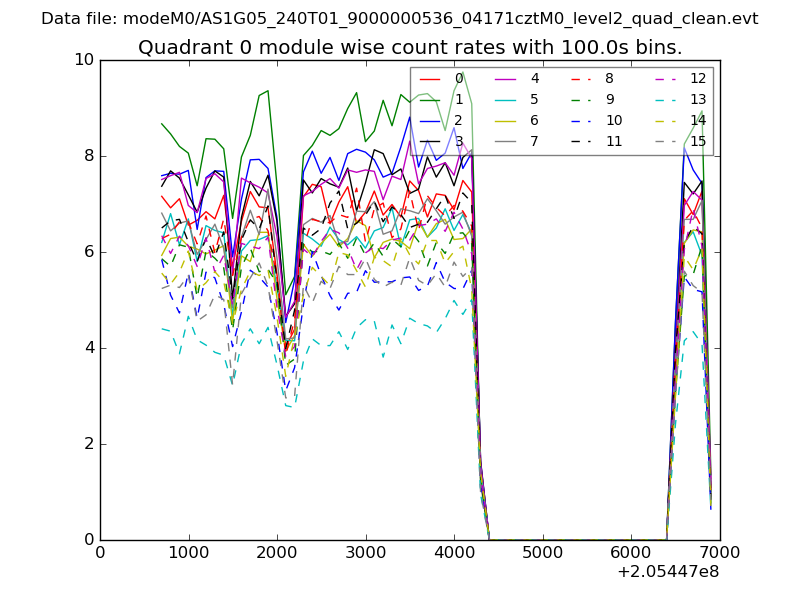
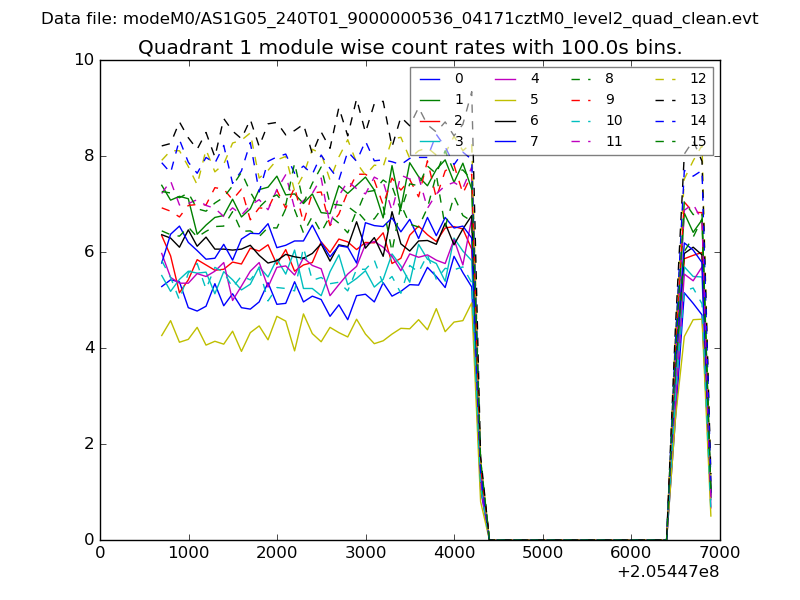
| Module-wise count rates for Quadrant A Data is divided into 100 sec bins |
 |
 |
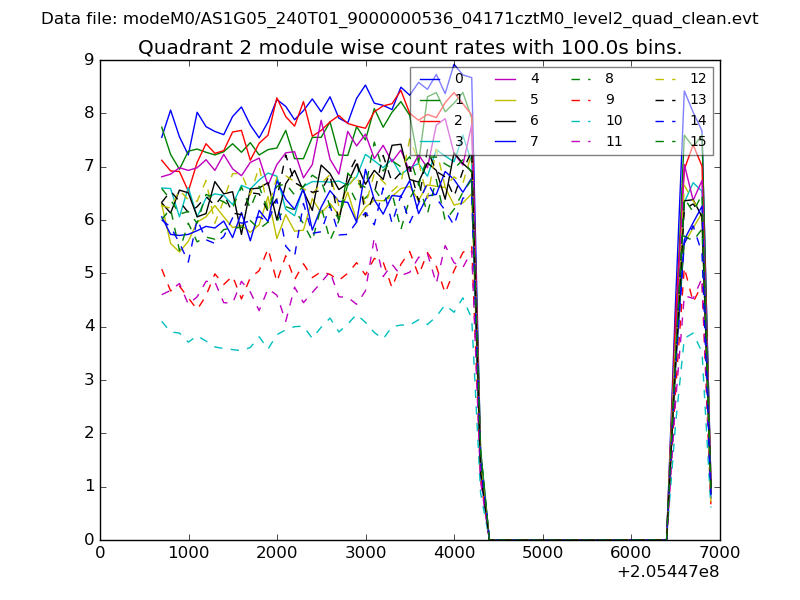
| Module-wise count rates for Quadrant B Data is divided into 100 sec bins |
 |
 |
| Module-wise count rates for Quadrant C Data is divided into 100 sec bins |
 |
 |
| Module-wise count rates for Quadrant D Data is divided into 100 sec bins |
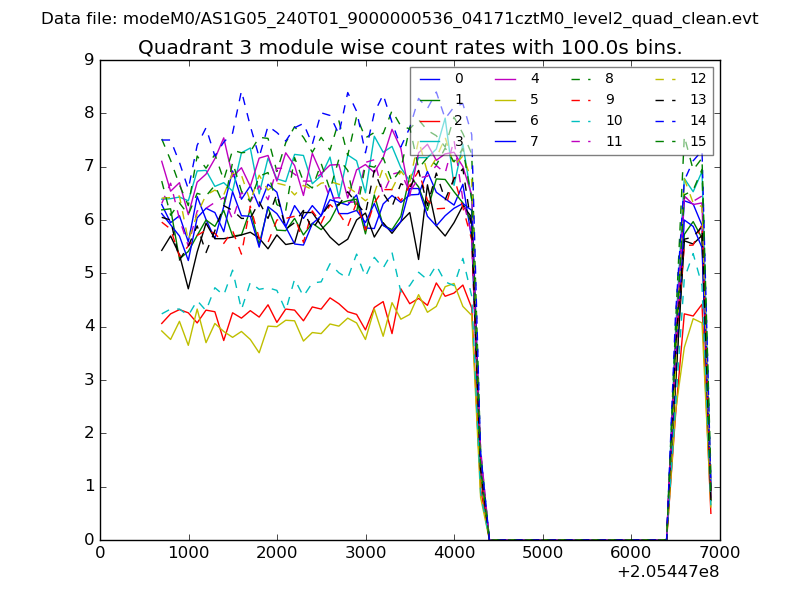 |
 |
| Parameter | Plot |
|---|---|
| CZT HV Monitor | 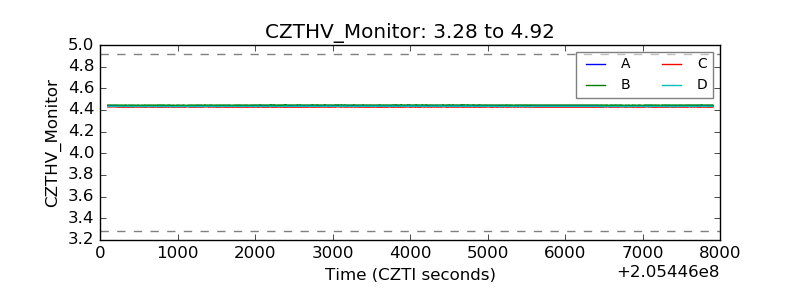 |
| D_VDD | 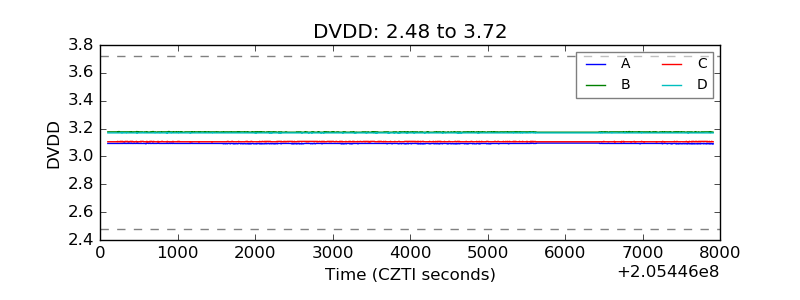 |
| Temperature 1 |  |
| Veto HV Monitor | 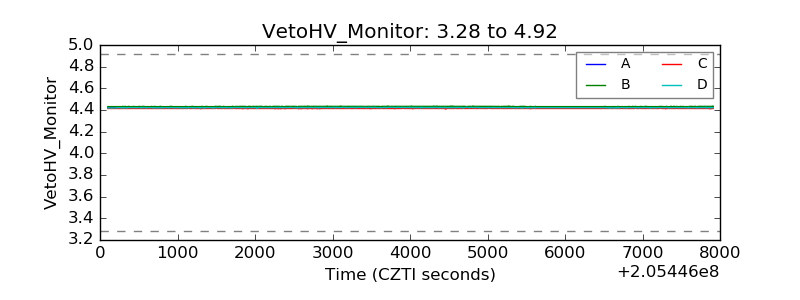 |
| Veto LLD | 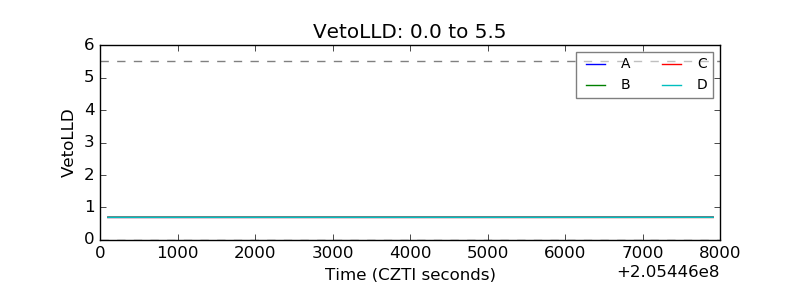 |
| Alpha Counter | 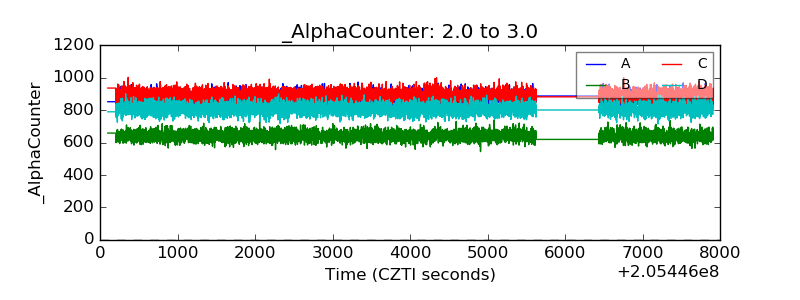 |
| _CPM_Rate | 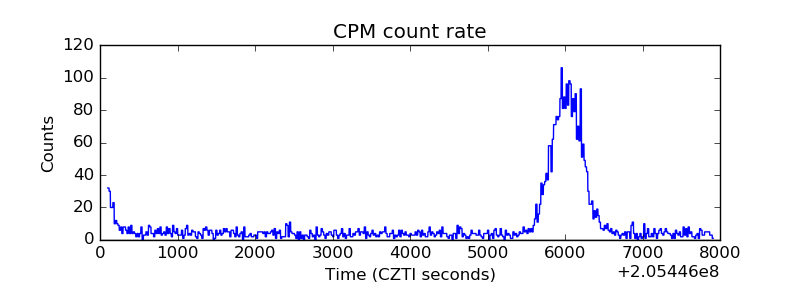 |
| CZT Counter | 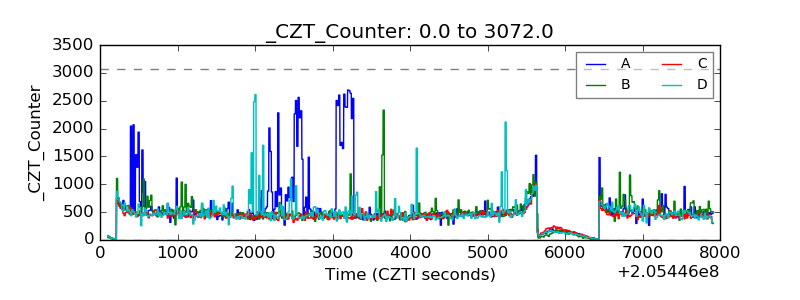 |
| +2.5 Volts monitor |  |
| +5 Volts monitor |  |
| _ROLL_ROT | 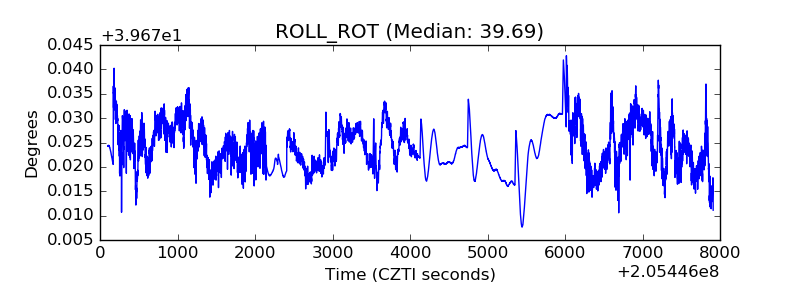 |
| _Roll_DEC | 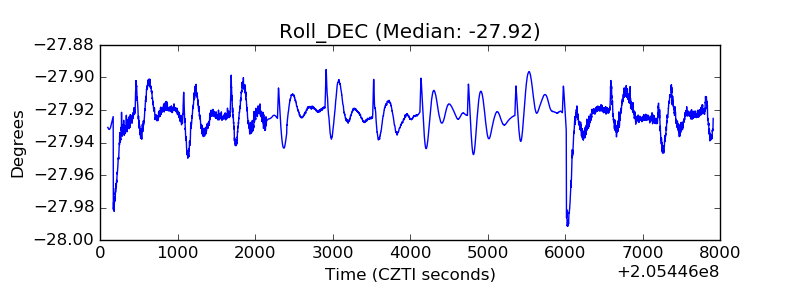 |
| _Roll_RA | 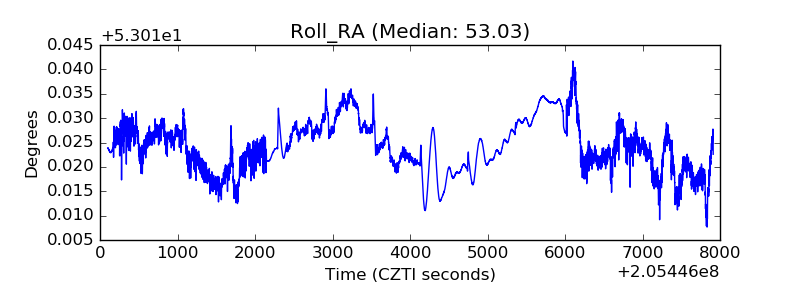 |
| Veto Counter | 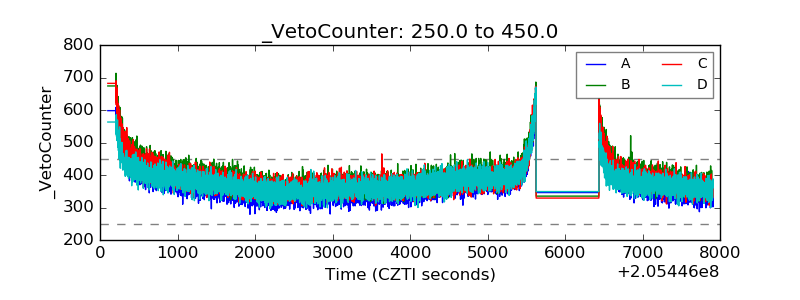 |