| Param | Original file | Final file |
|---|---|---|
| Filename | modeM0/AS1G05_240T01_9000000536_04172cztM0_level2.evt | modeM0/AS1G05_240T01_9000000536_04172cztM0_level2_quad_clean.evt |
| Size (bytes) | 483,367,680 | 74,217,600 |
| Size | 461.0 MB | 70.8 MB |
| Events in quadrant A | 3,610,271 | 443,150 |
| Events in quadrant B | 3,675,467 | 443,281 |
| Events in quadrant C | 3,249,912 | 432,909 |
| Events in quadrant D | 3,606,504 | 418,954 |
| Mode SS | |||
|---|---|---|---|
| Quadrant | BADHDUFLAG | Total packets | Discarded packets |
| A | 0 | 148 | 0 |
| B | 0 | 148 | 0 |
| C | 0 | 148 | 0 |
| D | 0 | 148 | 0 |
| Mode M9 | |||
|---|---|---|---|
| Quadrant | BADHDUFLAG | Total packets | Discarded packets |
| A | 0 | 6 | 0 |
| B | 0 | 6 | 0 |
| C | 0 | 6 | 0 |
| D | 0 | 7 | 0 |
| Mode M0 | |||
|---|---|---|---|
| Quadrant | BADHDUFLAG | Total packets | Discarded packets |
| A | 0 | 15608 | 3 |
| B | 0 | 15806 | 2 |
| C | 0 | 14871 | 2 |
| D | 0 | 16009 | 2 |
| Quadrant | Total seconds | Saturated seconds | Saturation percentage |
|---|---|---|---|
| A | 7311 | 61 | 0.834359% |
| B | 7311 | 62 | 0.848037% |
| C | 7311 | 25 | 0.341950% |
| D | 7311 | 89 | 1.217344% |
Noise dominated data is calculated using 1-second bins in cleaned event files. If a bin has >2000 counts, and if more than 50% of those come from <1% of pixels, then it is considered to be noise-dominated and hence unusable.
| Quadrant | # 1 sec bins | Bins with >0 counts | Bins with >2000 counts | High rate bins dominated by noise | Noise dominated (total time) | Noise dominated (detector-on time) | Marked lightcurve |
|---|---|---|---|---|---|---|---|
| A | 7711 | 7312 | 7 | 7 | 0.09% | 0.10% |  |
| B | 7711 | 7312 | 6 | 6 | 0.08% | 0.08% |  |
| C | 7711 | 7312 | 0 | 0 | 0.00% | 0.00% | 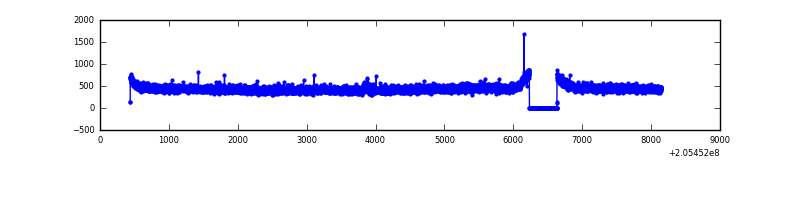 |
| D | 7711 | 7312 | 62 | 62 | 0.80% | 0.85% |  |
Top three noisy pixels from each quadrant. If the there are fewer than three noisy pixels in the level2.evt file, extra rows are filled as -1
| Pixel properties | Quadrant properties | ||||||
|---|---|---|---|---|---|---|---|
| Quadrant | DetID | PixID | Counts | Sigma | Mean | Median | Sigma |
| A | 3 | 1 | 166084 | 951.73 | 851 | 832 | 173.6 |
| A | 15 | 234 | 107436 | 613.96 | 851 | 832 | 173.6 |
| A | 0 | 50 | 25131 | 139.94 | 851 | 832 | 173.6 |
| B | 15 | 204 | 82103 | 483.87 | 862 | 840 | 167.9 |
| B | 8 | 3 | 64452 | 378.77 | 862 | 840 | 167.9 |
| B | 0 | 228 | 61608 | 361.84 | 862 | 840 | 167.9 |
| C | 8 | 128 | 6801 | 30.96 | 825 | 828 | 192.9 |
| C | 13 | 61 | 6687 | 30.37 | 825 | 828 | 192.9 |
| C | 10 | 65 | 6476 | 29.28 | 825 | 828 | 192.9 |
| D | 2 | 232 | 174959 | 865.53 | 822 | 796 | 201.2 |
| D | 13 | 239 | 171200 | 846.85 | 822 | 796 | 201.2 |
| D | 13 | 223 | 79195 | 389.62 | 822 | 796 | 201.2 |
Histogram calculated using DETX and DETY for each event in the final _common_clean file
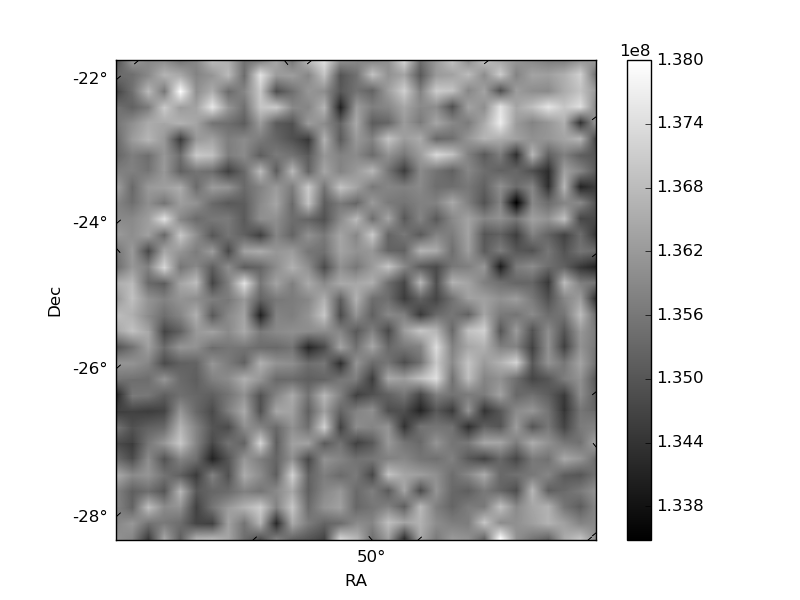
| Quadrant A | 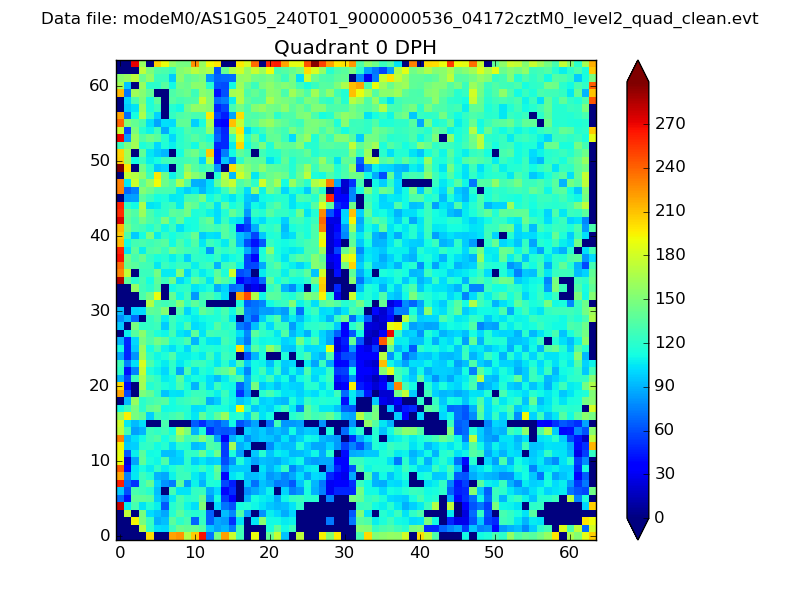 |
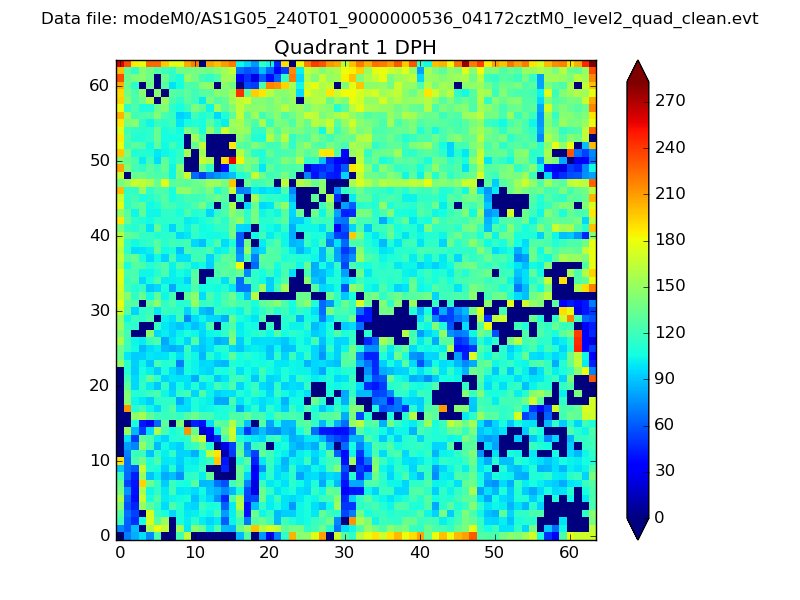 |
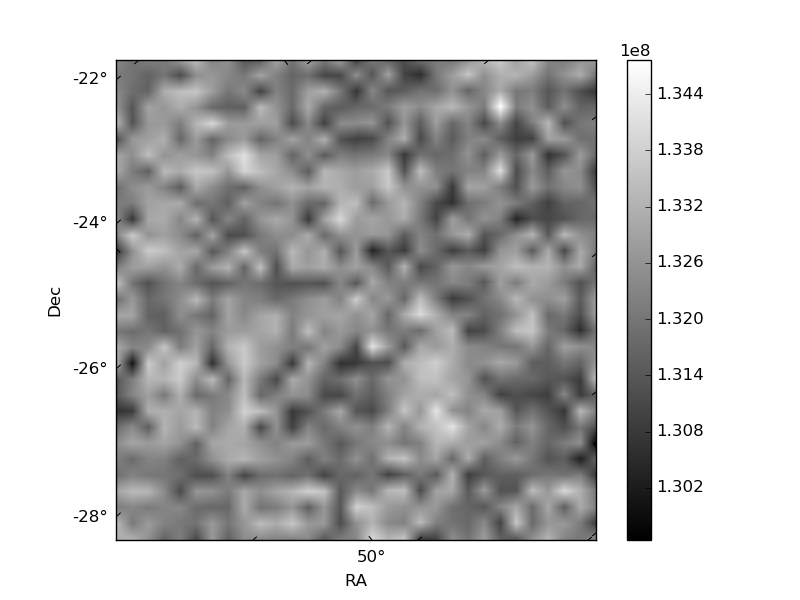
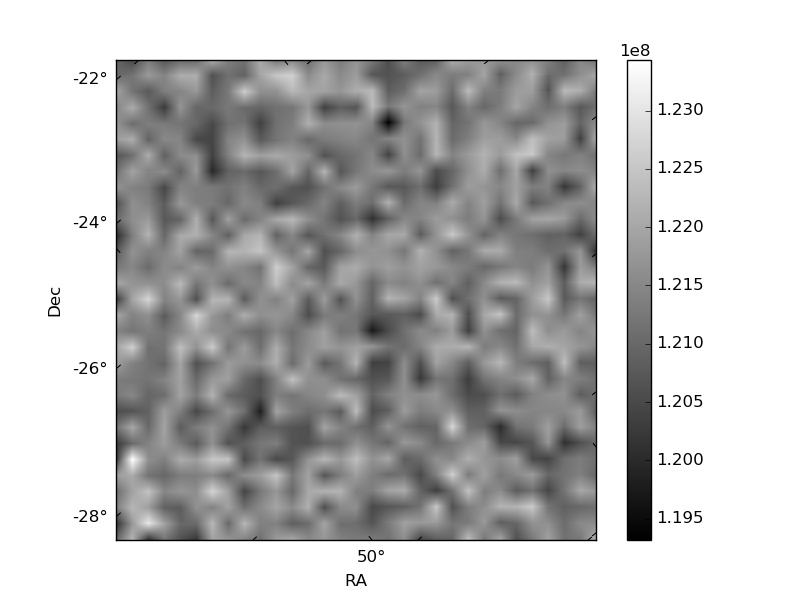
Quadrant B |
|---|---|---|---|
| Quadrant D | 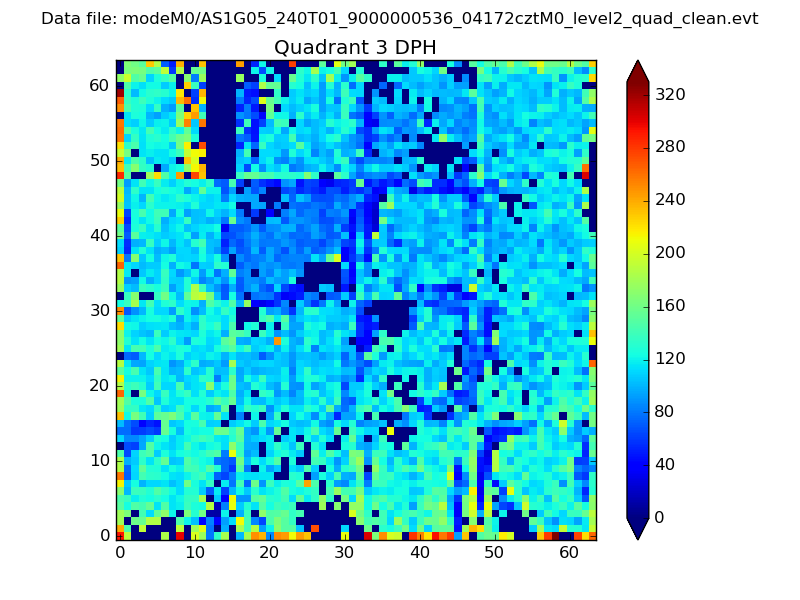 |
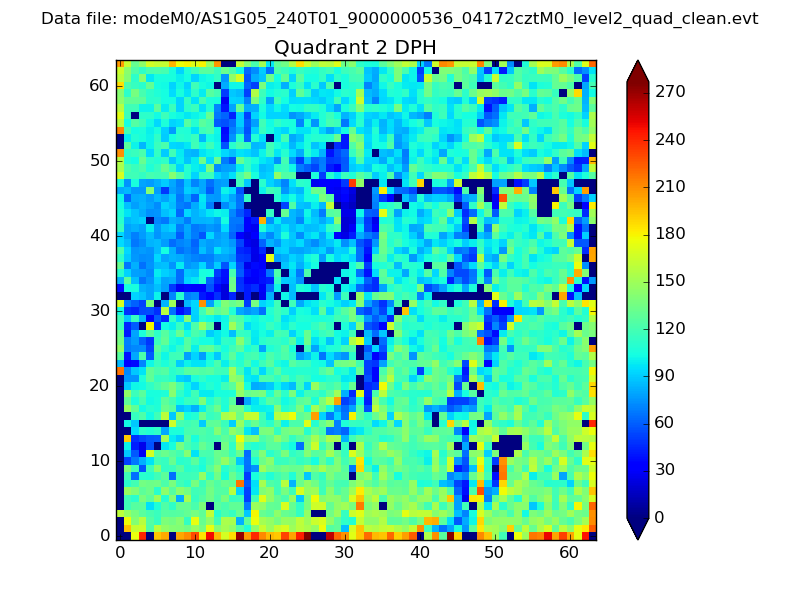 |
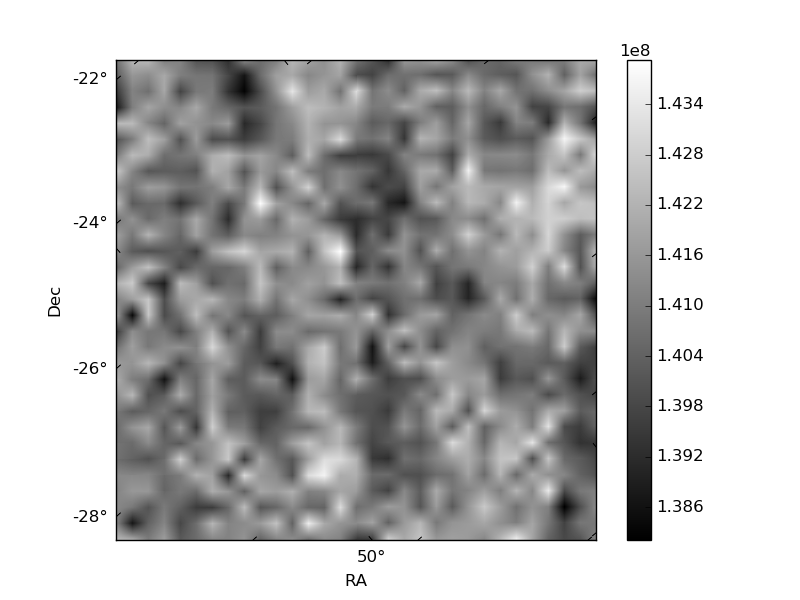
Quadrant C |
| Plot type | Count rate plots | Images |
|---|---|---|
| Comparison with Poisson distribution Blue bars denote a histogram of data divided into 1 sec bins. Red curve is a Poisson curve with rate = median count rate of data. |
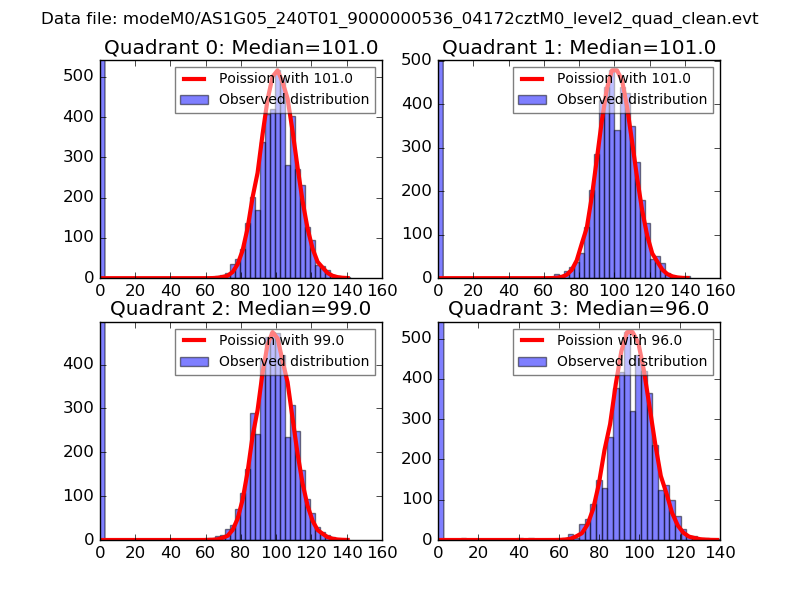 |
 |
| Quadrant-wise count rates Data is divided into 100 sec bins |
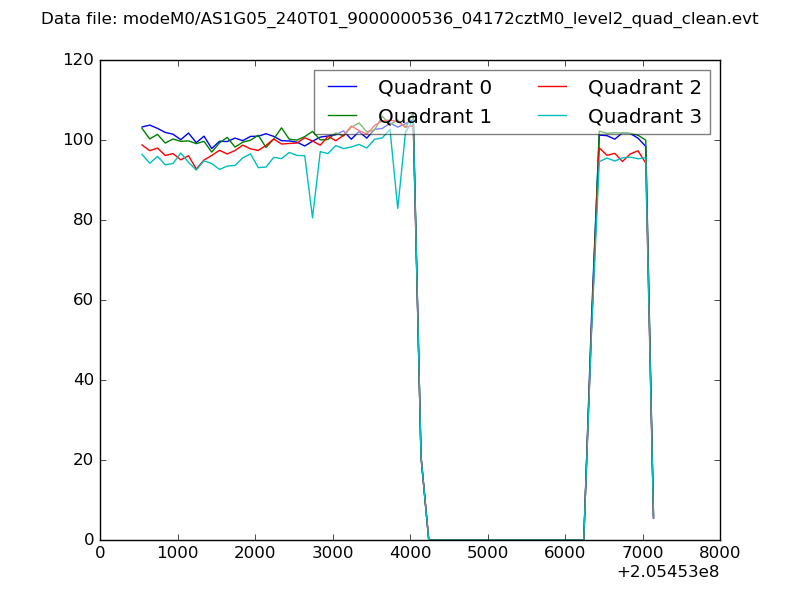 |
|
| Module-wise count rates for Quadrant A Data is divided into 100 sec bins |
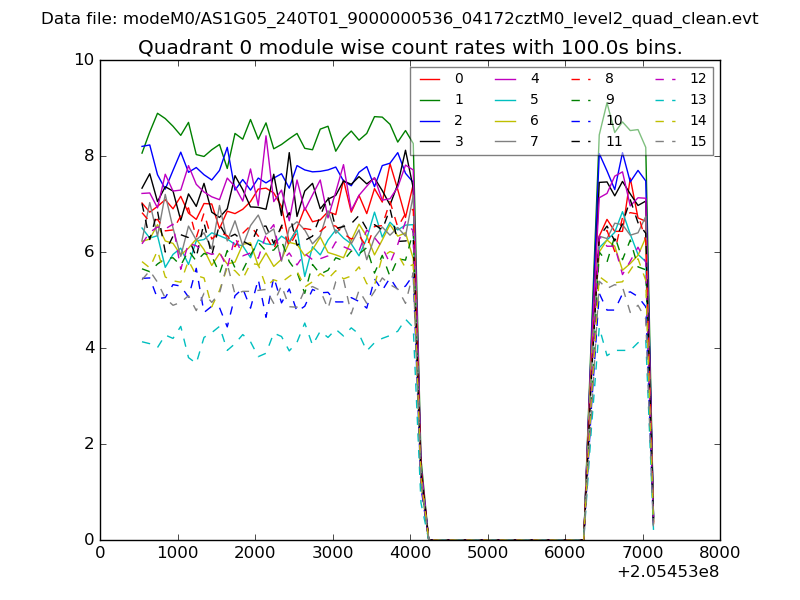 |
 |
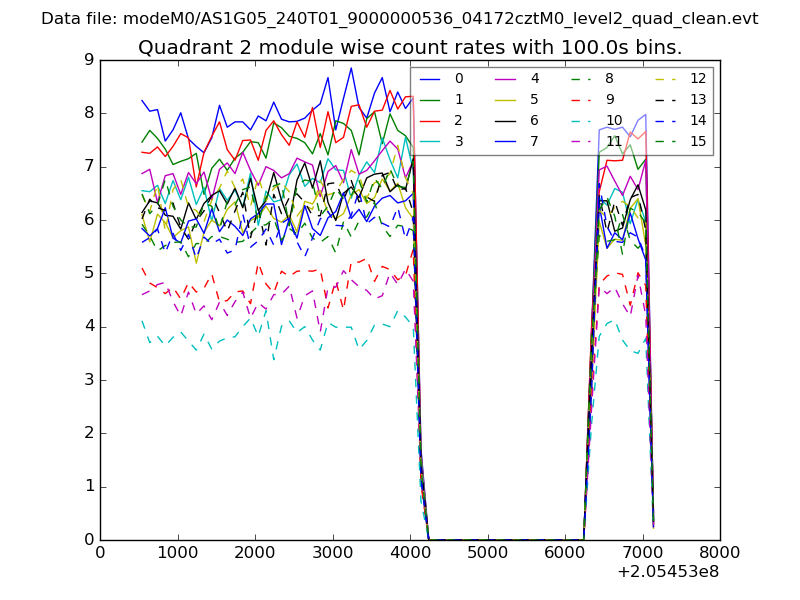
| Module-wise count rates for Quadrant B Data is divided into 100 sec bins |
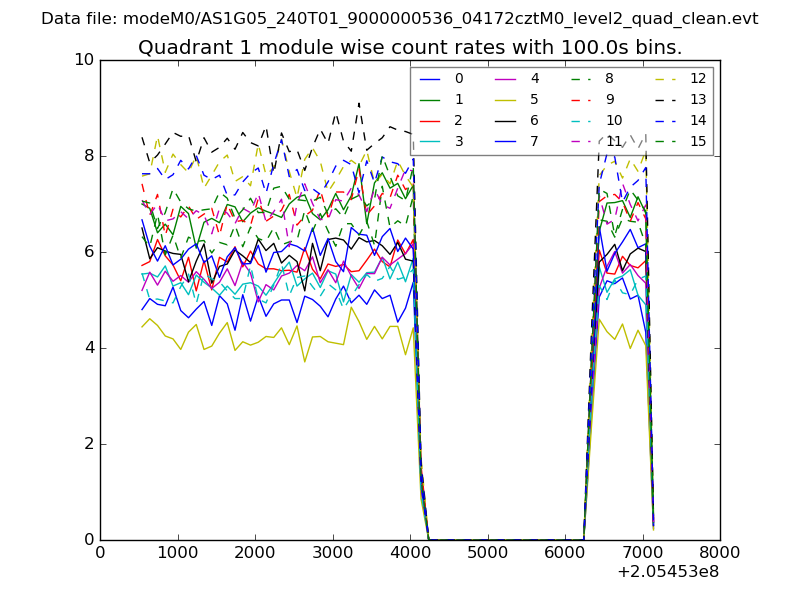 |
 |
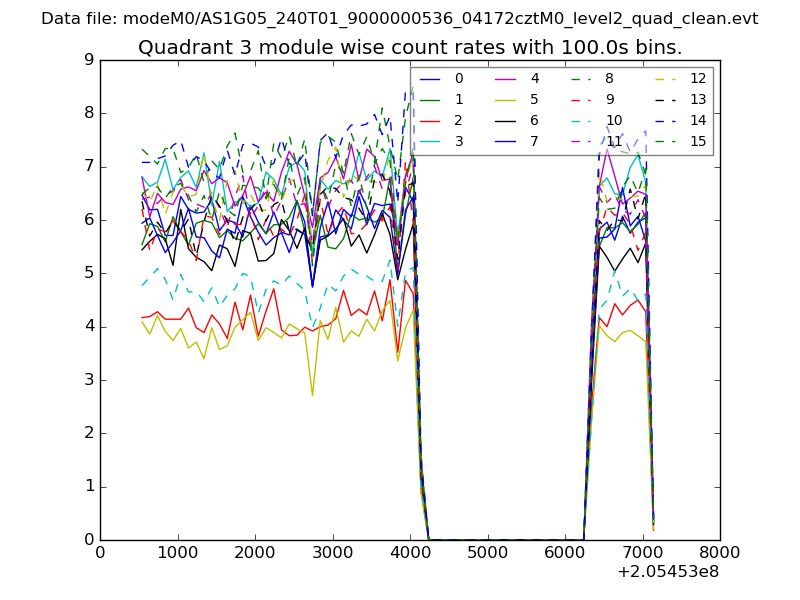
| Module-wise count rates for Quadrant C Data is divided into 100 sec bins |
 |
 |
| Module-wise count rates for Quadrant D Data is divided into 100 sec bins |
 |
 |
| Parameter | Plot |
|---|---|
| CZT HV Monitor | 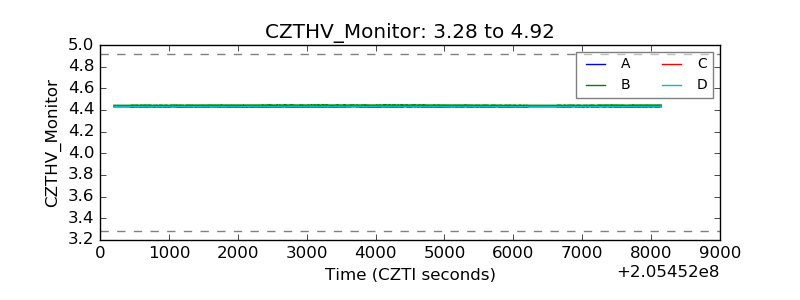 |
| D_VDD | 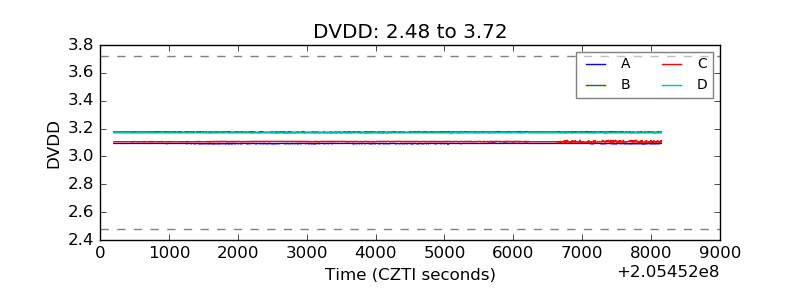 |
| Temperature 1 | 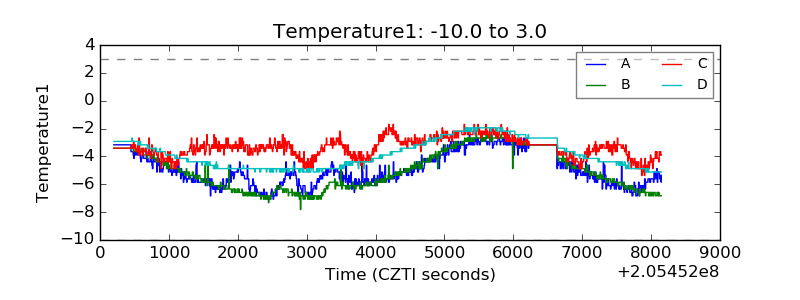 |
| Veto HV Monitor | 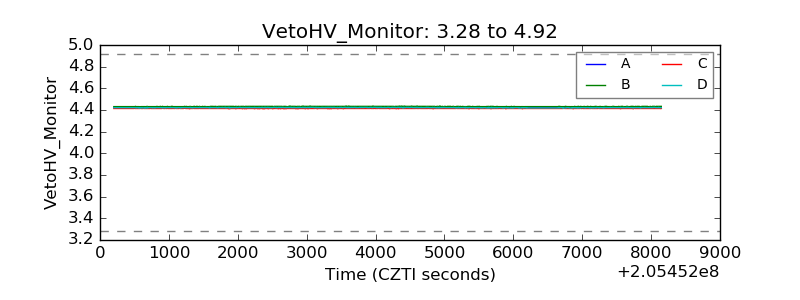 |
| Veto LLD | 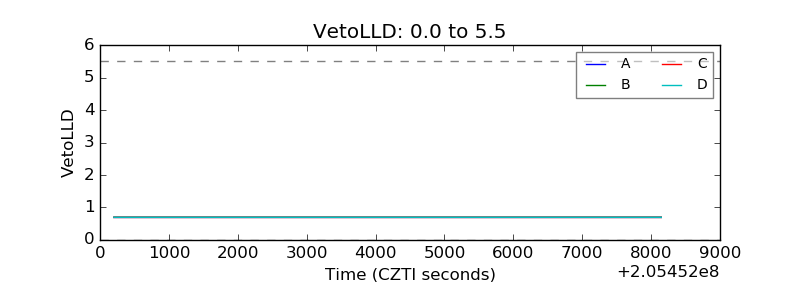 |
| Alpha Counter | 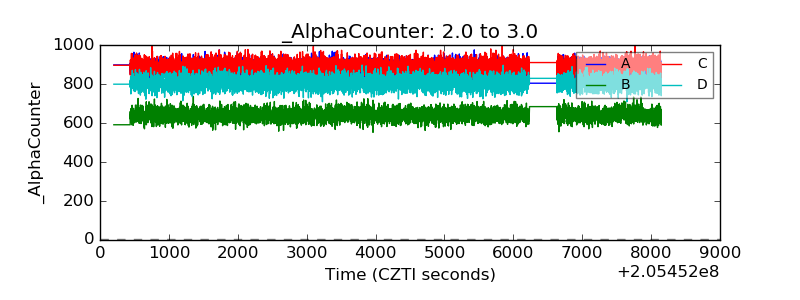 |
| _CPM_Rate | 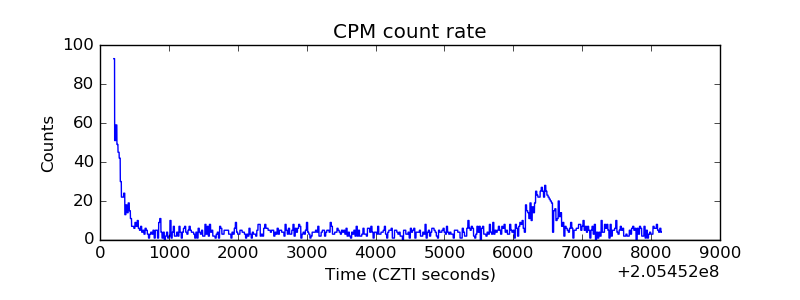 |
| CZT Counter | 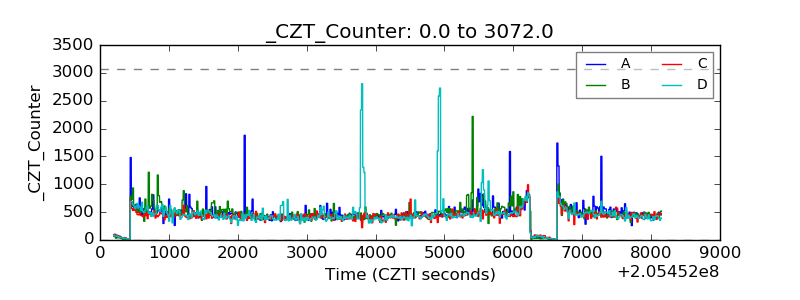 |
| +2.5 Volts monitor |  |
| +5 Volts monitor |  |
| _ROLL_ROT | 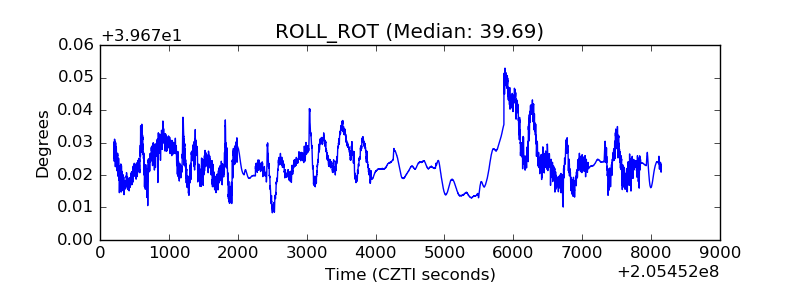 |
| _Roll_DEC | 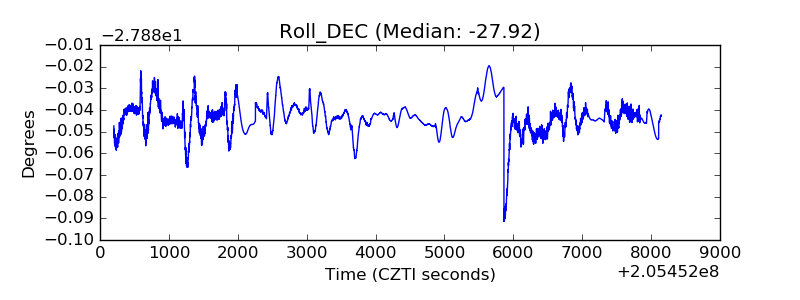 |
| _Roll_RA | 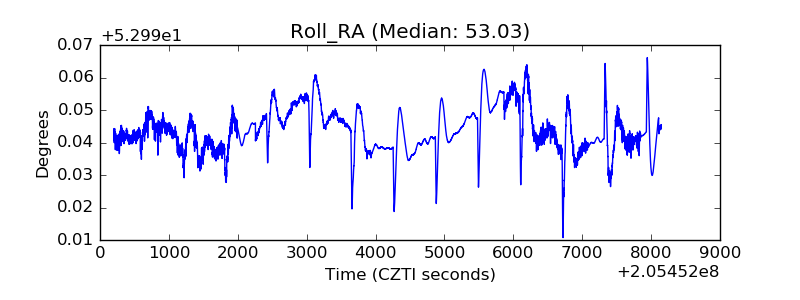 |
| Veto Counter | 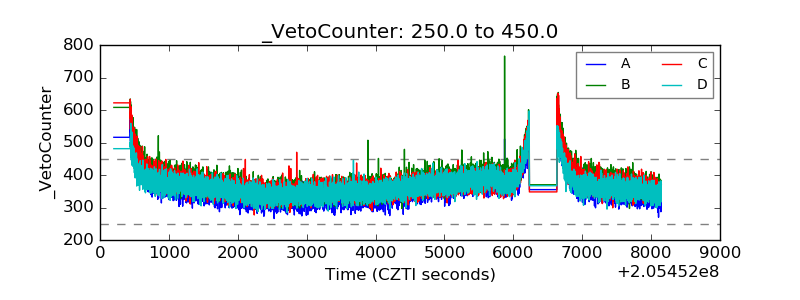 |