| Param | Original file | Final file |
|---|---|---|
| Filename | modeM0/AS1G05_240T01_9000000536_04173cztM0_level2.evt | modeM0/AS1G05_240T01_9000000536_04173cztM0_level2_quad_clean.evt |
| Size (bytes) | 599,241,600 | 82,739,520 |
| Size | 571.5 MB | 78.9 MB |
| Events in quadrant A | 4,555,986 | 481,674 |
| Events in quadrant B | 4,429,418 | 484,321 |
| Events in quadrant C | 3,957,859 | 476,269 |
| Events in quadrant D | 4,618,900 | 463,307 |
| Mode SS | |||
|---|---|---|---|
| Quadrant | BADHDUFLAG | Total packets | Discarded packets |
| A | 0 | 178 | 0 |
| B | 0 | 178 | 0 |
| C | 0 | 178 | 0 |
| D | 0 | 178 | 0 |
| Mode M9 | |||
|---|---|---|---|
| Quadrant | BADHDUFLAG | Total packets | Discarded packets |
| A | 0 | 6 | 0 |
| B | 0 | 6 | 0 |
| C | 0 | 6 | 0 |
| D | 0 | 6 | 0 |
| Mode M0 | |||
|---|---|---|---|
| Quadrant | BADHDUFLAG | Total packets | Discarded packets |
| A | 0 | 19326 | 6 |
| B | 0 | 18992 | 11 |
| C | 0 | 17781 | 3 |
| D | 0 | 20115 | 15 |
| Quadrant | Total seconds | Saturated seconds | Saturation percentage |
|---|---|---|---|
| A | 8641 | 159 | 1.840065% |
| B | 8640 | 137 | 1.585648% |
| C | 8642 | 78 | 0.902569% |
| D | 8637 | 195 | 2.257728% |
Noise dominated data is calculated using 1-second bins in cleaned event files. If a bin has >2000 counts, and if more than 50% of those come from <1% of pixels, then it is considered to be noise-dominated and hence unusable.
| Quadrant | # 1 sec bins | Bins with >0 counts | Bins with >2000 counts | High rate bins dominated by noise | Noise dominated (total time) | Noise dominated (detector-on time) | Marked lightcurve |
|---|---|---|---|---|---|---|---|
| A | 9222 | 8645 | 23 | 23 | 0.25% | 0.27% |  |
| B | 9222 | 8645 | 22 | 22 | 0.24% | 0.25% |  |
| C | 9222 | 8646 | 0 | 0 | 0.00% | 0.00% |  |
| D | 9222 | 8645 | 97 | 97 | 1.05% | 1.12% | 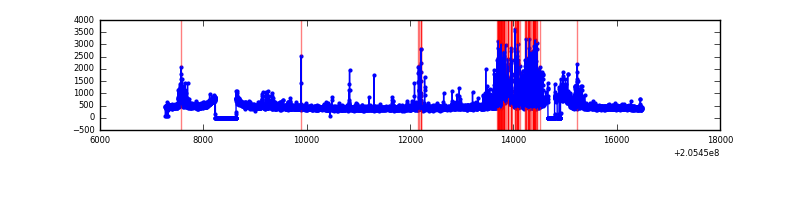 |
Top three noisy pixels from each quadrant. If the there are fewer than three noisy pixels in the level2.evt file, extra rows are filled as -1
| Pixel properties | Quadrant properties | ||||||
|---|---|---|---|---|---|---|---|
| Quadrant | DetID | PixID | Counts | Sigma | Mean | Median | Sigma |
| A | 3 | 1 | 310321 | 1467.3 | 1023 | 999 | 210.8 |
| A | 15 | 234 | 177033 | 835.04 | 1023 | 999 | 210.8 |
| A | 0 | 50 | 95119 | 446.47 | 1023 | 999 | 210.8 |
| B | 7 | 252 | 103272 | 511.01 | 1037 | 1011 | 200.1 |
| B | 15 | 204 | 98690 | 488.12 | 1037 | 1011 | 200.1 |
| B | 8 | 3 | 89021 | 439.8 | 1037 | 1011 | 200.1 |
| C | 8 | 128 | 27429 | 112.72 | 997 | 1001 | 234.5 |
| C | 9 | 144 | 11399 | 44.35 | 997 | 1001 | 234.5 |
| C | 8 | 112 | 11346 | 44.12 | 997 | 1001 | 234.5 |
| D | 2 | 232 | 475389 | 1949.17 | 991 | 958 | 243.4 |
| D | 13 | 239 | 179362 | 732.96 | 991 | 958 | 243.4 |
| D | 12 | 233 | 79468 | 322.55 | 991 | 958 | 243.4 |
Histogram calculated using DETX and DETY for each event in the final _common_clean file
| Quadrant A | 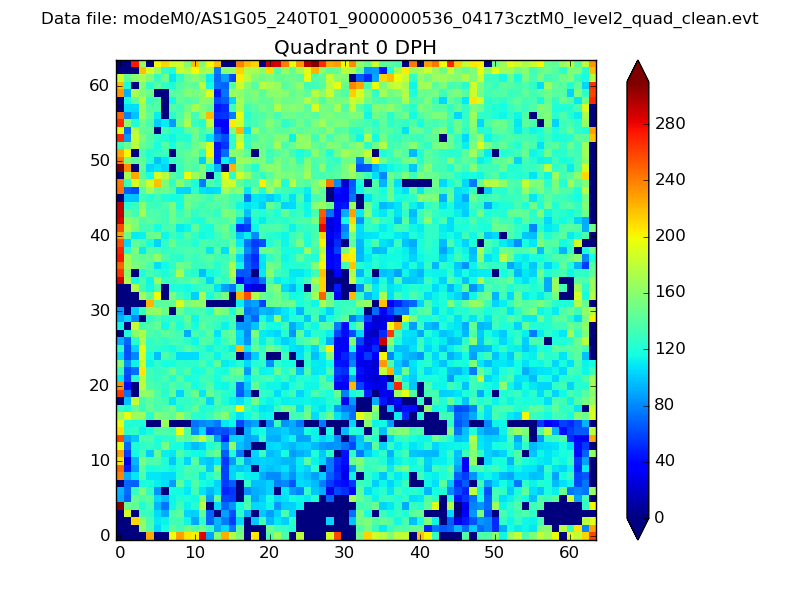 |
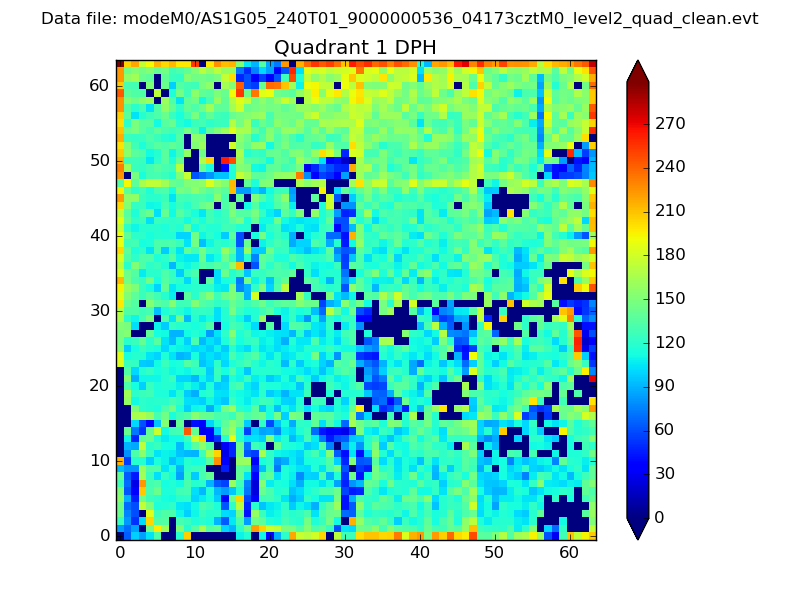 |
Quadrant B |
|---|---|---|---|
| Quadrant D | 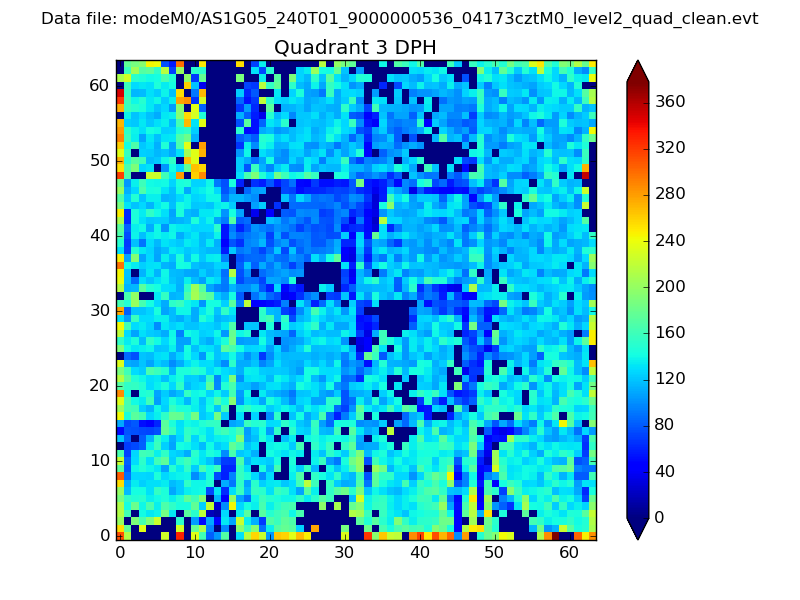 |
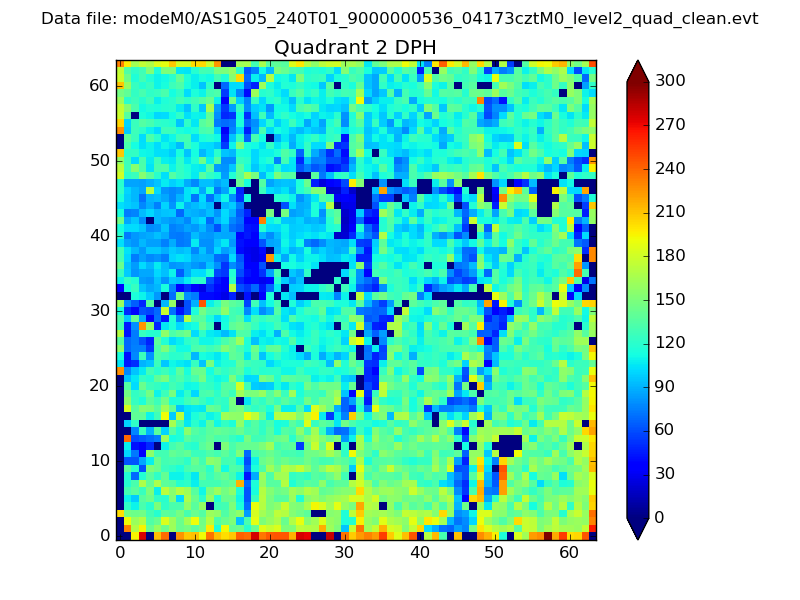 |
Quadrant C |
| Plot type | Count rate plots | Images |
|---|---|---|
| Comparison with Poisson distribution Blue bars denote a histogram of data divided into 1 sec bins. Red curve is a Poisson curve with rate = median count rate of data. |
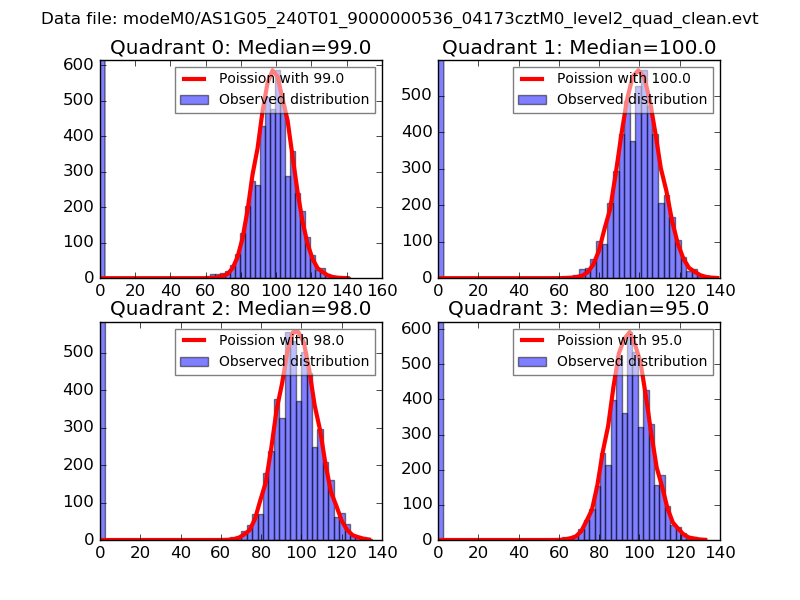 |
 |
| Quadrant-wise count rates Data is divided into 100 sec bins |
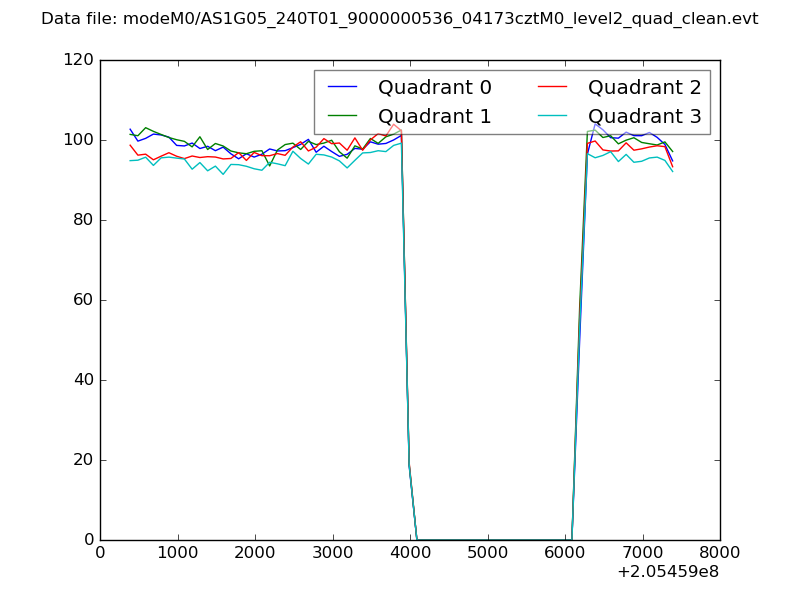 |
|
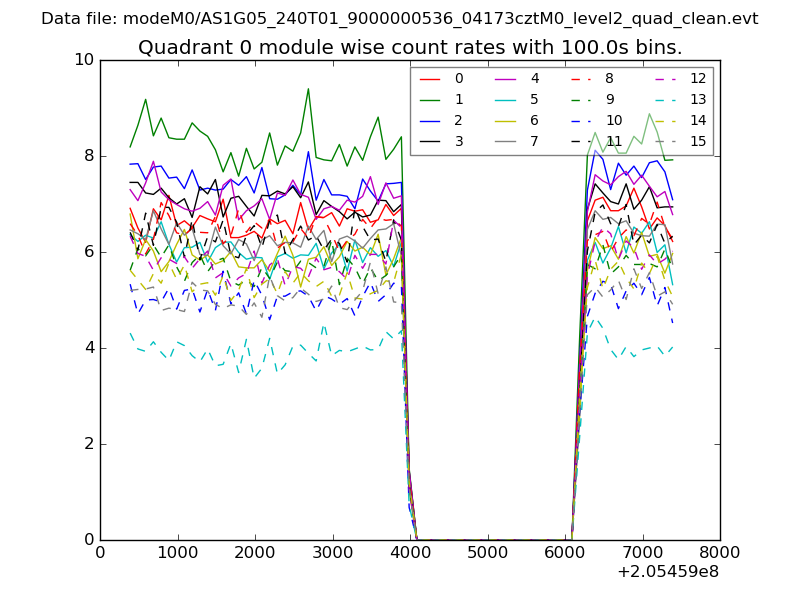
| Module-wise count rates for Quadrant A Data is divided into 100 sec bins |
 |
 |
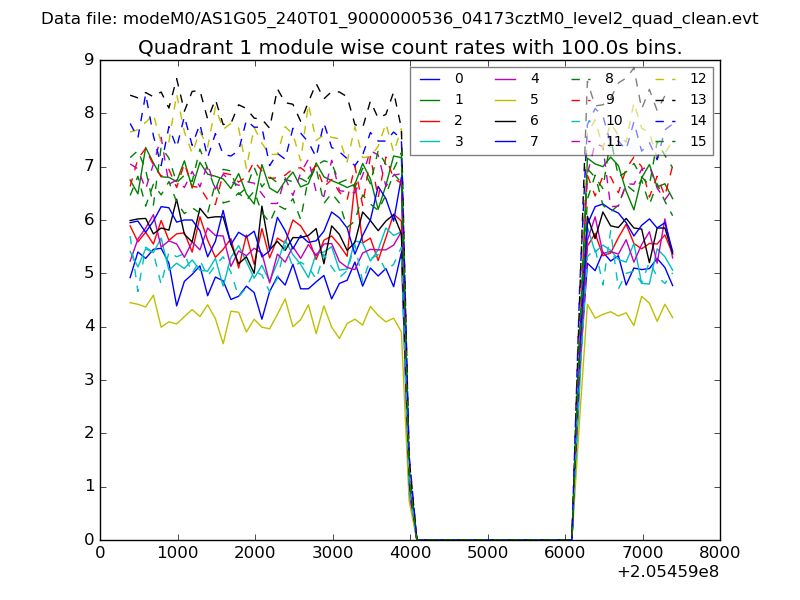
| Module-wise count rates for Quadrant B Data is divided into 100 sec bins |
 |
 |
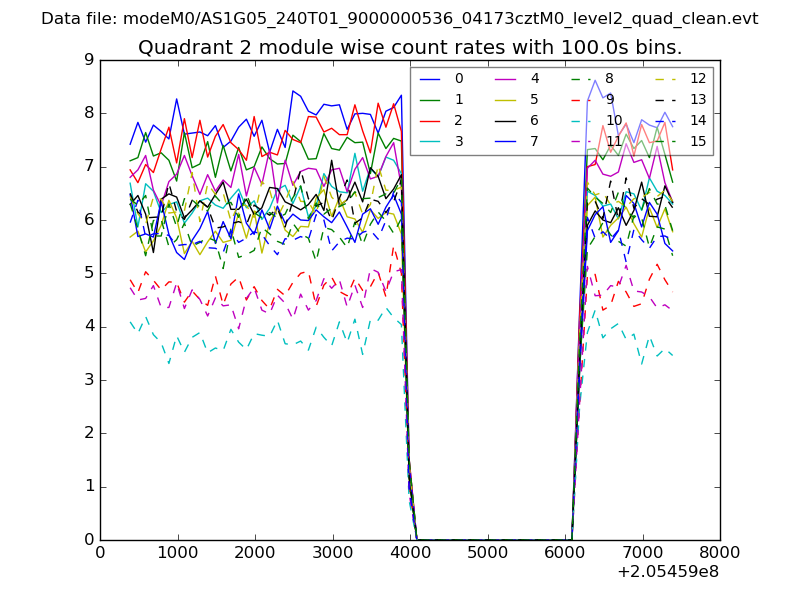
| Module-wise count rates for Quadrant C Data is divided into 100 sec bins |
 |
 |
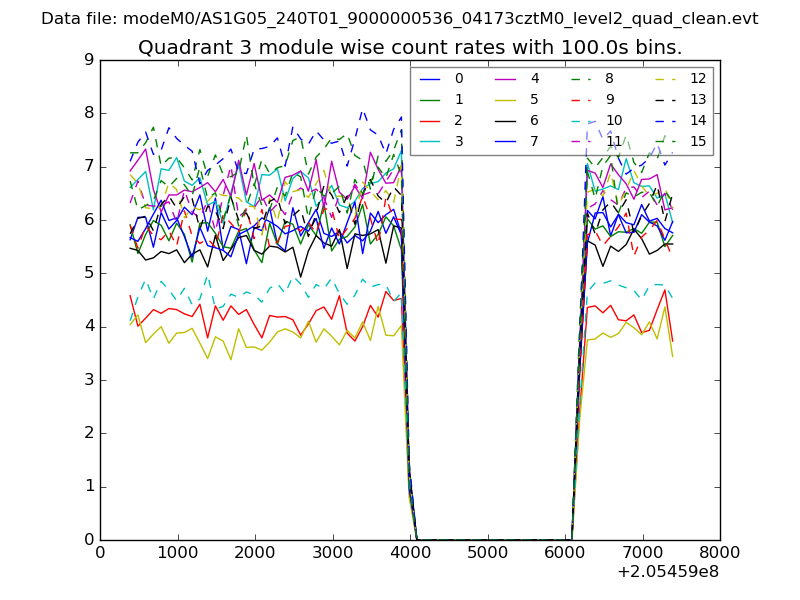
| Module-wise count rates for Quadrant D Data is divided into 100 sec bins |
 |
 |
| Parameter | Plot |
|---|---|
| CZT HV Monitor | 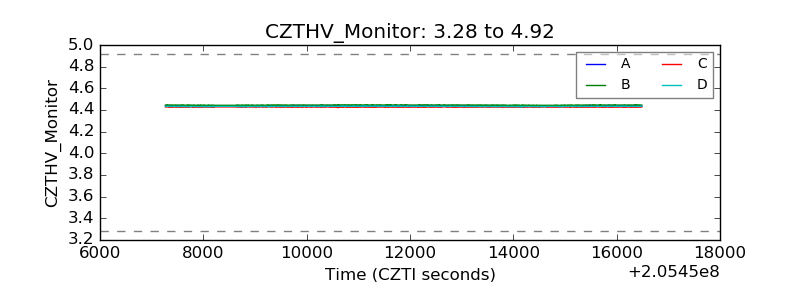 |
| D_VDD | 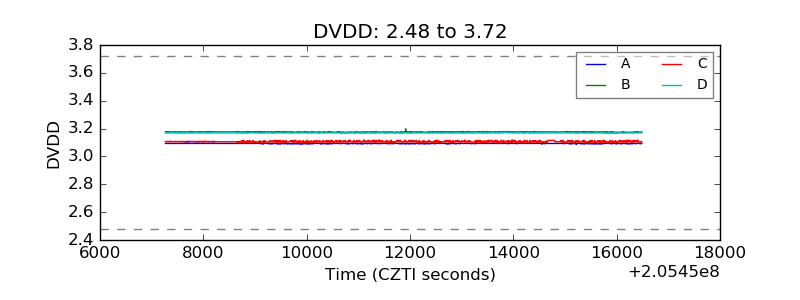 |
| Temperature 1 | 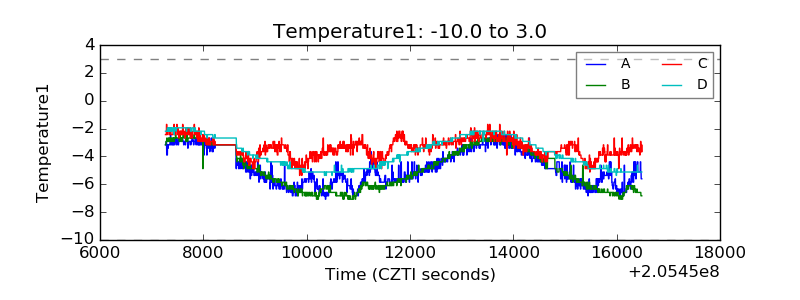 |
| Veto HV Monitor | 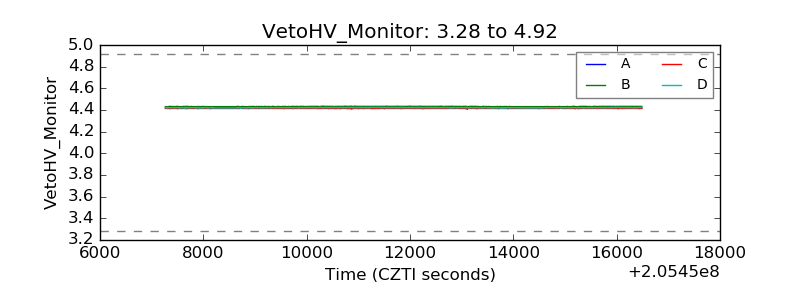 |
| Veto LLD | 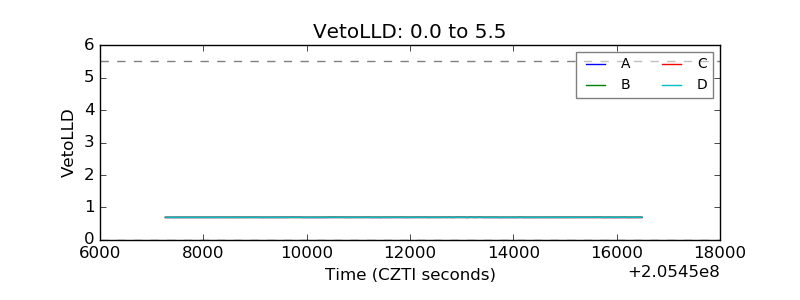 |
| Alpha Counter | 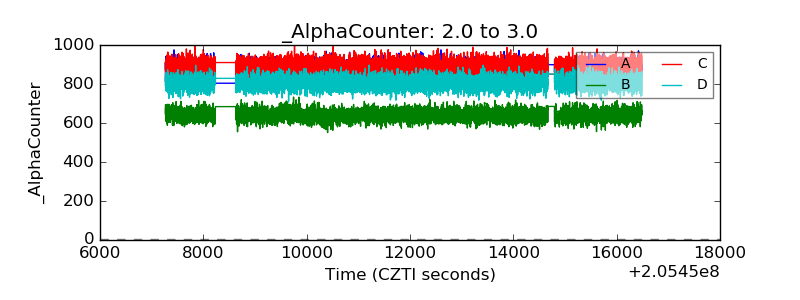 |
| _CPM_Rate | 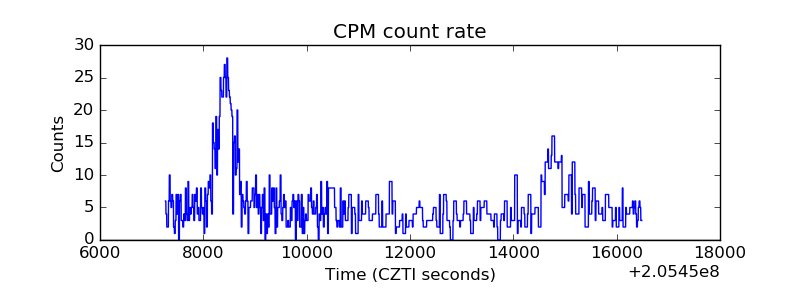 |
| CZT Counter | 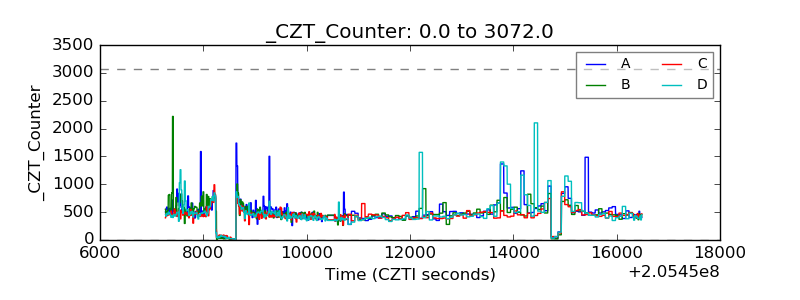 |
| +2.5 Volts monitor |  |
| +5 Volts monitor | 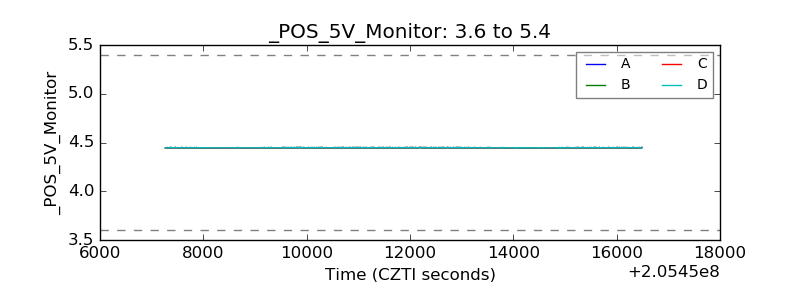 |
| _ROLL_ROT | 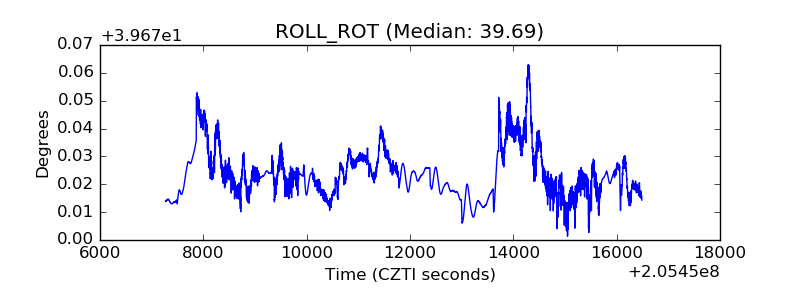 |
| _Roll_DEC | 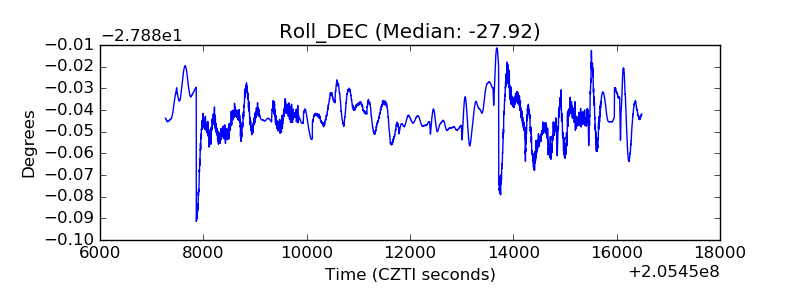 |
| _Roll_RA | 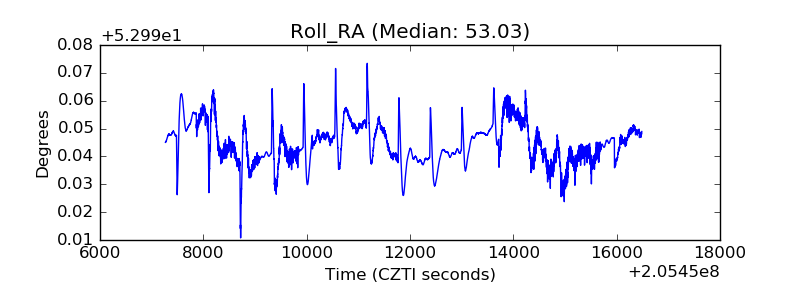 |
| Veto Counter | 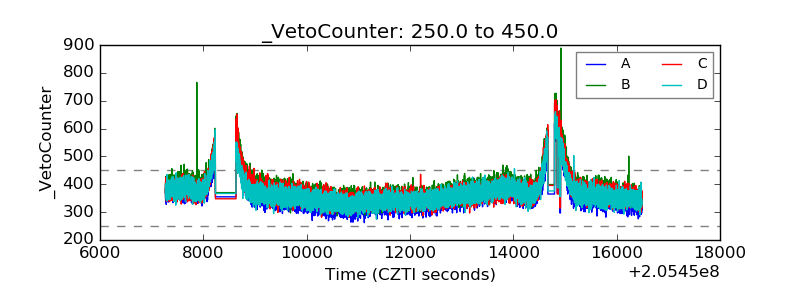 |