| Param | Original file | Final file |
|---|---|---|
| Filename | modeM0/AS1G05_240T01_9000000536_04174cztM0_level2.evt | modeM0/AS1G05_240T01_9000000536_04174cztM0_level2_quad_clean.evt |
| Size (bytes) | 527,555,520 | 85,017,600 |
| Size | 503.1 MB | 81.1 MB |
| Events in quadrant A | 4,366,196 | 516,900 |
| Events in quadrant B | 3,666,099 | 521,008 |
| Events in quadrant C | 3,433,214 | 513,614 |
| Events in quadrant D | 3,997,860 | 496,486 |
| Mode SS | |||
|---|---|---|---|
| Quadrant | BADHDUFLAG | Total packets | Discarded packets |
| A | 0 | 154 | 0 |
| B | 0 | 154 | 0 |
| C | 0 | 154 | 0 |
| D | 0 | 154 | 0 |
| Mode M9 | |||
|---|---|---|---|
| Quadrant | BADHDUFLAG | Total packets | Discarded packets |
| A | 0 | 3 | 0 |
| B | 0 | 3 | 0 |
| C | 0 | 3 | 0 |
| D | 0 | 3 | 0 |
| Mode M0 | |||
|---|---|---|---|
| Quadrant | BADHDUFLAG | Total packets | Discarded packets |
| A | 0 | 18069 | 3 |
| B | 0 | 15966 | 2 |
| C | 0 | 15515 | 2 |
| D | 0 | 17534 | 2 |
| Quadrant | Total seconds | Saturated seconds | Saturation percentage |
|---|---|---|---|
| A | 7566 | 202 | 2.669839% |
| B | 7566 | 93 | 1.229183% |
| C | 7566 | 40 | 0.528681% |
| D | 7566 | 102 | 1.348136% |
Noise dominated data is calculated using 1-second bins in cleaned event files. If a bin has >2000 counts, and if more than 50% of those come from <1% of pixels, then it is considered to be noise-dominated and hence unusable.
| Quadrant | # 1 sec bins | Bins with >0 counts | Bins with >2000 counts | High rate bins dominated by noise | Noise dominated (total time) | Noise dominated (detector-on time) | Marked lightcurve |
|---|---|---|---|---|---|---|---|
| A | 7881 | 7567 | 75 | 75 | 0.95% | 0.99% | 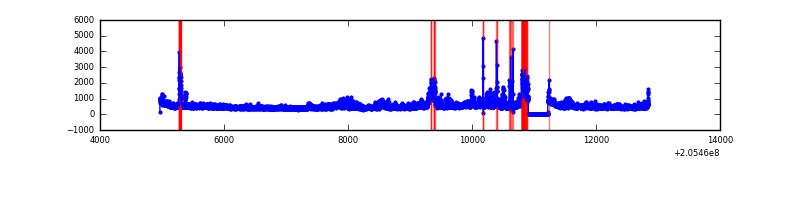 |
| B | 7881 | 7567 | 10 | 10 | 0.13% | 0.13% | 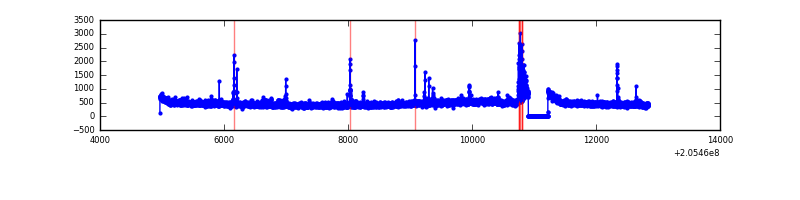 |
| C | 7881 | 7567 | 1 | 1 | 0.01% | 0.01% | 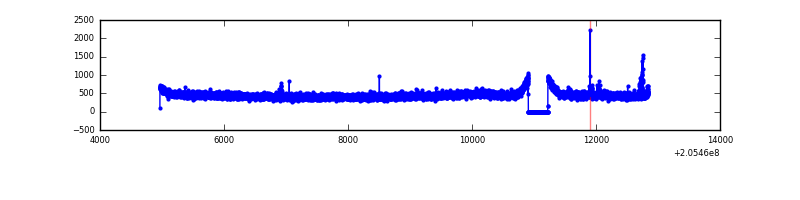 |
| D | 7881 | 7567 | 66 | 66 | 0.84% | 0.87% | 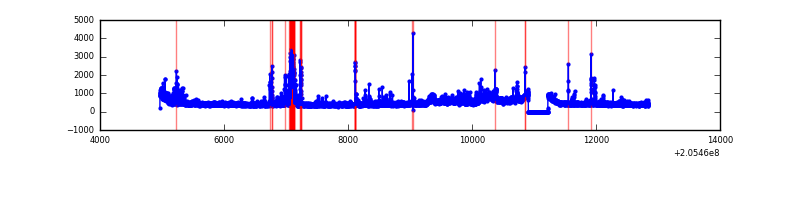 |
Top three noisy pixels from each quadrant. If the there are fewer than three noisy pixels in the level2.evt file, extra rows are filled as -1
| Pixel properties | Quadrant properties | ||||||
|---|---|---|---|---|---|---|---|
| Quadrant | DetID | PixID | Counts | Sigma | Mean | Median | Sigma |
| A | 3 | 1 | 520828 | 2914.72 | 866 | 845 | 178.4 |
| A | 15 | 234 | 394643 | 2207.4 | 866 | 845 | 178.4 |
| A | 0 | 50 | 84067 | 466.49 | 866 | 845 | 178.4 |
| B | 10 | 16 | 58622 | 333.21 | 889 | 867 | 173.3 |
| B | 15 | 204 | 52514 | 297.97 | 889 | 867 | 173.3 |
| B | 7 | 252 | 43441 | 245.62 | 889 | 867 | 173.3 |
| C | 10 | 65 | 38456 | 186.48 | 858 | 861 | 201.6 |
| C | 8 | 128 | 21637 | 103.05 | 858 | 861 | 201.6 |
| C | 8 | 112 | 8462 | 37.7 | 858 | 861 | 201.6 |
| D | 2 | 232 | 357640 | 1708.62 | 852 | 826 | 208.8 |
| D | 13 | 239 | 242914 | 1159.25 | 852 | 826 | 208.8 |
| D | 10 | 172 | 49638 | 233.74 | 852 | 826 | 208.8 |
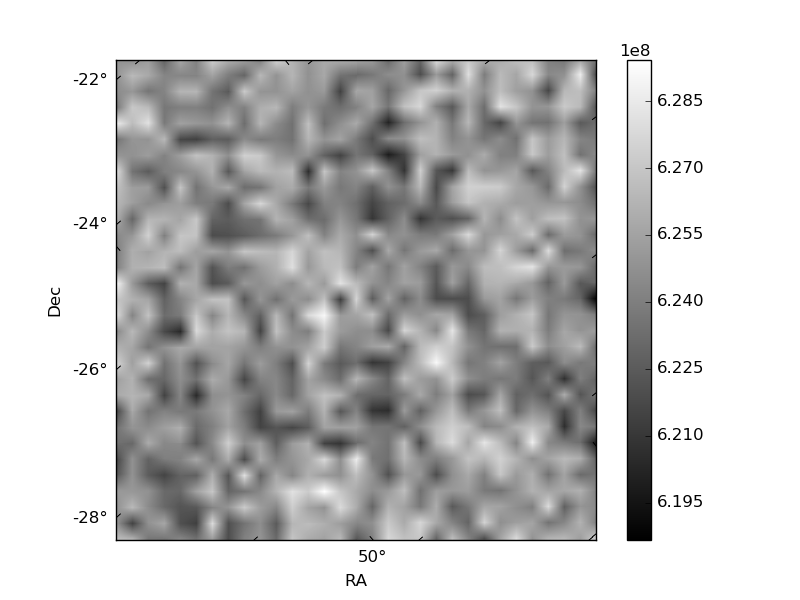
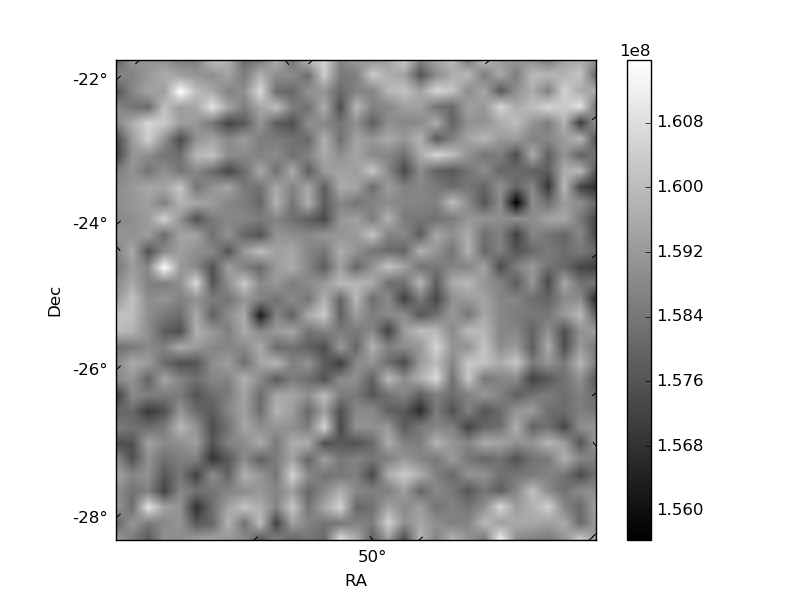
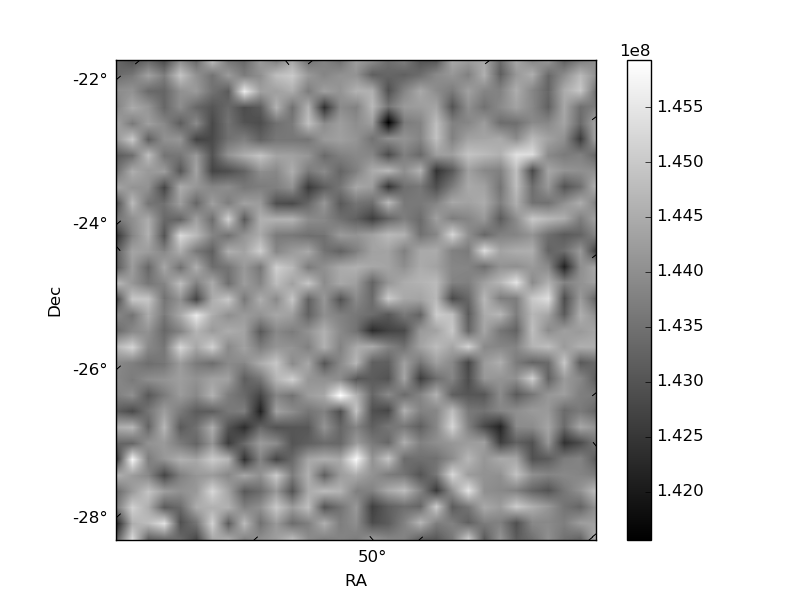
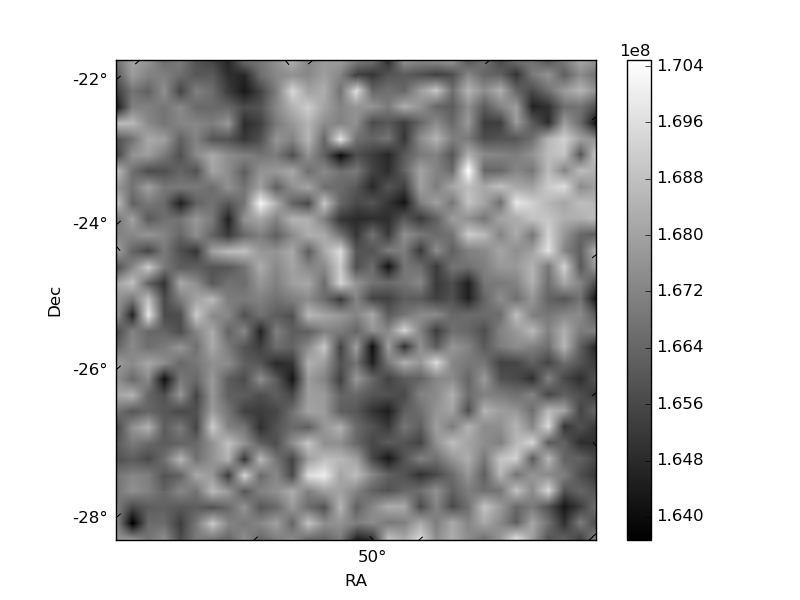
Histogram calculated using DETX and DETY for each event in the final _common_clean file
| Quadrant A | 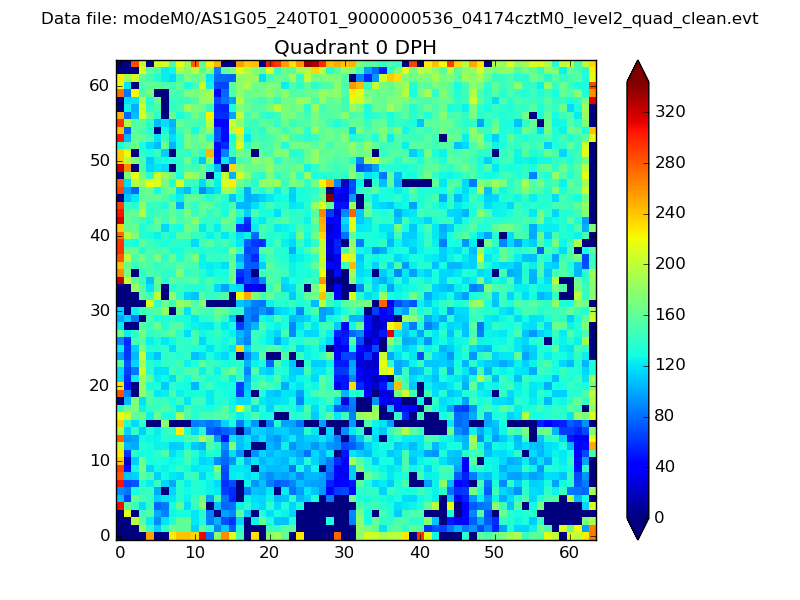 |
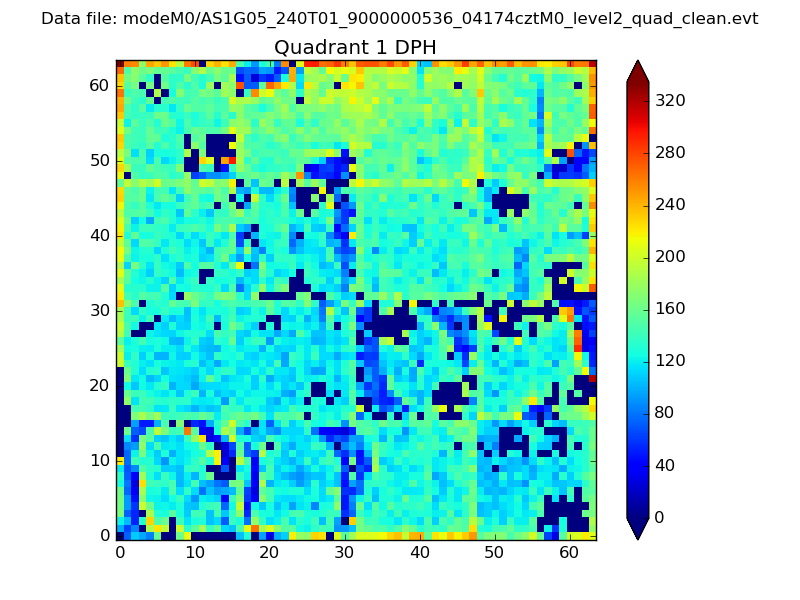 |
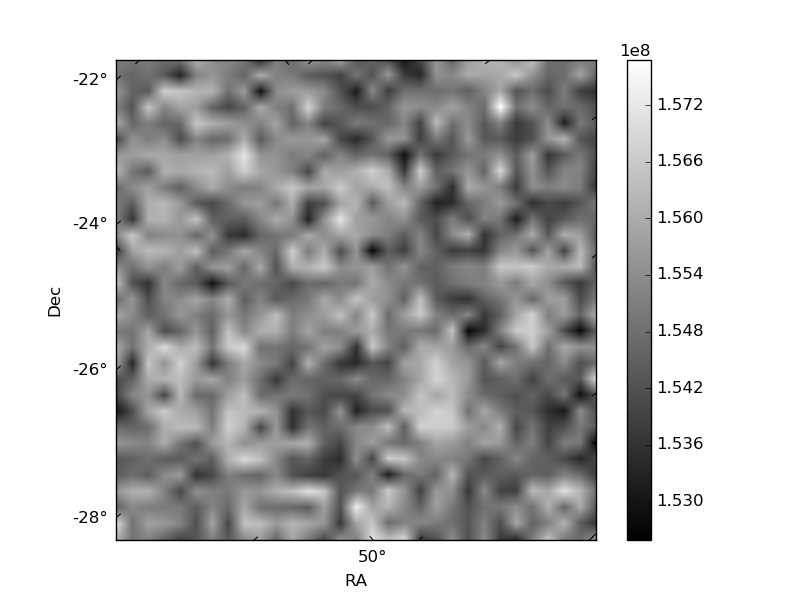
Quadrant B |
|---|---|---|---|
| Quadrant D | 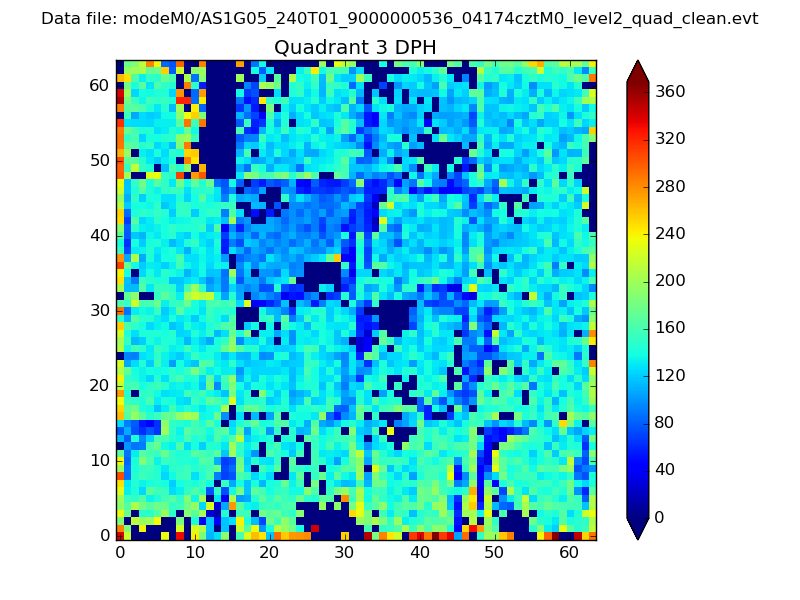 |
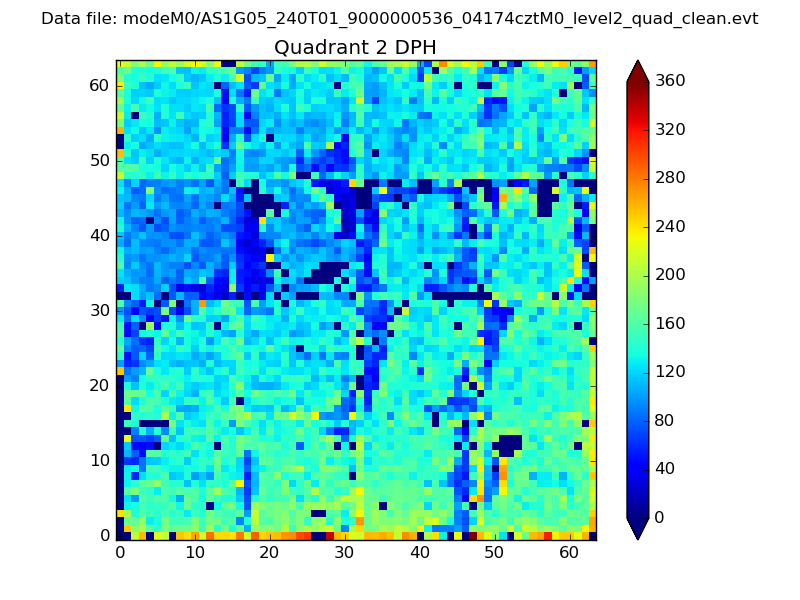 |
Quadrant C |
| Plot type | Count rate plots | Images |
|---|---|---|
| Comparison with Poisson distribution Blue bars denote a histogram of data divided into 1 sec bins. Red curve is a Poisson curve with rate = median count rate of data. |
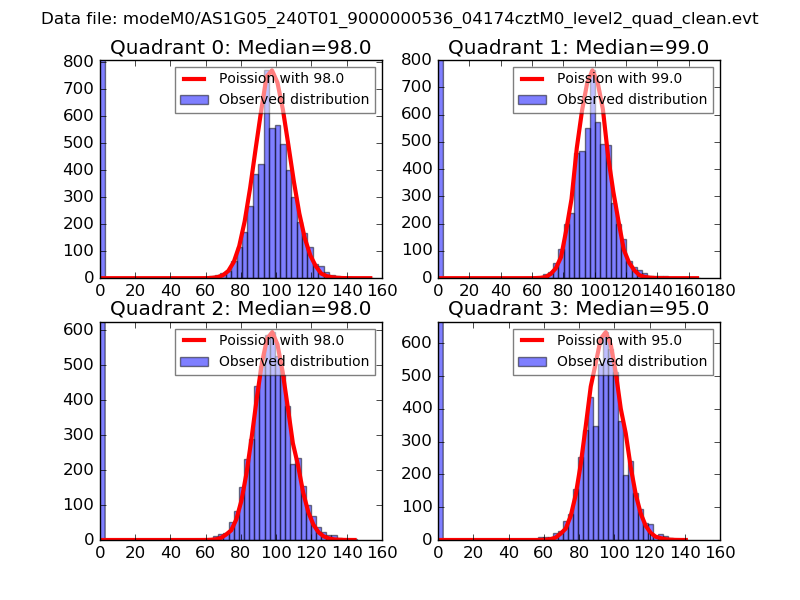 |
 |
| Quadrant-wise count rates Data is divided into 100 sec bins |
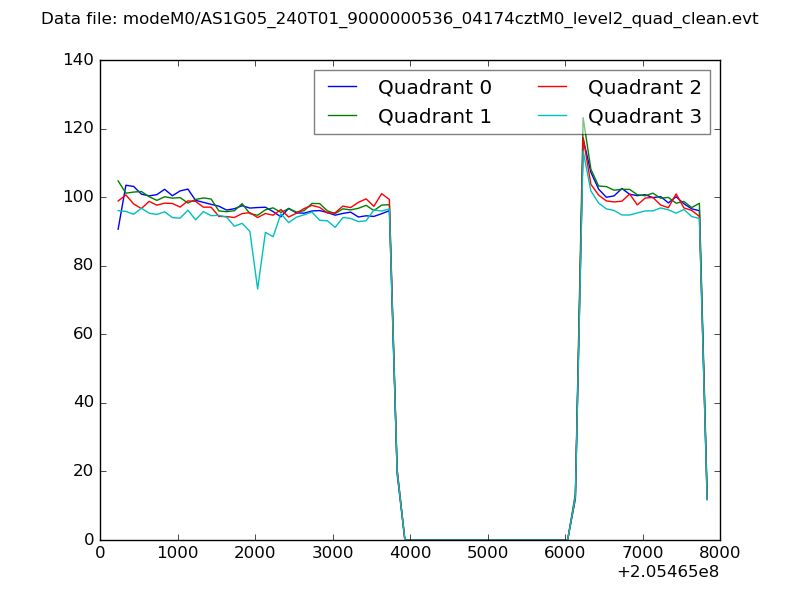 |
|
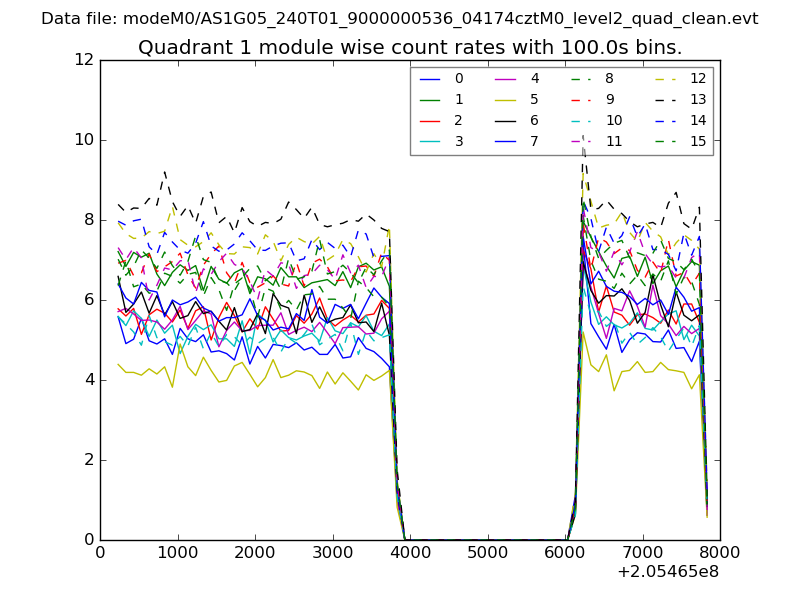
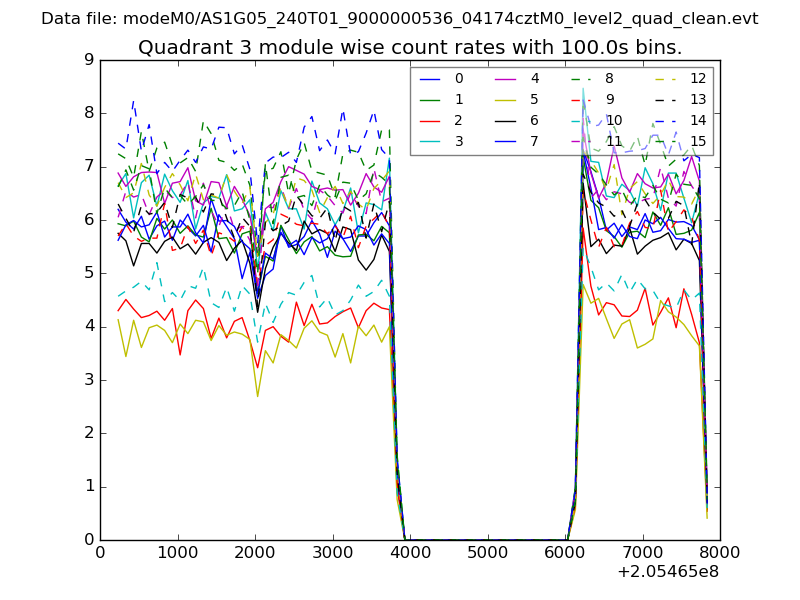
| Module-wise count rates for Quadrant A Data is divided into 100 sec bins |
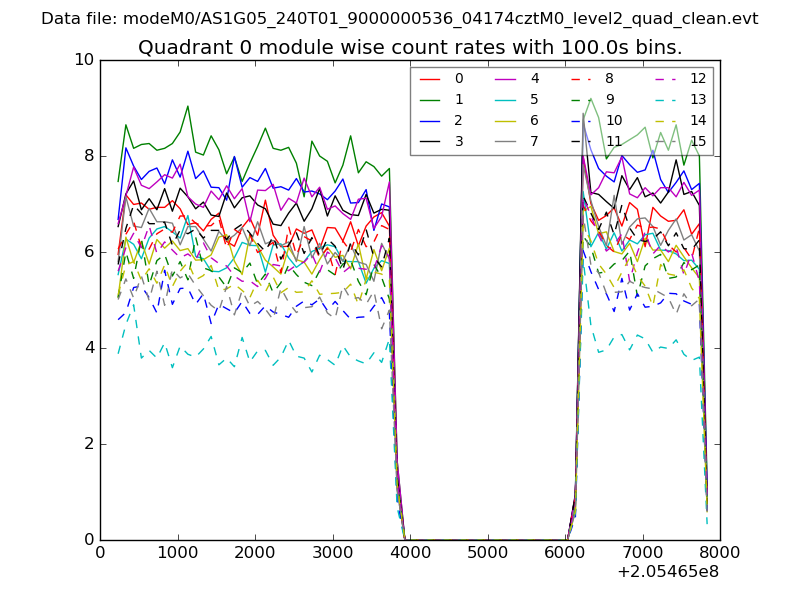 |
 |
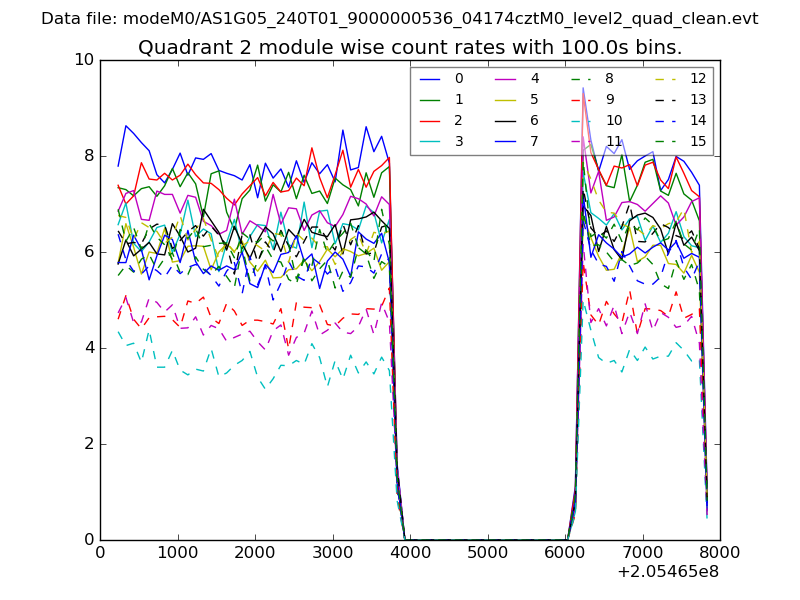
| Module-wise count rates for Quadrant B Data is divided into 100 sec bins |
 |
 |
| Module-wise count rates for Quadrant C Data is divided into 100 sec bins |
 |
 |
| Module-wise count rates for Quadrant D Data is divided into 100 sec bins |
 |
 |
| Parameter | Plot |
|---|---|
| CZT HV Monitor | 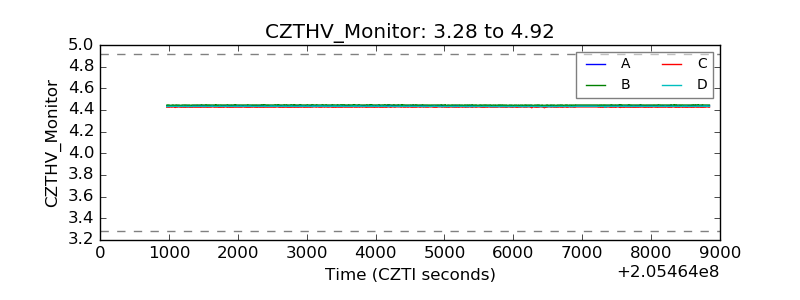 |
| D_VDD | 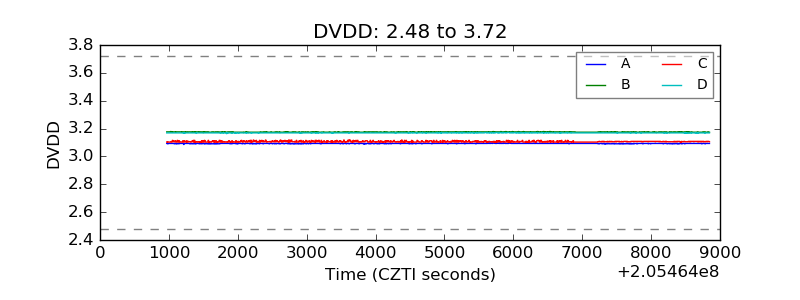 |
| Temperature 1 | 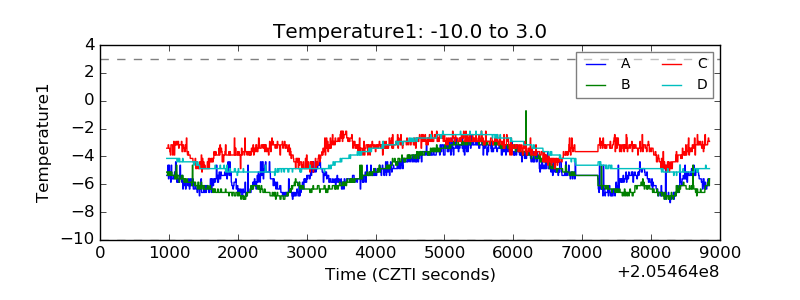 |
| Veto HV Monitor | 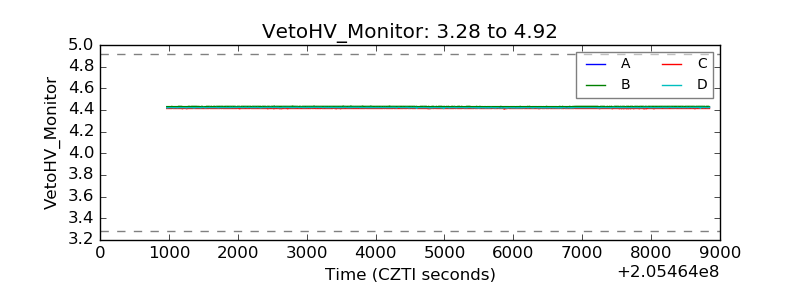 |
| Veto LLD | 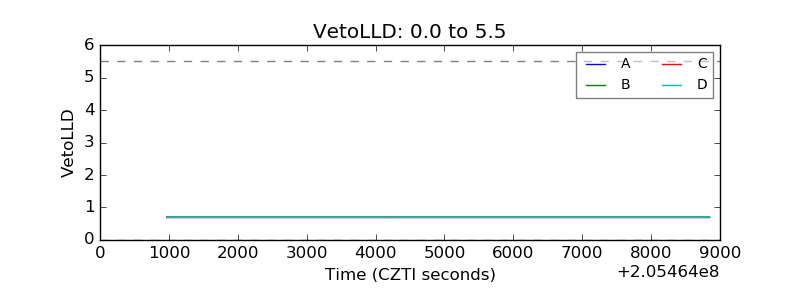 |
| Alpha Counter | 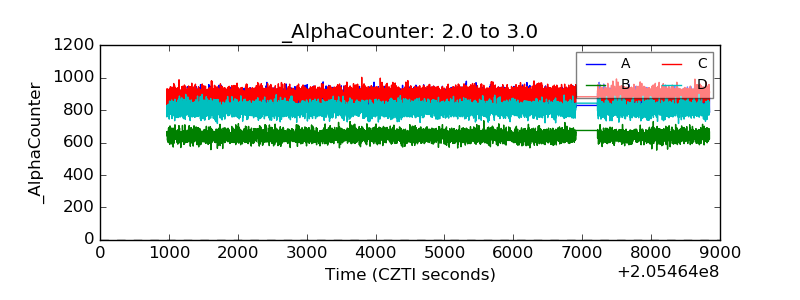 |
| _CPM_Rate | 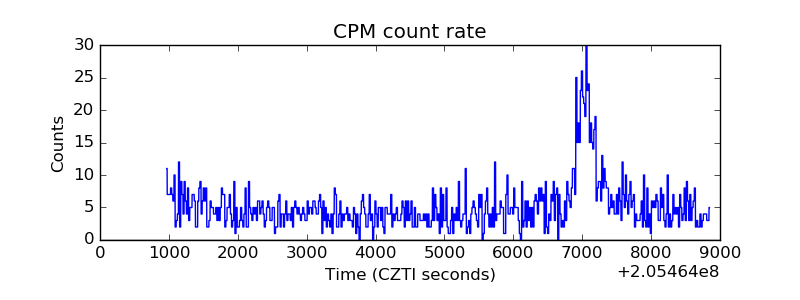 |
| CZT Counter | 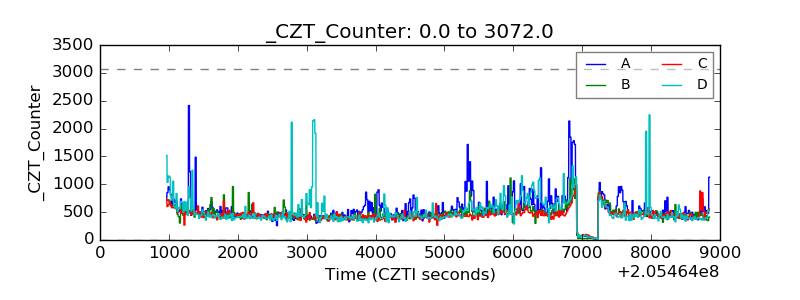 |
| +2.5 Volts monitor |  |
| +5 Volts monitor |  |
| _ROLL_ROT | 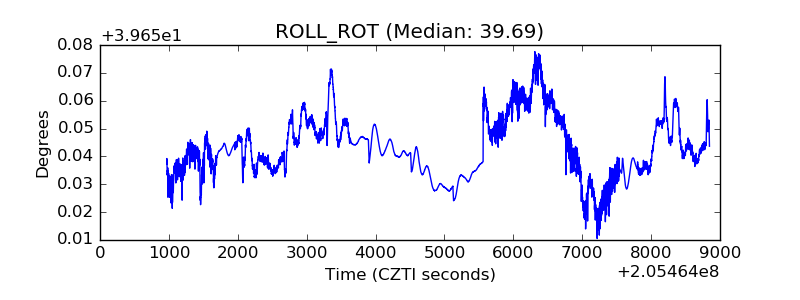 |
| _Roll_DEC | 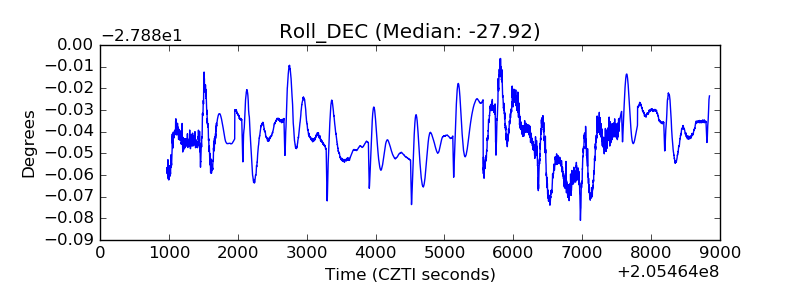 |
| _Roll_RA | 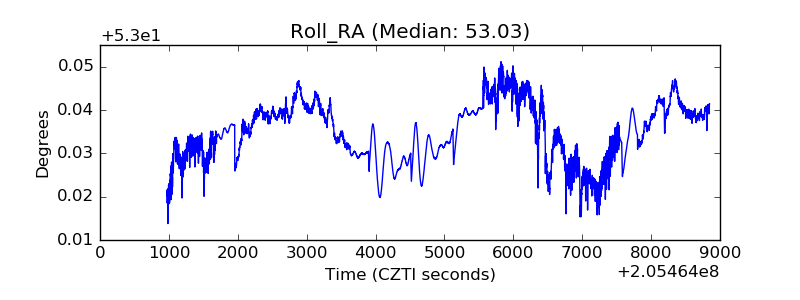 |
| Veto Counter | 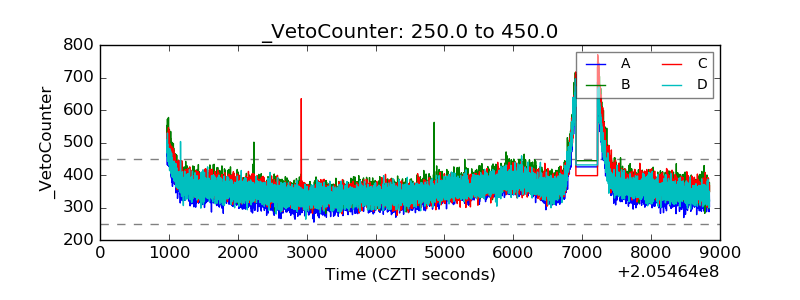 |