| Param | Original file | Final file |
|---|---|---|
| Filename | modeM0/AS1G05_240T01_9000000536_04176cztM0_level2.evt | modeM0/AS1G05_240T01_9000000536_04176cztM0_level2_quad_clean.evt |
| Size (bytes) | 401,785,920 | 57,591,360 |
| Size | 383.2 MB | 54.9 MB |
| Events in quadrant A | 3,602,180 | 330,146 |
| Events in quadrant B | 2,837,372 | 343,012 |
| Events in quadrant C | 2,548,255 | 342,512 |
| Events in quadrant D | 2,792,577 | 329,296 |
| Mode SS | |||
|---|---|---|---|
| Quadrant | BADHDUFLAG | Total packets | Discarded packets |
| A | 0 | 116 | 0 |
| B | 0 | 116 | 0 |
| C | 0 | 116 | 2 |
| D | 0 | 116 | 2 |
| Mode M0 | |||
|---|---|---|---|
| Quadrant | BADHDUFLAG | Total packets | Discarded packets |
| A | 0 | 14745 | 360 |
| B | 0 | 12356 | 112 |
| C | 0 | 11714 | 76 |
| D | 0 | 12578 | 121 |
| Quadrant | Total seconds | Saturated seconds | Saturation percentage |
|---|---|---|---|
| A | 5676 | 264 | 4.651163% |
| B | 5700 | 64 | 1.122807% |
| C | 5712 | 14 | 0.245098% |
| D | 5695 | 50 | 0.877963% |
Noise dominated data is calculated using 1-second bins in cleaned event files. If a bin has >2000 counts, and if more than 50% of those come from <1% of pixels, then it is considered to be noise-dominated and hence unusable.
| Quadrant | # 1 sec bins | Bins with >0 counts | Bins with >2000 counts | High rate bins dominated by noise | Noise dominated (total time) | Noise dominated (detector-on time) | Marked lightcurve |
|---|---|---|---|---|---|---|---|
| A | 5765 | 5729 | 187 | 187 | 3.24% | 3.26% | 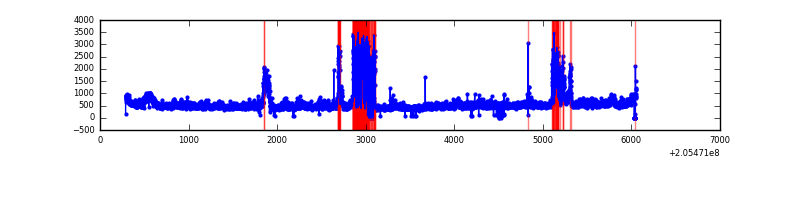 |
| B | 5765 | 5738 | 31 | 31 | 0.54% | 0.54% | 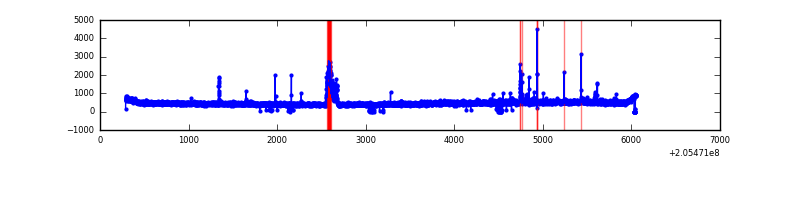 |
| C | 5765 | 5745 | 1 | 1 | 0.02% | 0.02% |  |
| D | 5765 | 5744 | 28 | 28 | 0.49% | 0.49% | 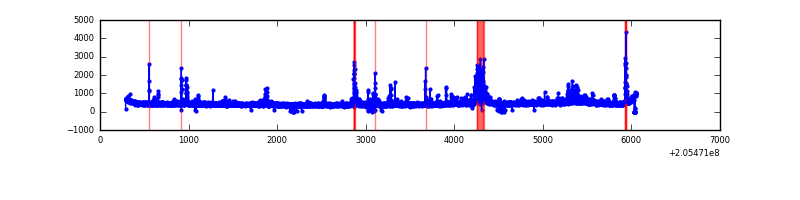 |
Top three noisy pixels from each quadrant. If the there are fewer than three noisy pixels in the level2.evt file, extra rows are filled as -1
| Pixel properties | Quadrant properties | ||||||
|---|---|---|---|---|---|---|---|
| Quadrant | DetID | PixID | Counts | Sigma | Mean | Median | Sigma |
| A | 0 | 199 | 487398 | 3688.39 | 640 | 627 | 132.0 |
| A | 3 | 1 | 292823 | 2214.05 | 640 | 627 | 132.0 |
| A | 15 | 234 | 209766 | 1584.7 | 640 | 627 | 132.0 |
| B | 7 | 252 | 143195 | 1101.66 | 660 | 644 | 129.4 |
| B | 10 | 16 | 48954 | 373.35 | 660 | 644 | 129.4 |
| B | 15 | 204 | 29521 | 223.17 | 660 | 644 | 129.4 |
| C | 10 | 65 | 42675 | 279.1 | 639 | 642 | 150.6 |
| C | 9 | 144 | 10131 | 63.01 | 639 | 642 | 150.6 |
| C | 13 | 61 | 5407 | 31.64 | 639 | 642 | 150.6 |
| D | 2 | 232 | 145348 | 931.87 | 632 | 613 | 155.3 |
| D | 13 | 239 | 136586 | 875.45 | 632 | 613 | 155.3 |
| D | 12 | 233 | 42128 | 267.29 | 632 | 613 | 155.3 |
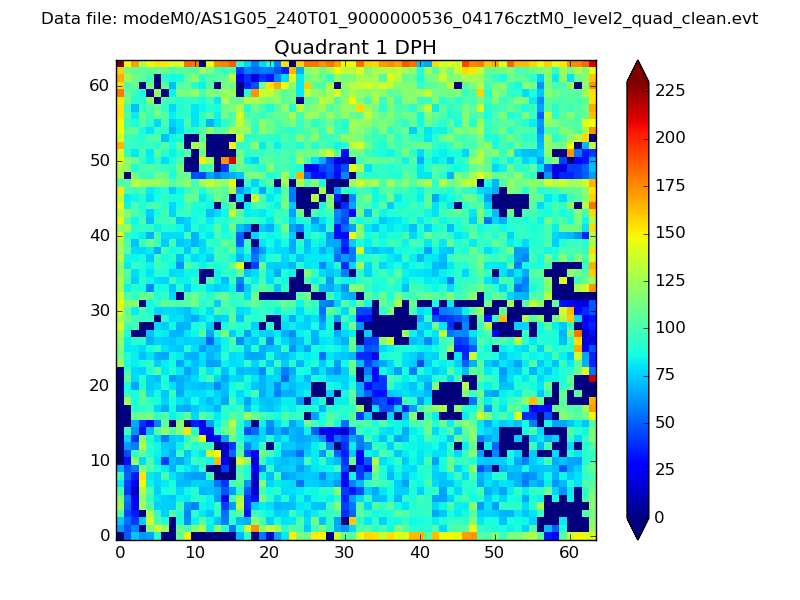
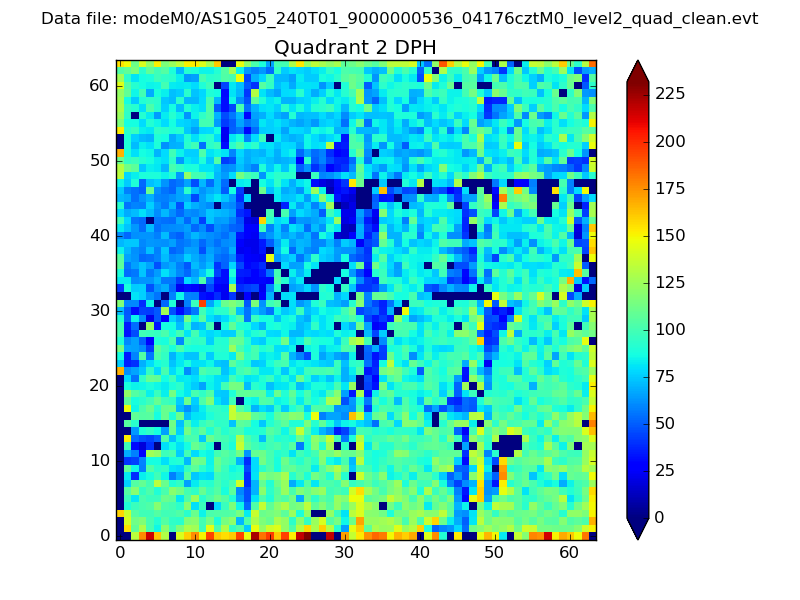
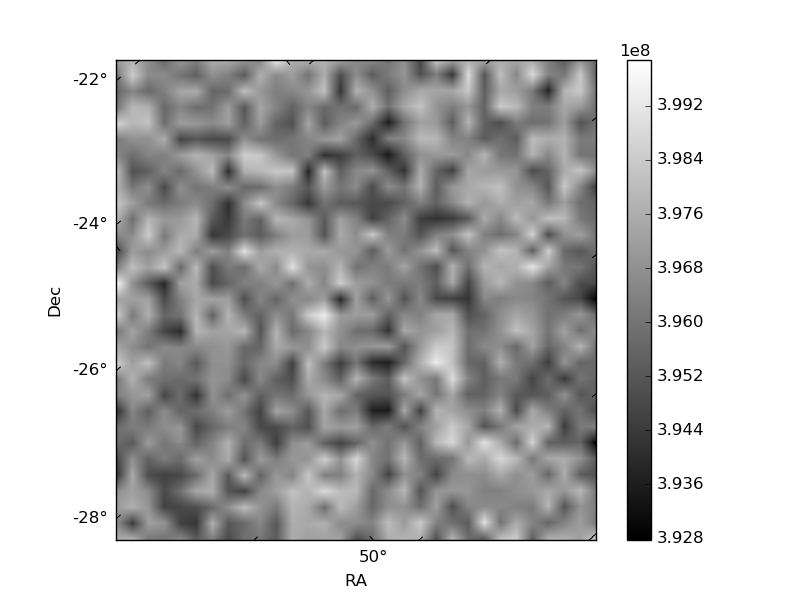
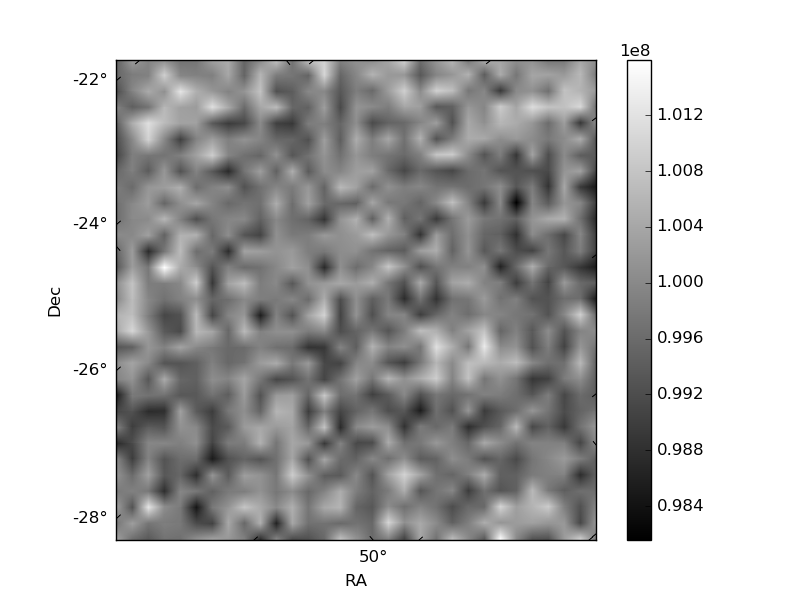
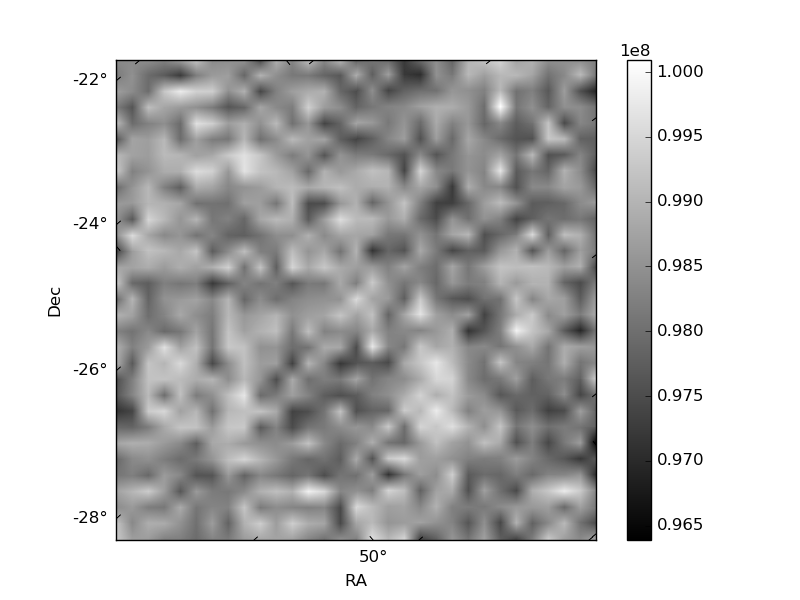
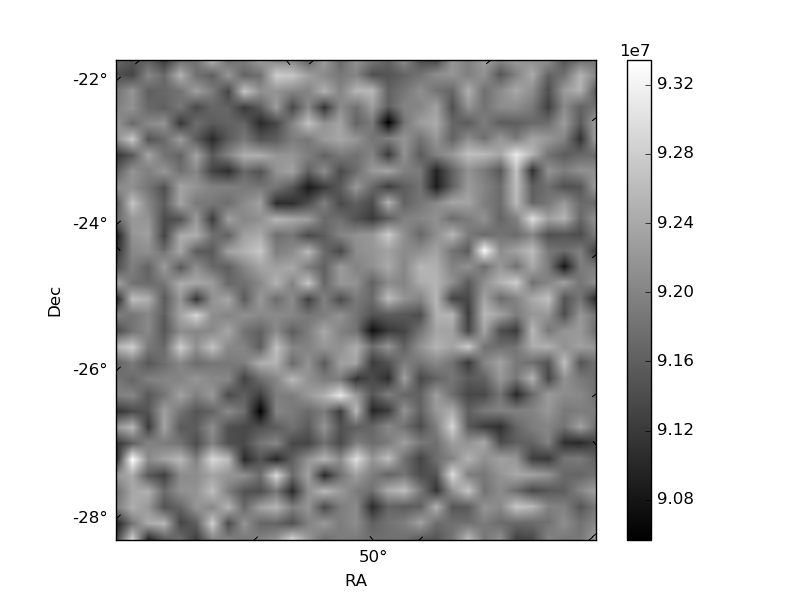
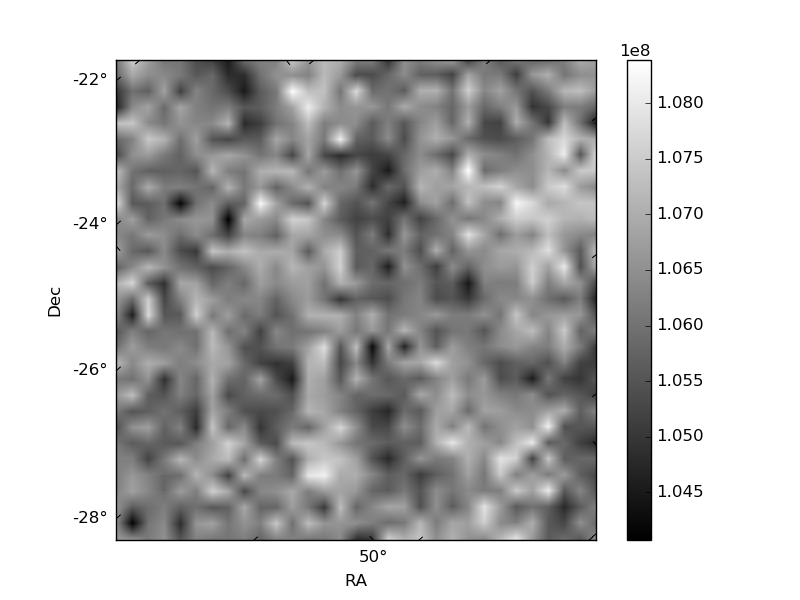
Histogram calculated using DETX and DETY for each event in the final _common_clean file
| Quadrant A | 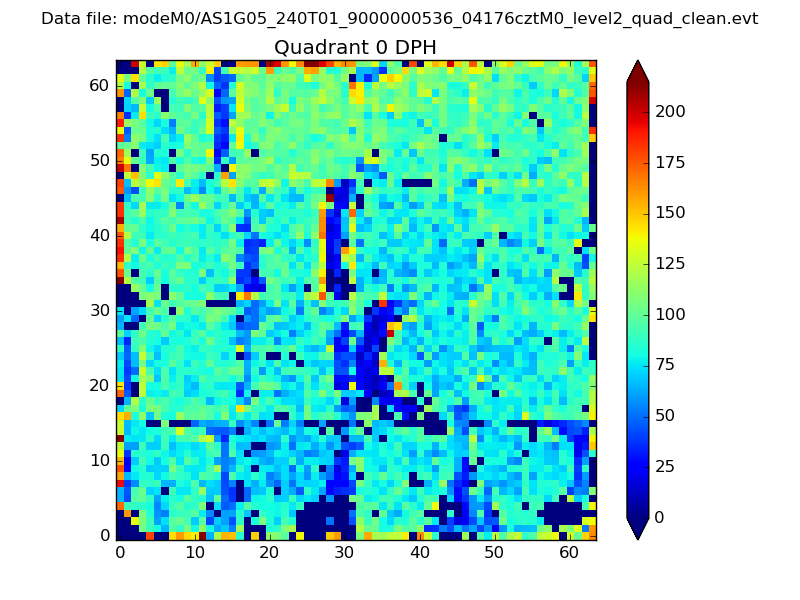 |
 |
Quadrant B |
|---|---|---|---|
| Quadrant D | 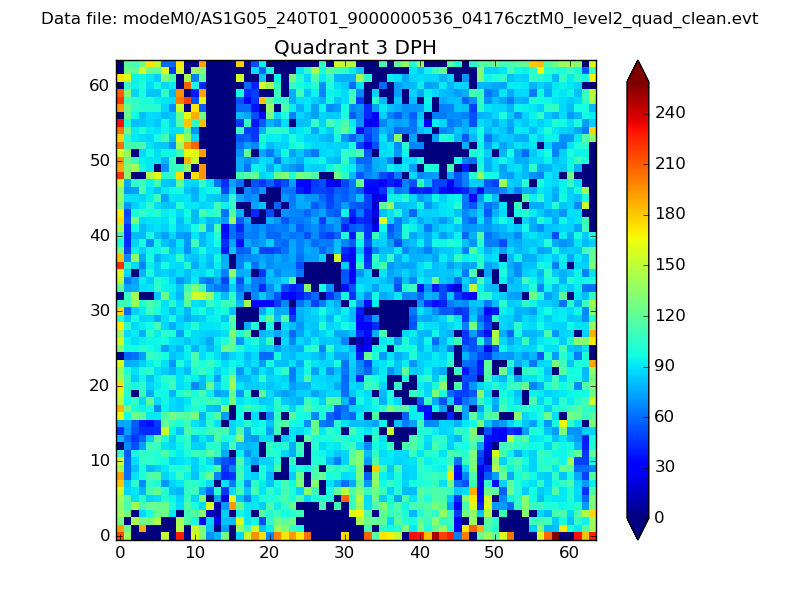 |
 |
Quadrant C |
| Plot type | Count rate plots | Images |
|---|---|---|
| Comparison with Poisson distribution Blue bars denote a histogram of data divided into 1 sec bins. Red curve is a Poisson curve with rate = median count rate of data. |
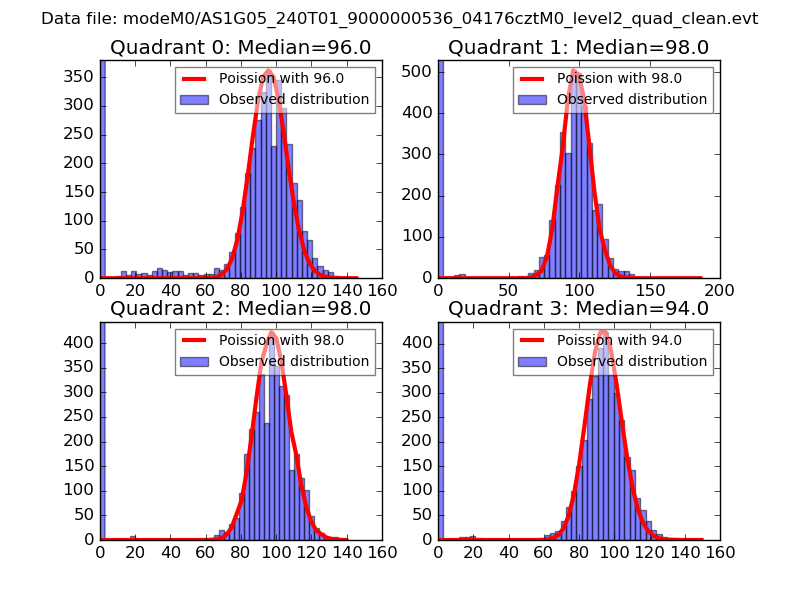 |
 |
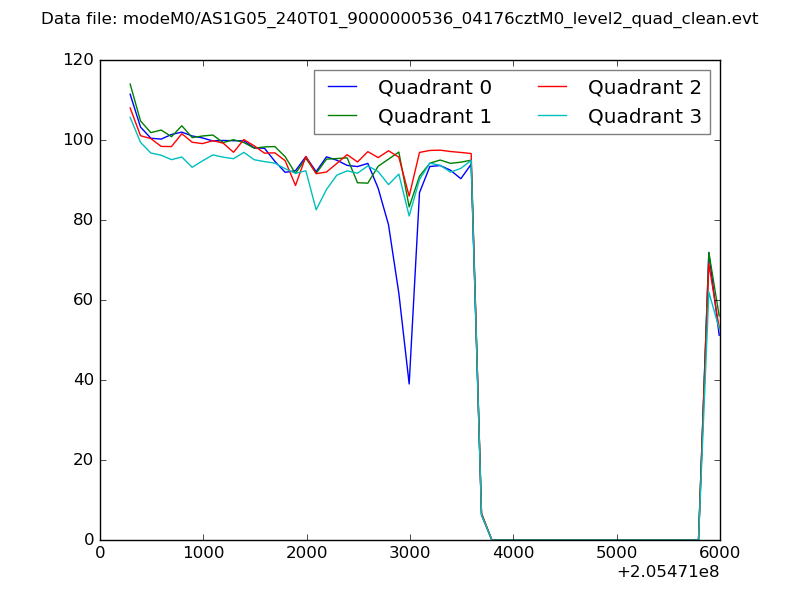
| Quadrant-wise count rates Data is divided into 100 sec bins |
 |
|
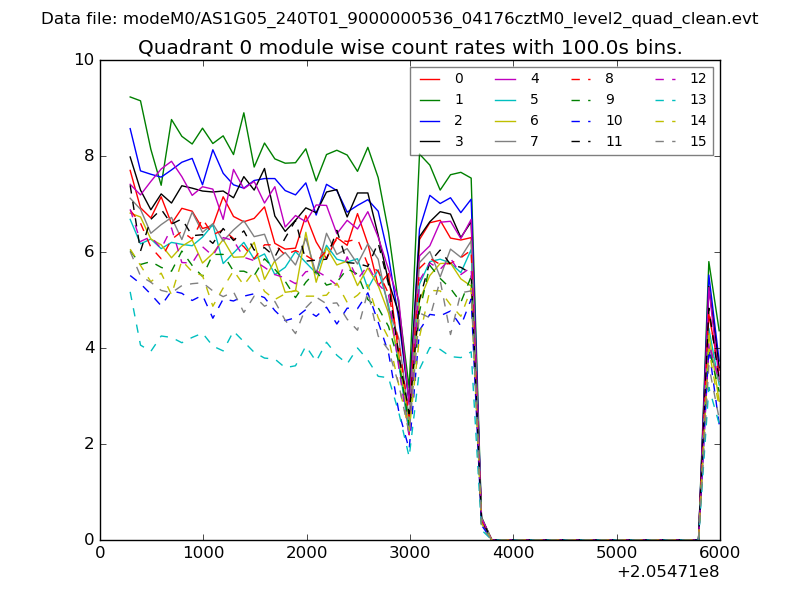
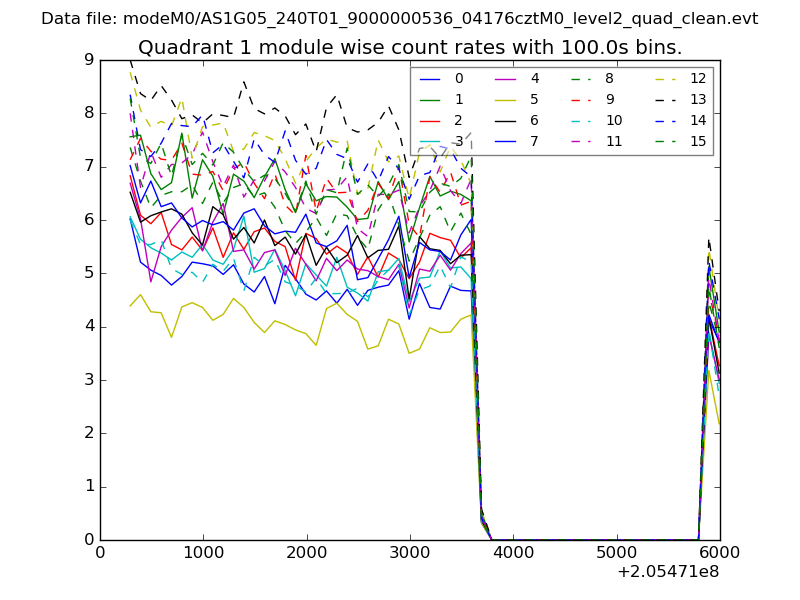
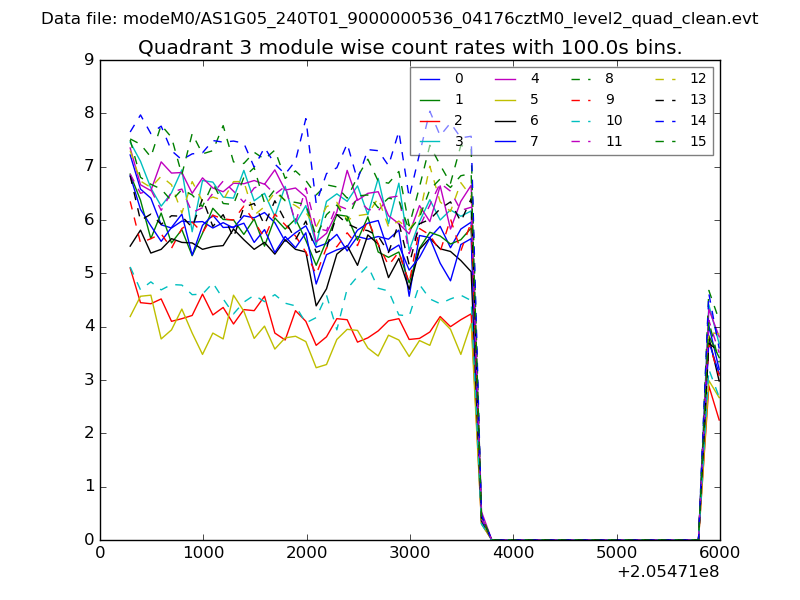
| Module-wise count rates for Quadrant A Data is divided into 100 sec bins |
 |
 |
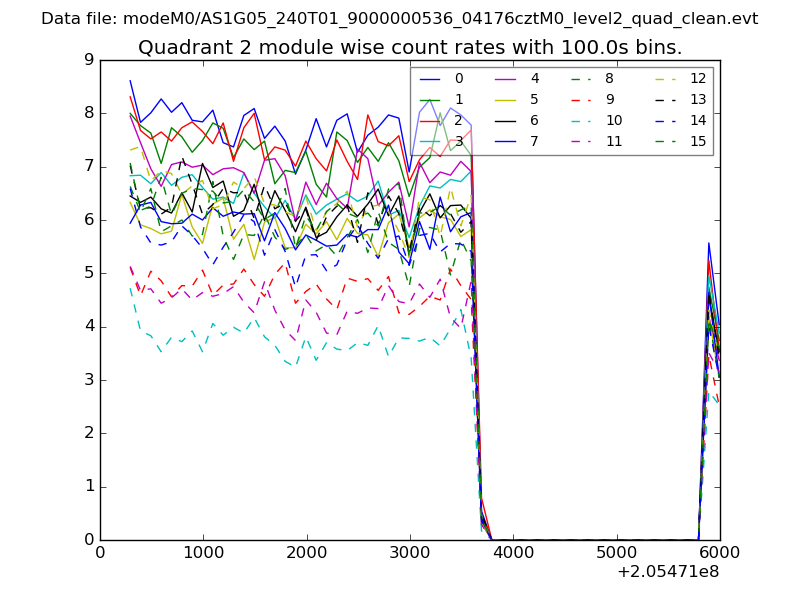
| Module-wise count rates for Quadrant B Data is divided into 100 sec bins |
 |
 |
| Module-wise count rates for Quadrant C Data is divided into 100 sec bins |
 |
 |
| Module-wise count rates for Quadrant D Data is divided into 100 sec bins |
 |
 |
| Parameter | Plot |
|---|---|
| CZT HV Monitor | 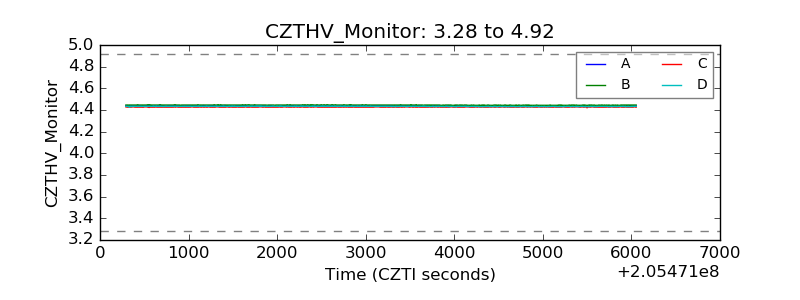 |
| D_VDD | 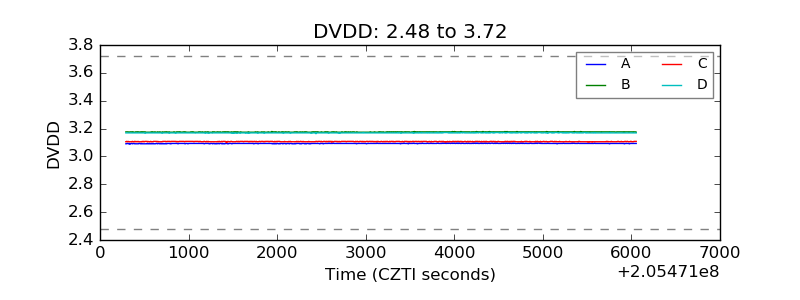 |
| Temperature 1 | 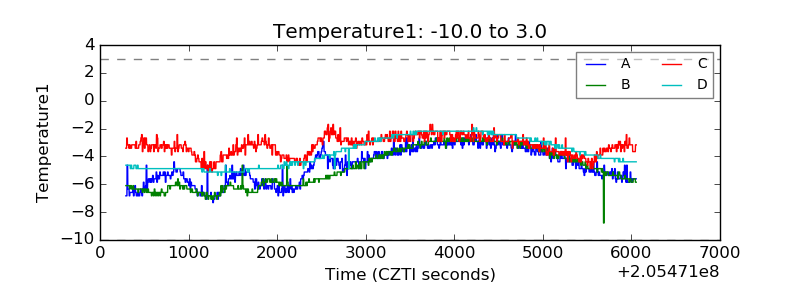 |
| Veto HV Monitor | 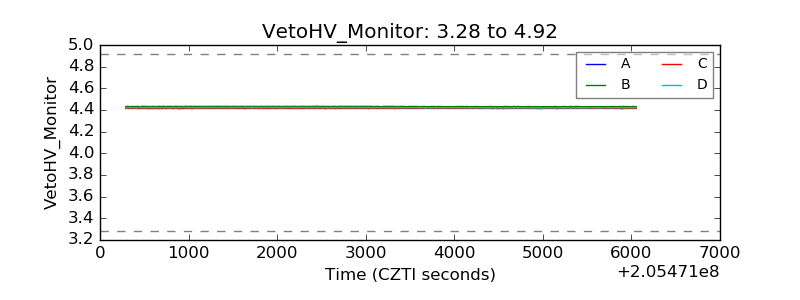 |
| Veto LLD | 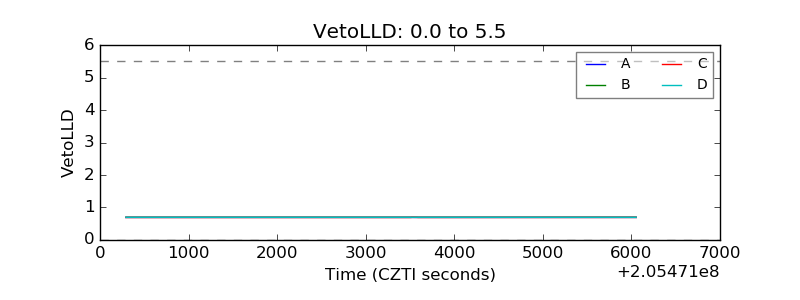 |
| Alpha Counter | 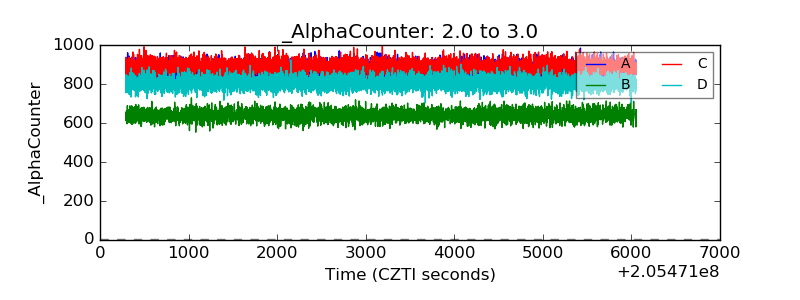 |
| _CPM_Rate | 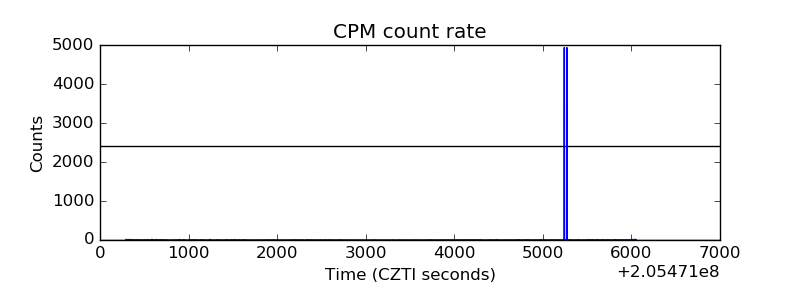 |
| CZT Counter | 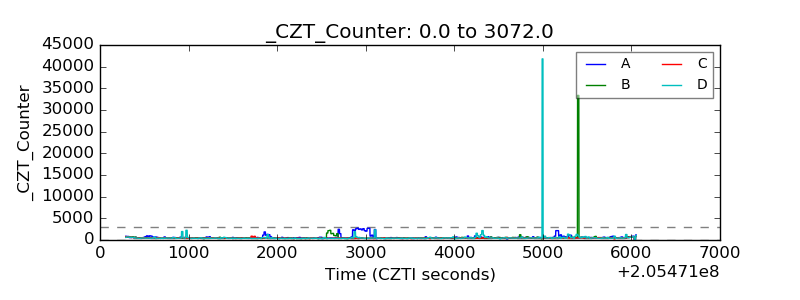 |
| +2.5 Volts monitor | 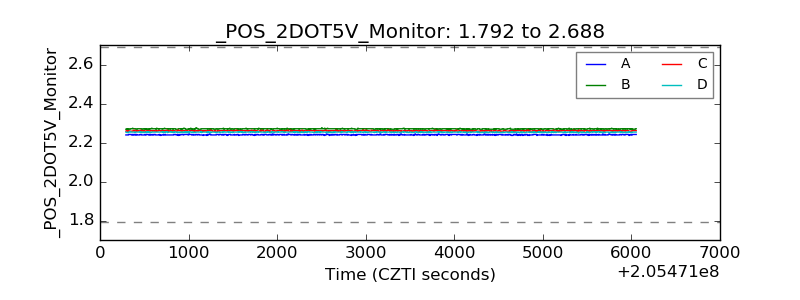 |
| +5 Volts monitor |  |
| _ROLL_ROT | 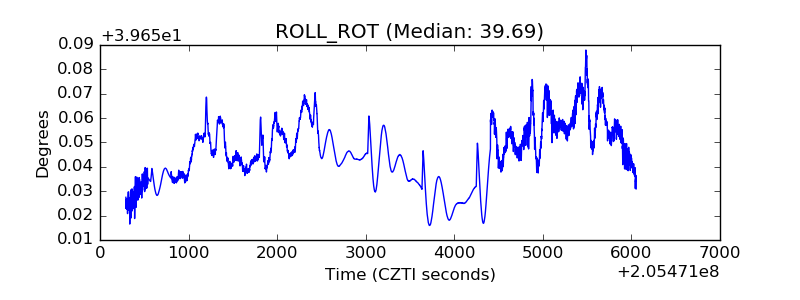 |
| _Roll_DEC | 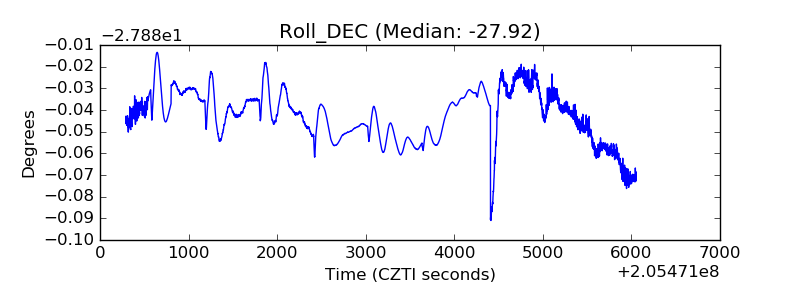 |
| _Roll_RA | 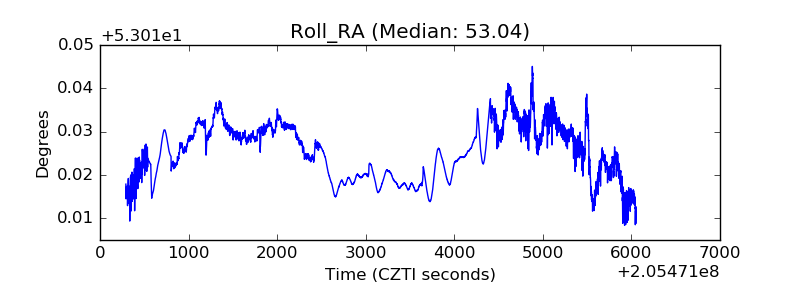 |
| Veto Counter | 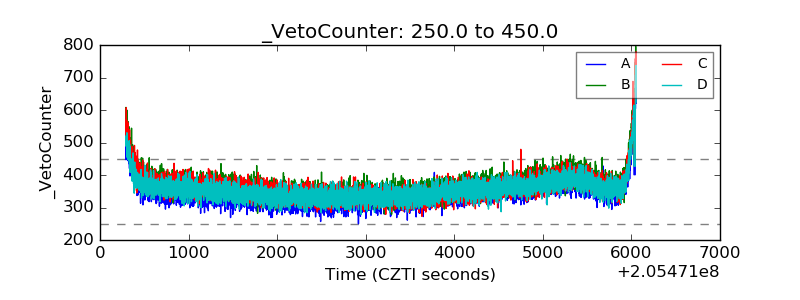 |