| Param | Original file | Final file |
|---|---|---|
| Filename | modeM0/AS1G05_240T01_9000000536_04178cztM0_level2.evt | modeM0/AS1G05_240T01_9000000536_04178cztM0_level2_quad_clean.evt |
| Size (bytes) | 526,484,160 | 70,159,680 |
| Size | 502.1 MB | 66.9 MB |
| Events in quadrant A | 3,246,401 | 428,075 |
| Events in quadrant B | 6,218,670 | 417,296 |
| Events in quadrant C | 2,763,578 | 428,015 |
| Events in quadrant D | 3,291,238 | 413,167 |
| Mode SS | |||
|---|---|---|---|
| Quadrant | BADHDUFLAG | Total packets | Discarded packets |
| A | 0 | 128 | 0 |
| B | 0 | 128 | 0 |
| C | 0 | 128 | 0 |
| D | 0 | 128 | 0 |
| Mode M9 | |||
|---|---|---|---|
| Quadrant | BADHDUFLAG | Total packets | Discarded packets |
| A | 0 | 10 | 0 |
| B | 0 | 10 | 0 |
| C | 0 | 10 | 0 |
| D | 0 | 10 | 0 |
| Mode M0 | |||
|---|---|---|---|
| Quadrant | BADHDUFLAG | Total packets | Discarded packets |
| A | 0 | 13744 | 2 |
| B | 0 | 23046 | 1 |
| C | 0 | 12667 | 1 |
| D | 0 | 14233 | 1 |
| Quadrant | Total seconds | Saturated seconds | Saturation percentage |
|---|---|---|---|
| A | 6267 | 71 | 1.132918% |
| B | 6267 | 286 | 4.563587% |
| C | 6267 | 9 | 0.143609% |
| D | 6267 | 31 | 0.494655% |
Noise dominated data is calculated using 1-second bins in cleaned event files. If a bin has >2000 counts, and if more than 50% of those come from <1% of pixels, then it is considered to be noise-dominated and hence unusable.
| Quadrant | # 1 sec bins | Bins with >0 counts | Bins with >2000 counts | High rate bins dominated by noise | Noise dominated (total time) | Noise dominated (detector-on time) | Marked lightcurve |
|---|---|---|---|---|---|---|---|
| A | 7292 | 6268 | 26 | 26 | 0.36% | 0.41% |  |
| B | 7292 | 6268 | 181 | 181 | 2.48% | 2.89% | 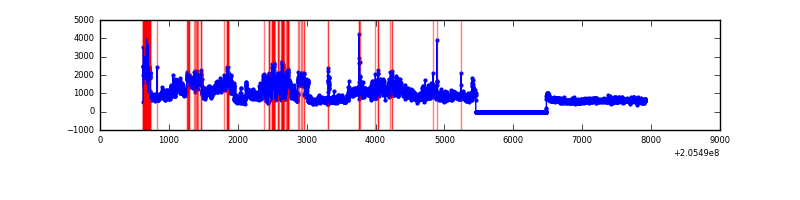 |
| C | 7292 | 6268 | 0 | 0 | 0.00% | 0.00% | 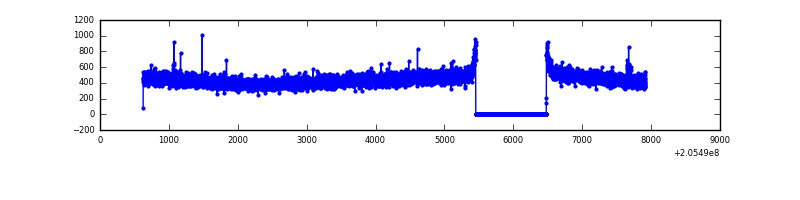 |
| D | 7292 | 6268 | 11 | 11 | 0.15% | 0.18% |  |
Top three noisy pixels from each quadrant. If the there are fewer than three noisy pixels in the level2.evt file, extra rows are filled as -1
| Pixel properties | Quadrant properties | ||||||
|---|---|---|---|---|---|---|---|
| Quadrant | DetID | PixID | Counts | Sigma | Mean | Median | Sigma |
| A | 3 | 1 | 240455 | 1609.82 | 728 | 711 | 148.9 |
| A | 0 | 50 | 173700 | 1161.58 | 728 | 711 | 148.9 |
| A | 13 | 14 | 10642 | 66.68 | 728 | 711 | 148.9 |
| B | 3 | 0 | 3088066 | 22186.99 | 721 | 703 | 139.2 |
| B | 8 | 3 | 180977 | 1295.52 | 721 | 703 | 139.2 |
| B | 10 | 16 | 54765 | 388.51 | 721 | 703 | 139.2 |
| C | 10 | 65 | 6342 | 34.12 | 704 | 708 | 165.1 |
| C | 13 | 61 | 5865 | 31.23 | 704 | 708 | 165.1 |
| C | 9 | 144 | 5822 | 30.97 | 704 | 708 | 165.1 |
| D | 2 | 232 | 385101 | 2229.57 | 706 | 685 | 172.4 |
| D | 13 | 239 | 89321 | 514.08 | 706 | 685 | 172.4 |
| D | 10 | 172 | 39738 | 226.5 | 706 | 685 | 172.4 |
Histogram calculated using DETX and DETY for each event in the final _common_clean file
| Quadrant A | 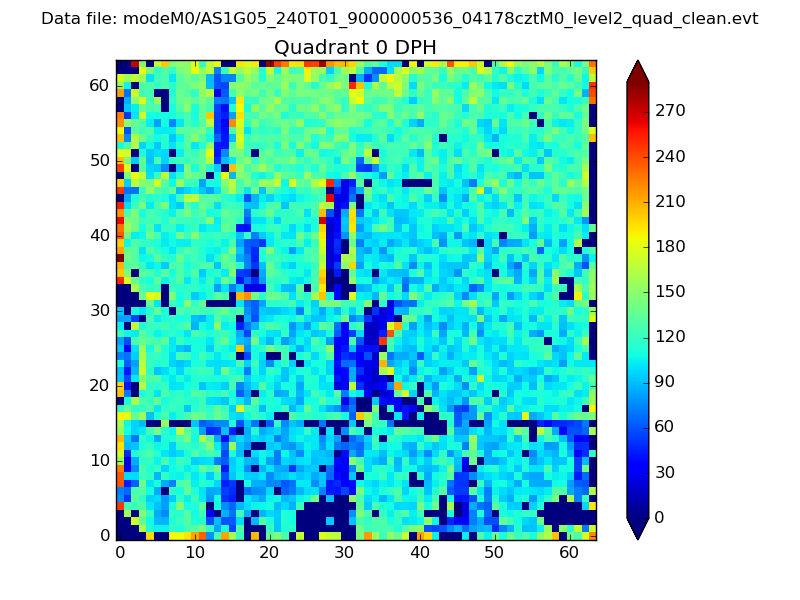 |
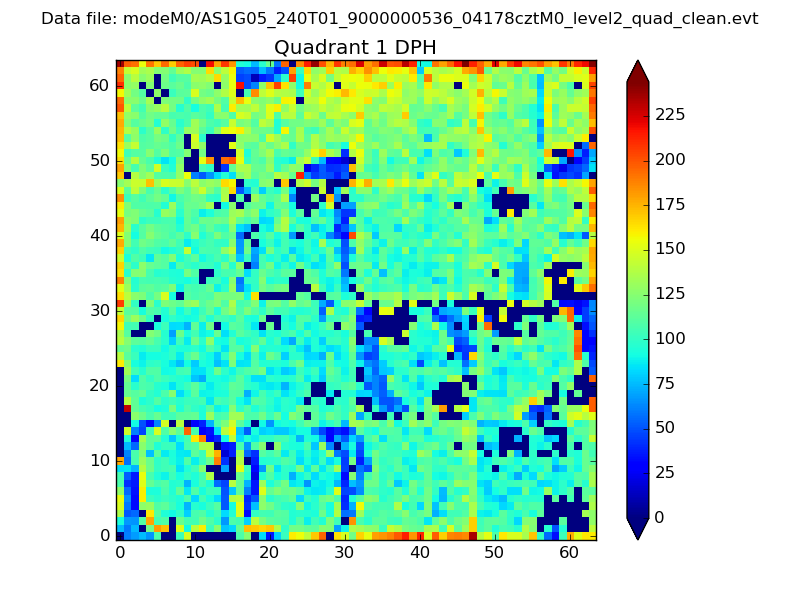 |
Quadrant B |
|---|---|---|---|
| Quadrant D |  |
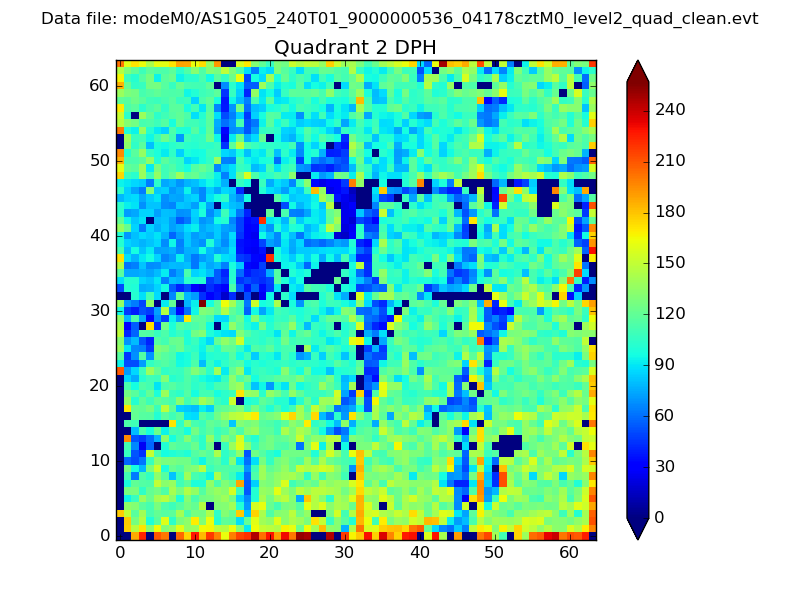 |
Quadrant C |
| Plot type | Count rate plots | Images |
|---|---|---|
| Comparison with Poisson distribution Blue bars denote a histogram of data divided into 1 sec bins. Red curve is a Poisson curve with rate = median count rate of data. |
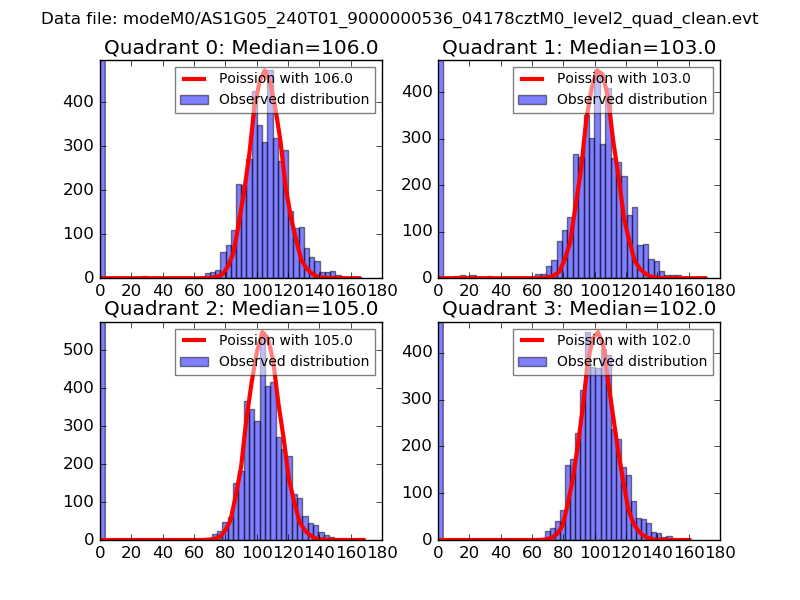 |
 |
| Quadrant-wise count rates Data is divided into 100 sec bins |
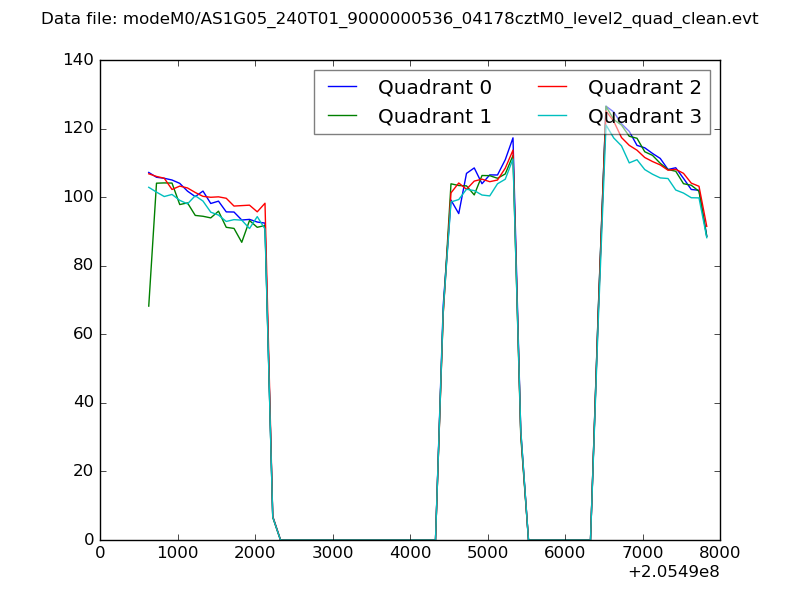 |
|
| Module-wise count rates for Quadrant A Data is divided into 100 sec bins |
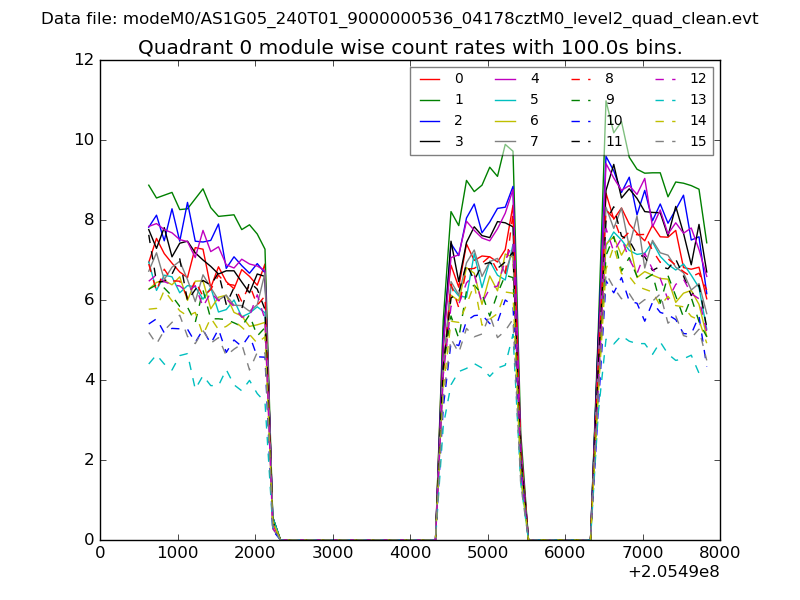 |
 |
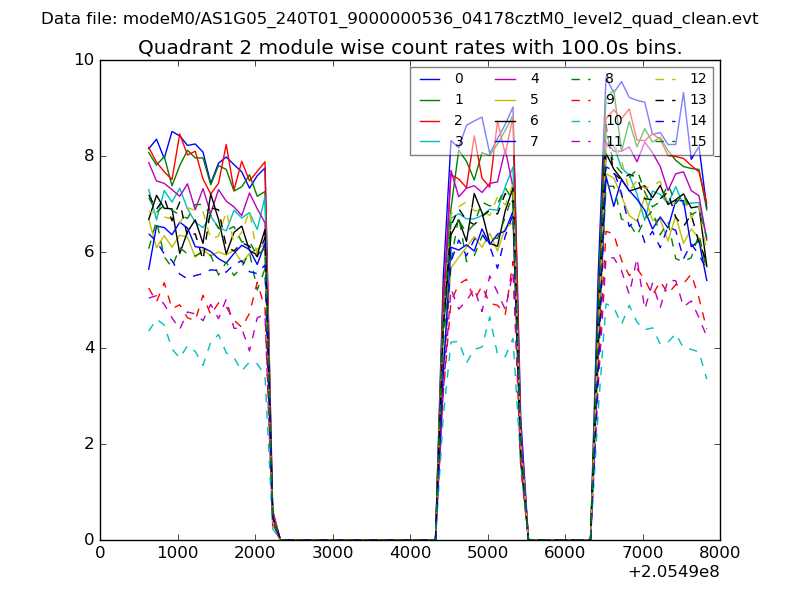
| Module-wise count rates for Quadrant B Data is divided into 100 sec bins |
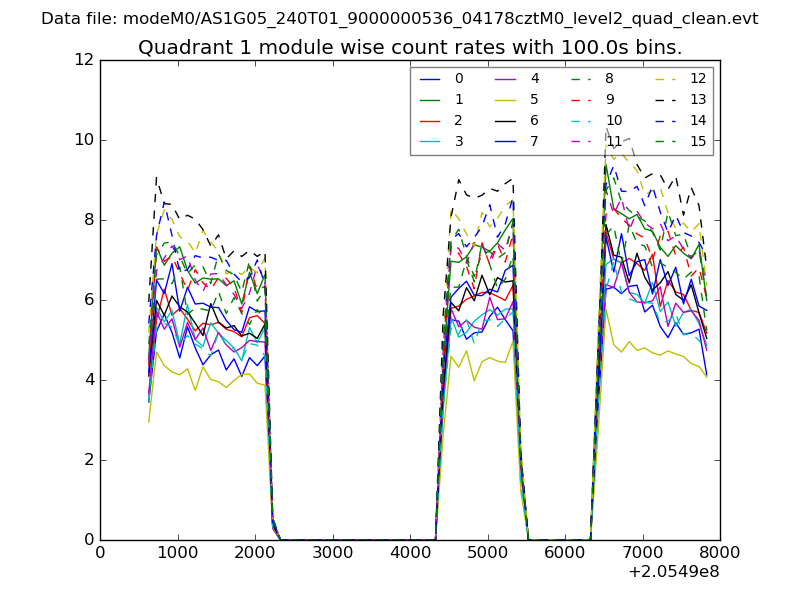 |
 |
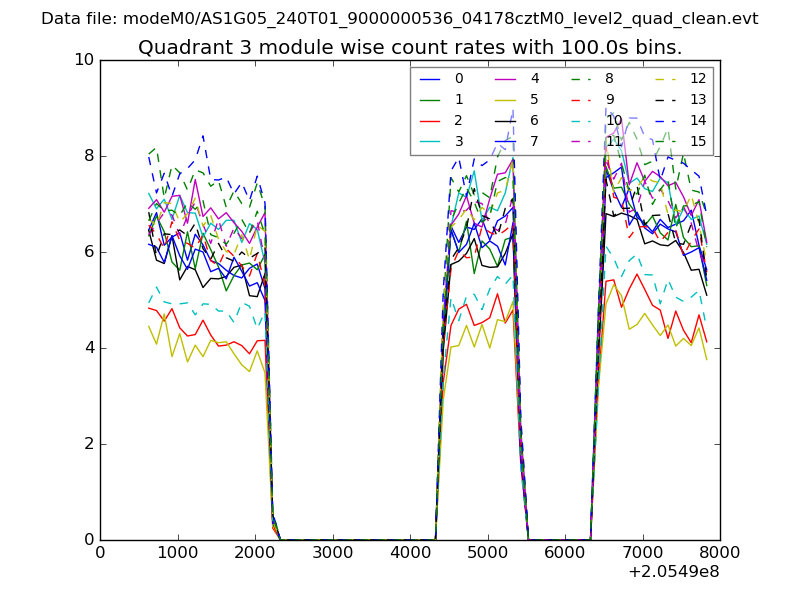
| Module-wise count rates for Quadrant C Data is divided into 100 sec bins |
 |
 |
| Module-wise count rates for Quadrant D Data is divided into 100 sec bins |
 |
 |
| Parameter | Plot |
|---|---|
| CZT HV Monitor | 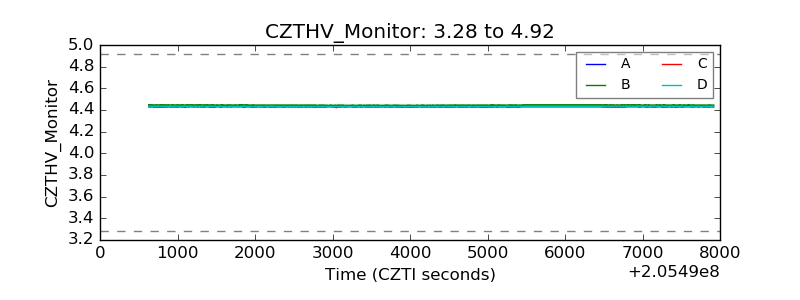 |
| D_VDD | 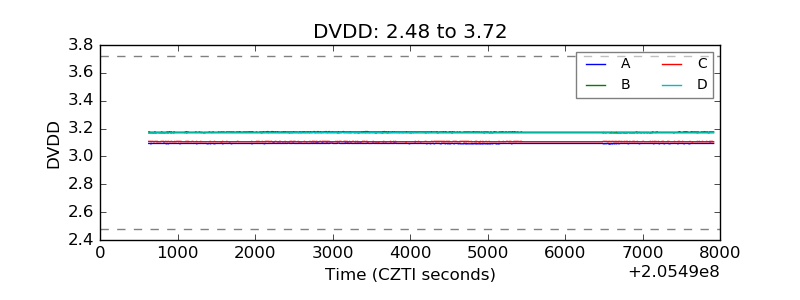 |
| Temperature 1 | 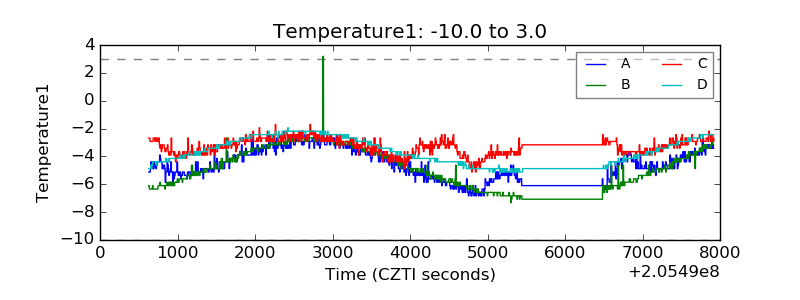 |
| Veto HV Monitor | 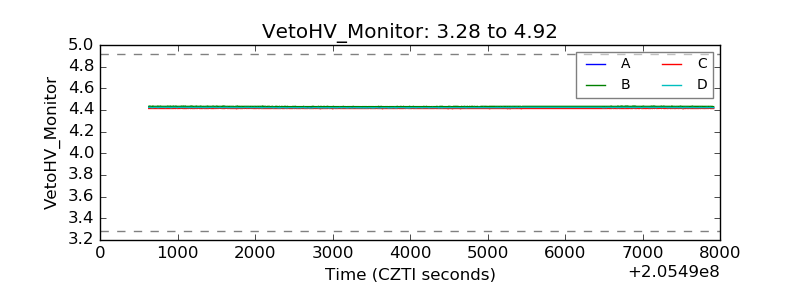 |
| Veto LLD | 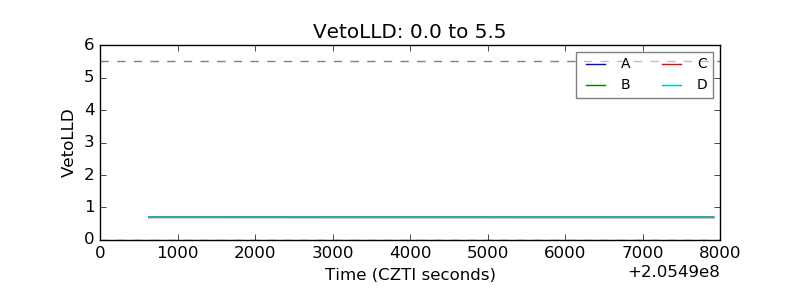 |
| Alpha Counter | 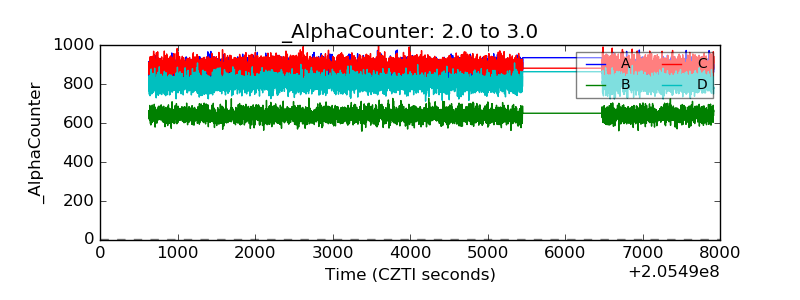 |
| _CPM_Rate | 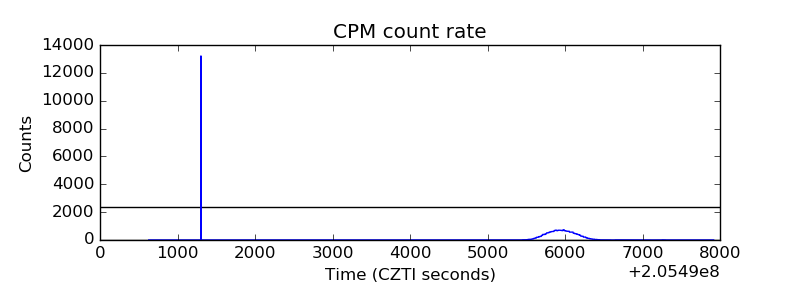 |
| CZT Counter | 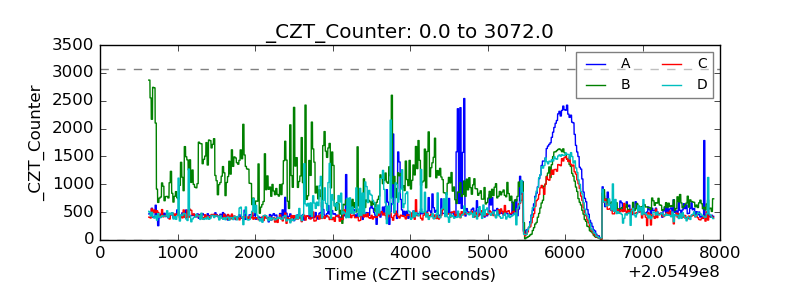 |
| +2.5 Volts monitor | 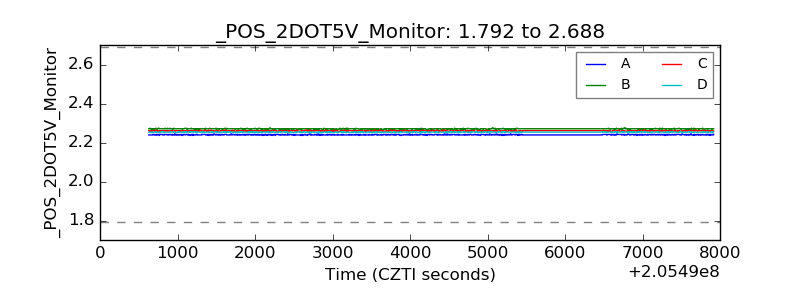 |
| +5 Volts monitor |  |
| _ROLL_ROT | 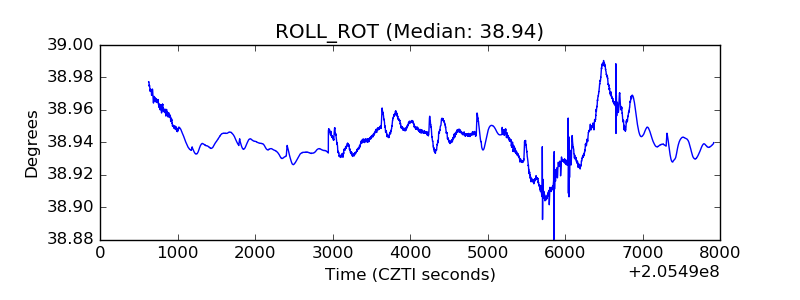 |
| _Roll_DEC | 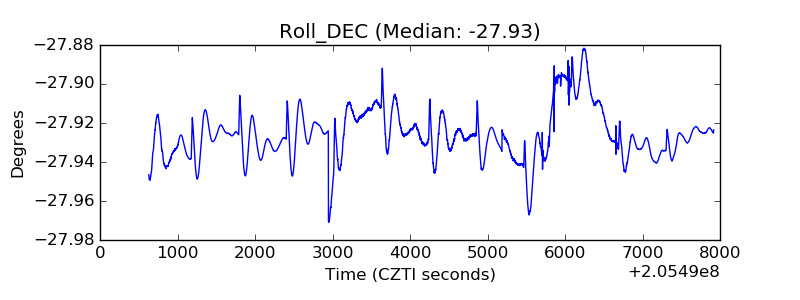 |
| _Roll_RA | 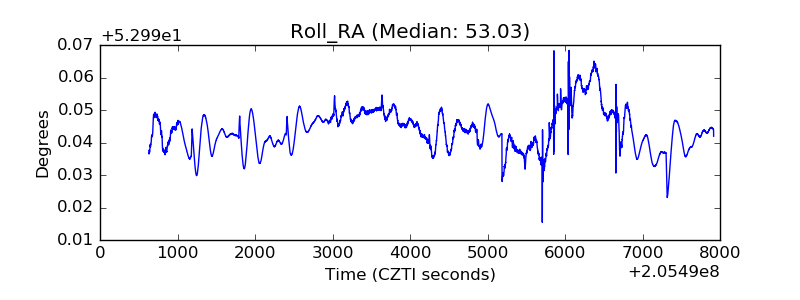 |
| Veto Counter | 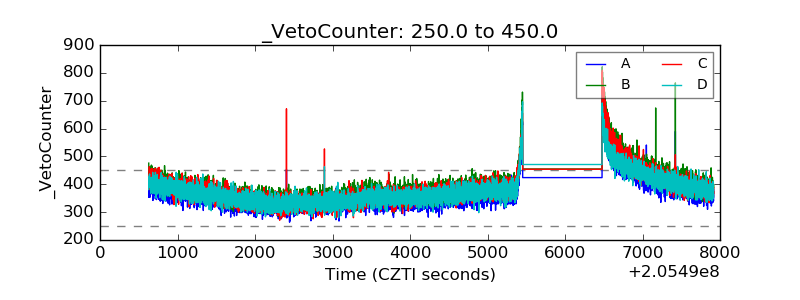 |