| Param | Original file | Final file |
|---|---|---|
| Filename | modeM0/AS1G05_240T01_9000000536_04180cztM0_level2.evt | modeM0/AS1G05_240T01_9000000536_04180cztM0_level2_quad_clean.evt |
| Size (bytes) | 502,920,000 | 72,106,560 |
| Size | 479.6 MB | 68.8 MB |
| Events in quadrant A | 3,525,990 | 444,001 |
| Events in quadrant B | 4,764,734 | 444,330 |
| Events in quadrant C | 2,894,060 | 437,537 |
| Events in quadrant D | 3,613,783 | 412,526 |
| Mode SS | |||
|---|---|---|---|
| Quadrant | BADHDUFLAG | Total packets | Discarded packets |
| A | 0 | 130 | 0 |
| B | 0 | 130 | 0 |
| C | 0 | 130 | 0 |
| D | 0 | 130 | 0 |
| Mode M9 | |||
|---|---|---|---|
| Quadrant | BADHDUFLAG | Total packets | Discarded packets |
| A | 0 | 11 | 0 |
| B | 0 | 11 | 0 |
| C | 0 | 11 | 0 |
| D | 0 | 11 | 0 |
| Mode M0 | |||
|---|---|---|---|
| Quadrant | BADHDUFLAG | Total packets | Discarded packets |
| A | 0 | 14546 | 2 |
| B | 0 | 18769 | 1 |
| C | 0 | 12978 | 1 |
| D | 0 | 15009 | 1 |
| Quadrant | Total seconds | Saturated seconds | Saturation percentage |
|---|---|---|---|
| A | 6373 | 70 | 1.098384% |
| B | 6373 | 163 | 2.557665% |
| C | 6373 | 14 | 0.219677% |
| D | 6373 | 250 | 3.922799% |
Noise dominated data is calculated using 1-second bins in cleaned event files. If a bin has >2000 counts, and if more than 50% of those come from <1% of pixels, then it is considered to be noise-dominated and hence unusable.
| Quadrant | # 1 sec bins | Bins with >0 counts | Bins with >2000 counts | High rate bins dominated by noise | Noise dominated (total time) | Noise dominated (detector-on time) | Marked lightcurve |
|---|---|---|---|---|---|---|---|
| A | 7503 | 6374 | 6 | 6 | 0.08% | 0.09% | 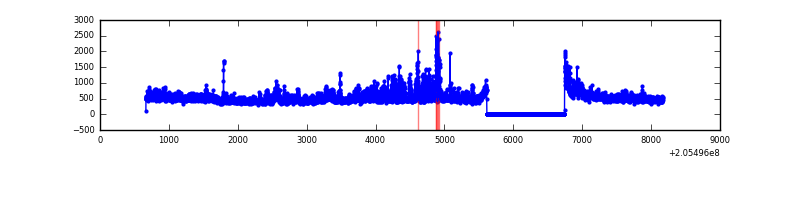 |
| B | 7503 | 6374 | 97 | 97 | 1.29% | 1.52% | 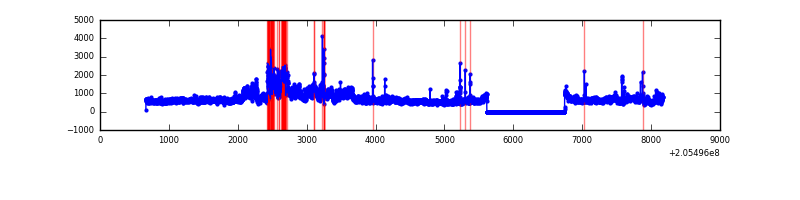 |
| C | 7503 | 6374 | 1 | 1 | 0.01% | 0.02% | 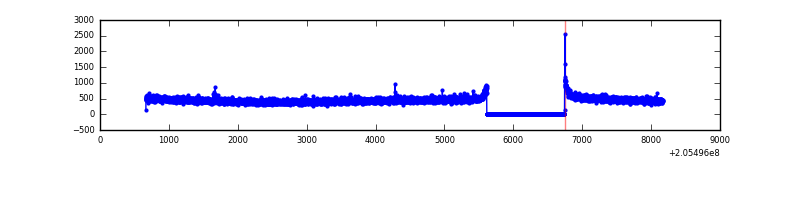 |
| D | 7503 | 6374 | 145 | 145 | 1.93% | 2.27% |  |
Top three noisy pixels from each quadrant. If the there are fewer than three noisy pixels in the level2.evt file, extra rows are filled as -1
| Pixel properties | Quadrant properties | ||||||
|---|---|---|---|---|---|---|---|
| Quadrant | DetID | PixID | Counts | Sigma | Mean | Median | Sigma |
| A | 3 | 1 | 377018 | 2391.96 | 769 | 752 | 157.3 |
| A | 0 | 50 | 63481 | 398.77 | 769 | 752 | 157.3 |
| A | 15 | 234 | 59283 | 372.09 | 769 | 752 | 157.3 |
| B | 3 | 0 | 1334023 | 9110.47 | 765 | 748 | 146.3 |
| B | 8 | 3 | 296866 | 2023.42 | 765 | 748 | 146.3 |
| B | 10 | 16 | 84007 | 568.92 | 765 | 748 | 146.3 |
| C | 9 | 144 | 9989 | 54.05 | 735 | 739 | 171.1 |
| C | 13 | 61 | 6025 | 30.89 | 735 | 739 | 171.1 |
| C | 7 | 247 | 5678 | 28.86 | 735 | 739 | 171.1 |
| D | 4 | 95 | 398319 | 2260.21 | 727 | 708 | 175.9 |
| D | 13 | 239 | 240105 | 1360.85 | 727 | 708 | 175.9 |
| D | 2 | 232 | 168594 | 954.34 | 727 | 708 | 175.9 |
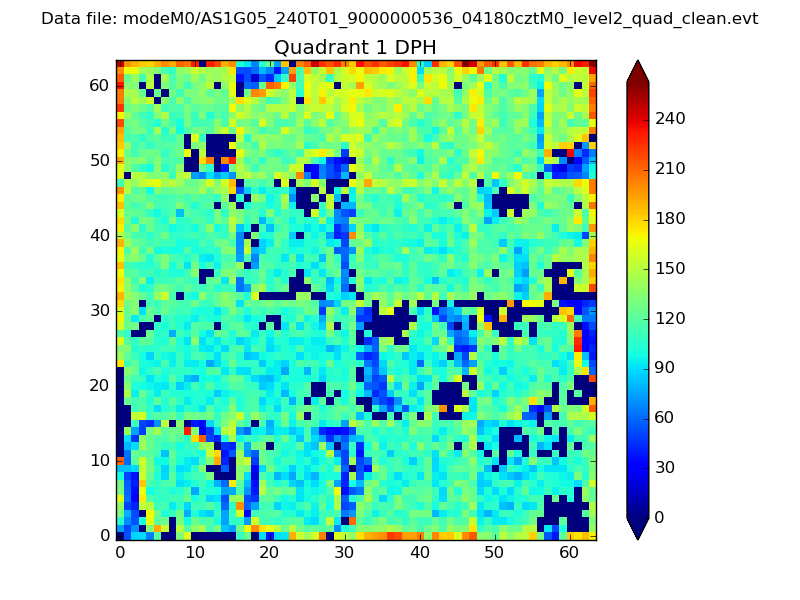
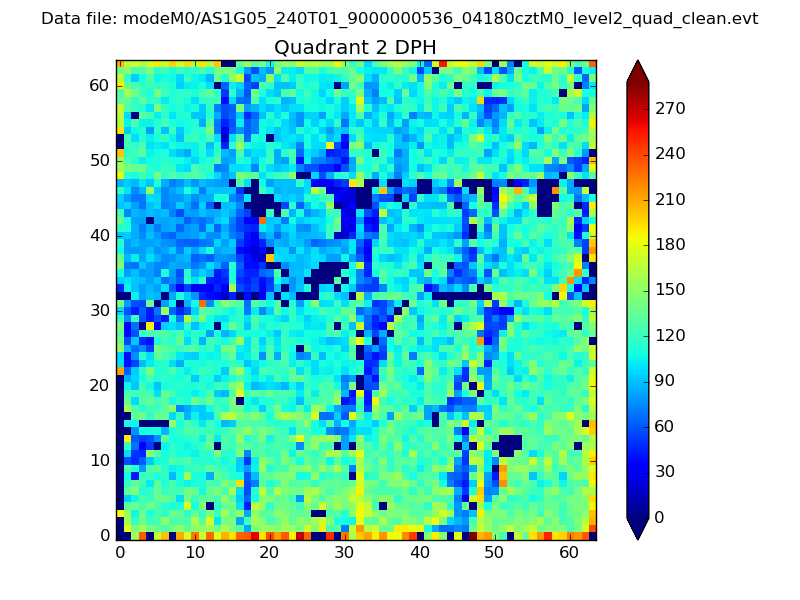
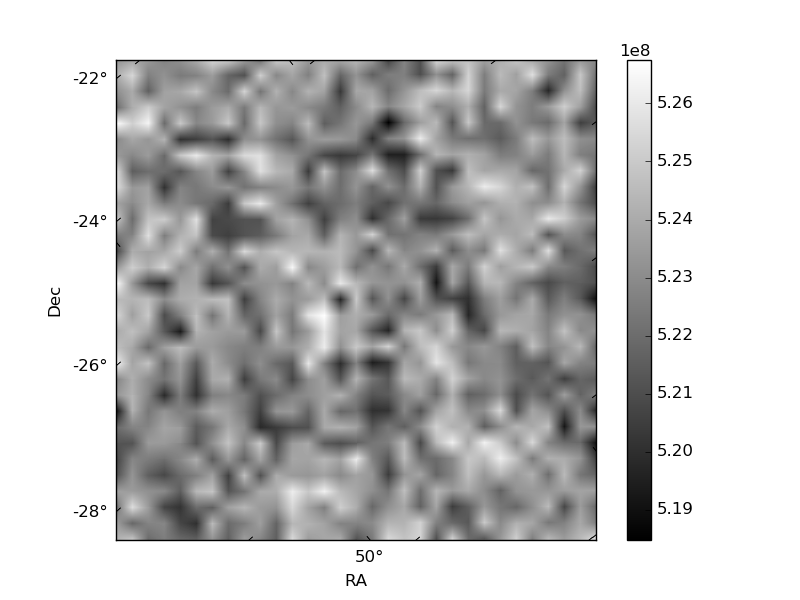
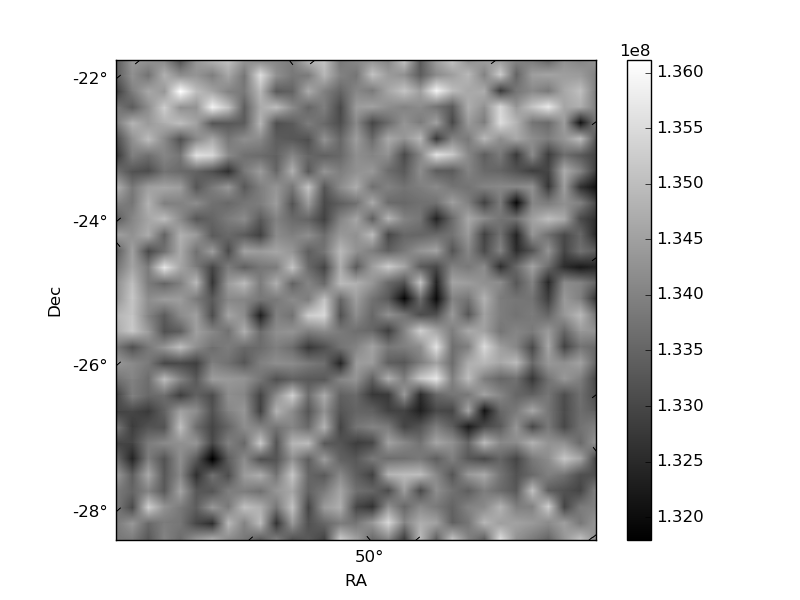
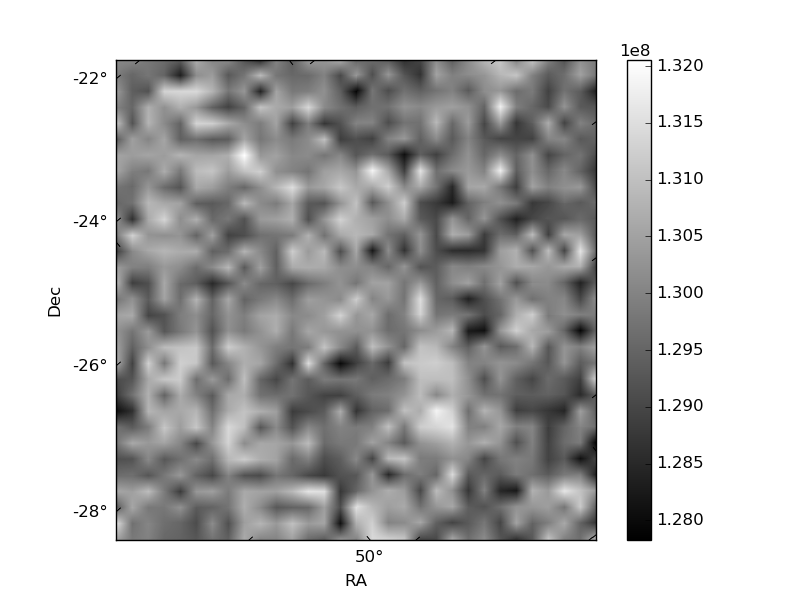
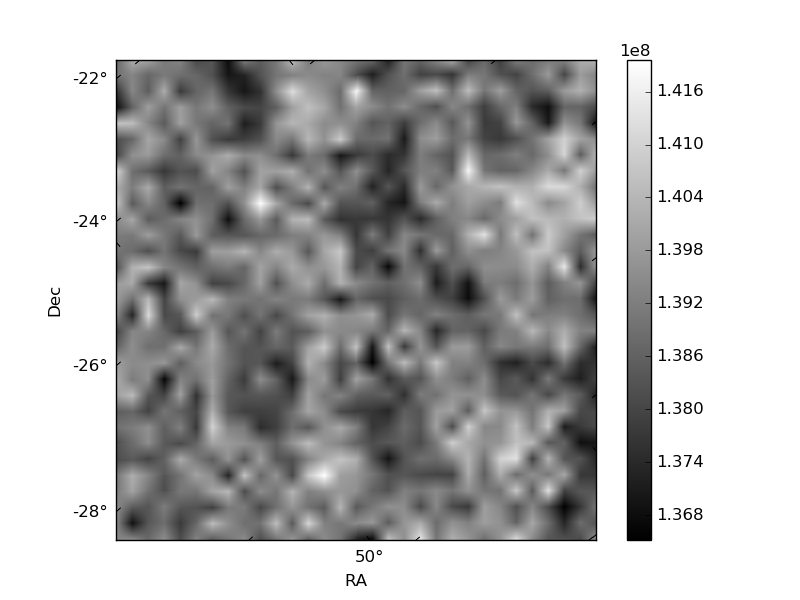
Histogram calculated using DETX and DETY for each event in the final _common_clean file
| Quadrant A | 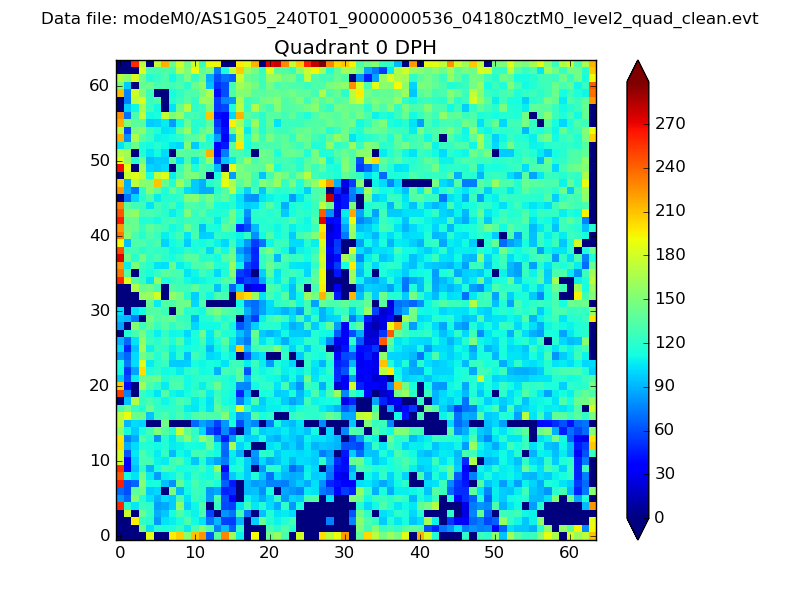 |
 |
Quadrant B |
|---|---|---|---|
| Quadrant D | 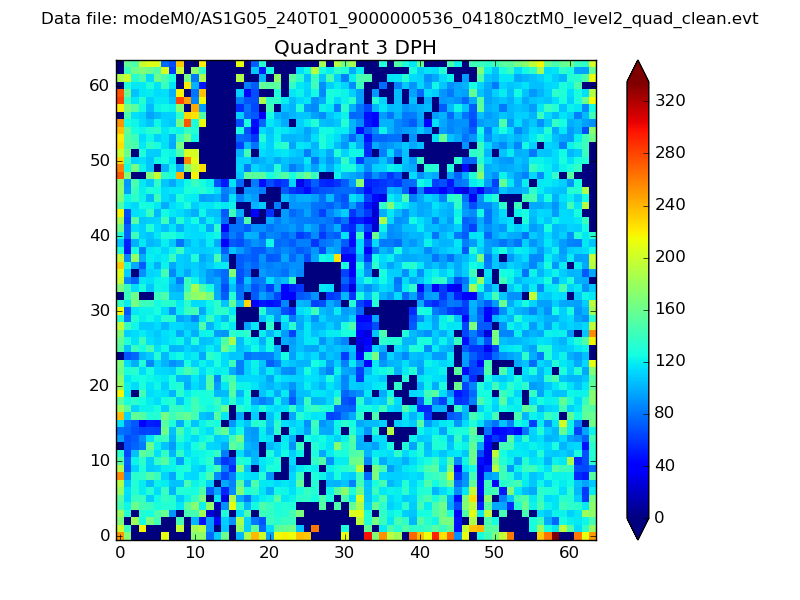 |
 |
Quadrant C |
| Plot type | Count rate plots | Images |
|---|---|---|
| Comparison with Poisson distribution Blue bars denote a histogram of data divided into 1 sec bins. Red curve is a Poisson curve with rate = median count rate of data. |
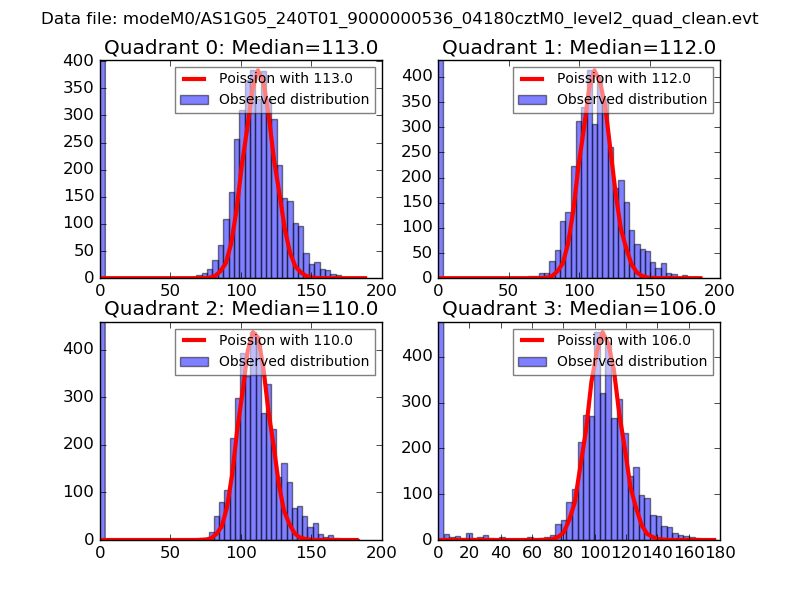 |
 |
| Quadrant-wise count rates Data is divided into 100 sec bins |
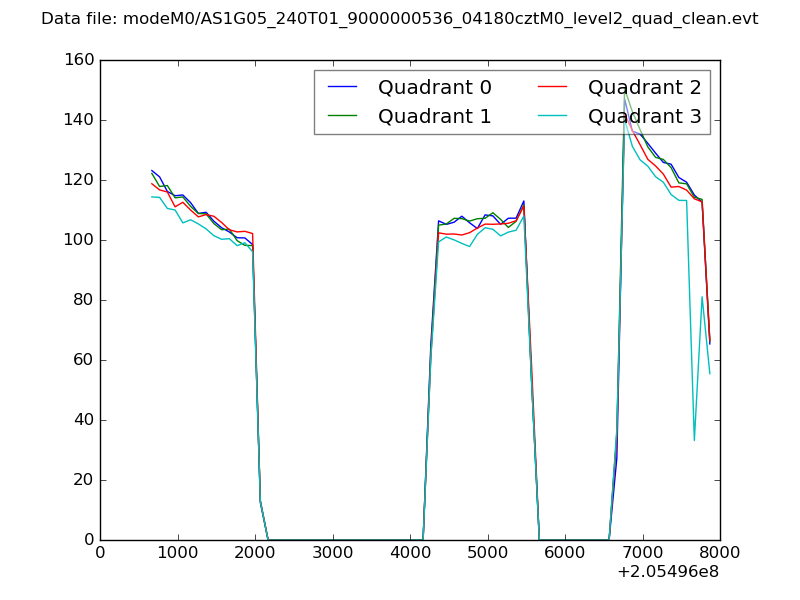 |
|
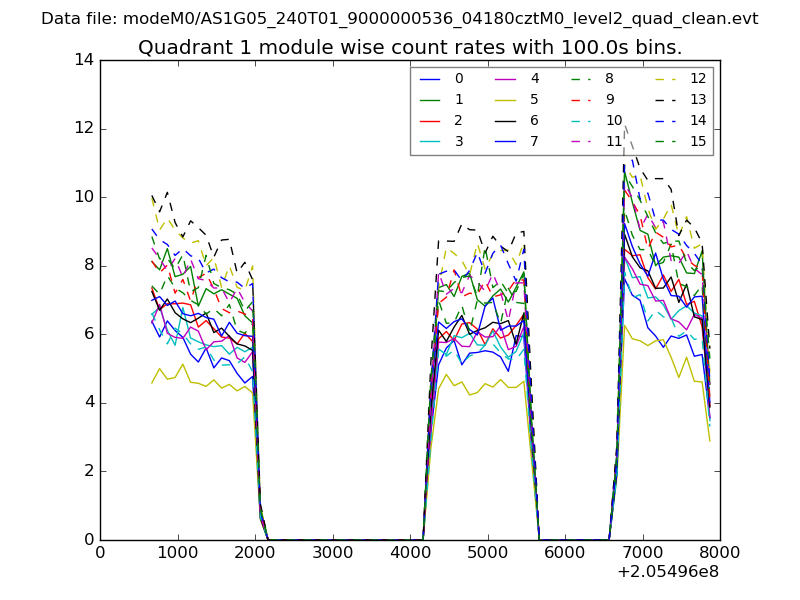
| Module-wise count rates for Quadrant A Data is divided into 100 sec bins |
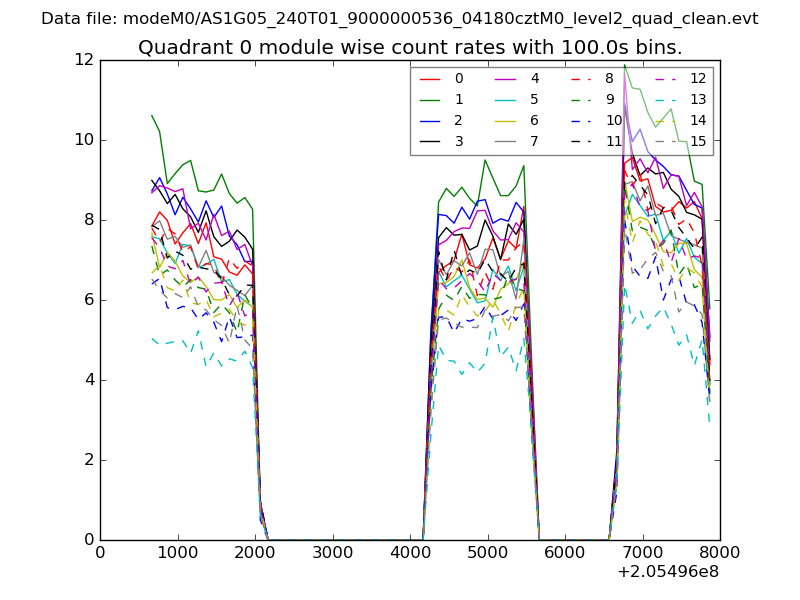 |
 |
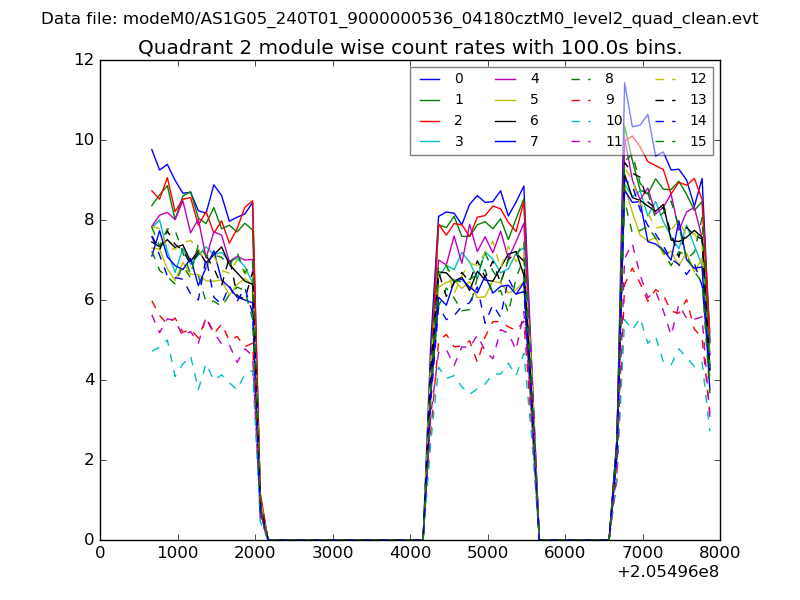
| Module-wise count rates for Quadrant B Data is divided into 100 sec bins |
 |
 |
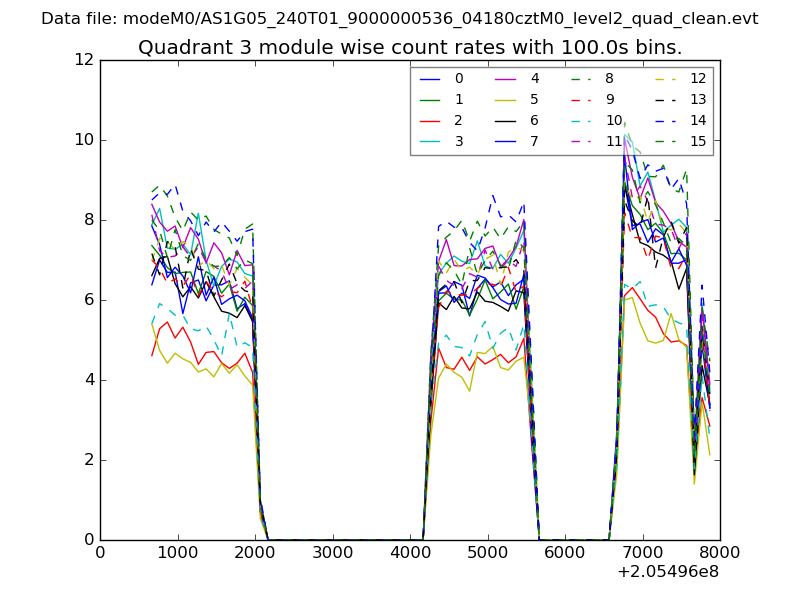
| Module-wise count rates for Quadrant C Data is divided into 100 sec bins |
 |
 |
| Module-wise count rates for Quadrant D Data is divided into 100 sec bins |
 |
 |
| Parameter | Plot |
|---|---|
| CZT HV Monitor | 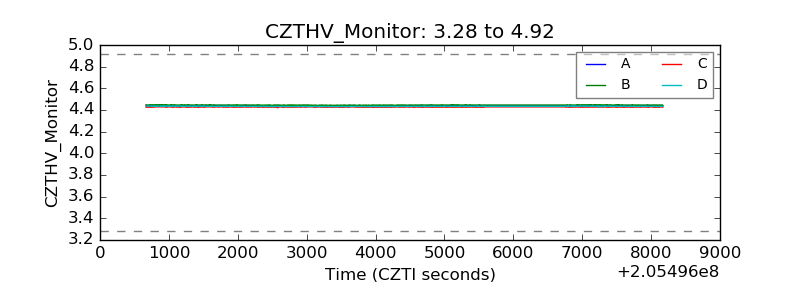 |
| D_VDD | 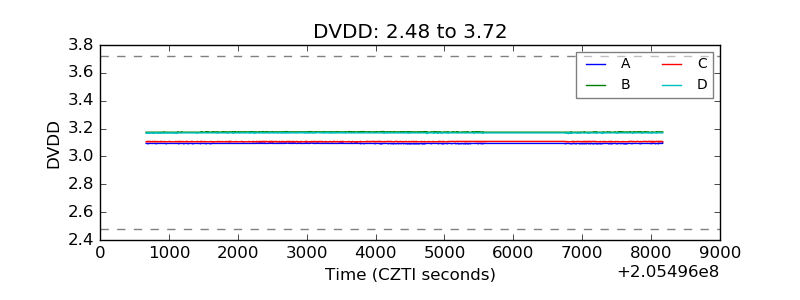 |
| Temperature 1 | 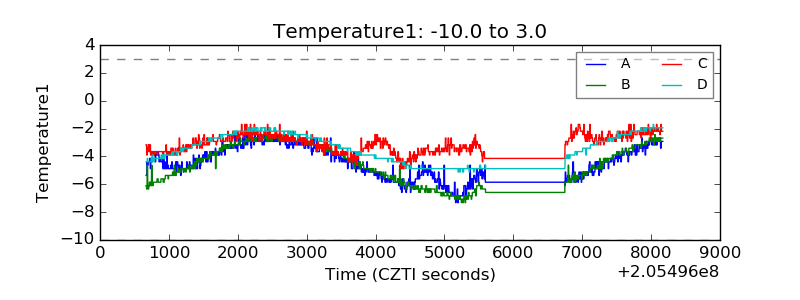 |
| Veto HV Monitor | 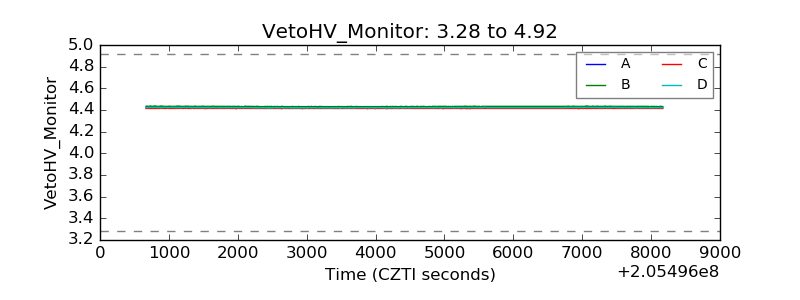 |
| Veto LLD | 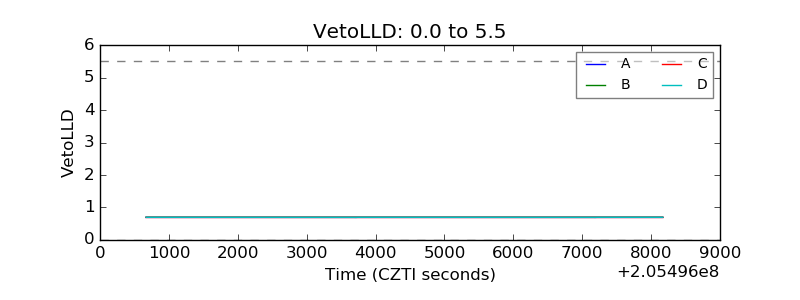 |
| Alpha Counter | 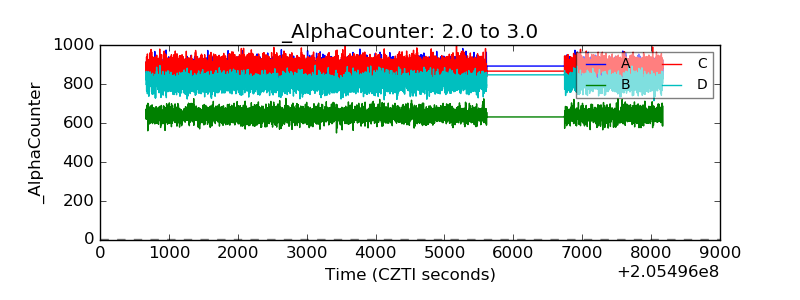 |
| _CPM_Rate | 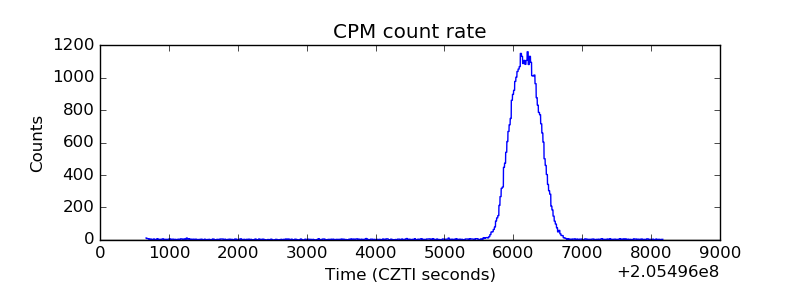 |
| CZT Counter | 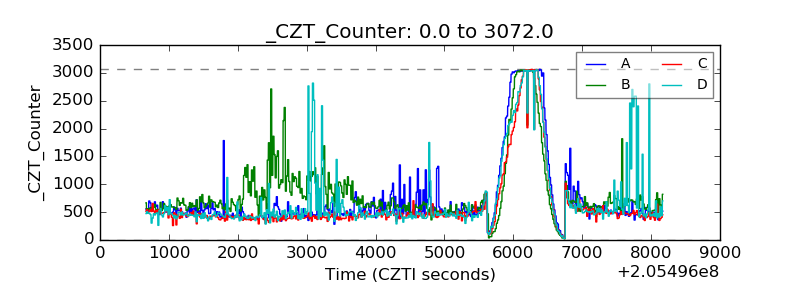 |
| +2.5 Volts monitor | 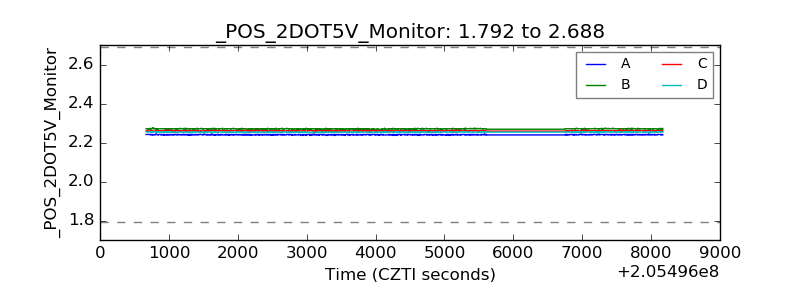 |
| +5 Volts monitor |  |
| _ROLL_ROT | 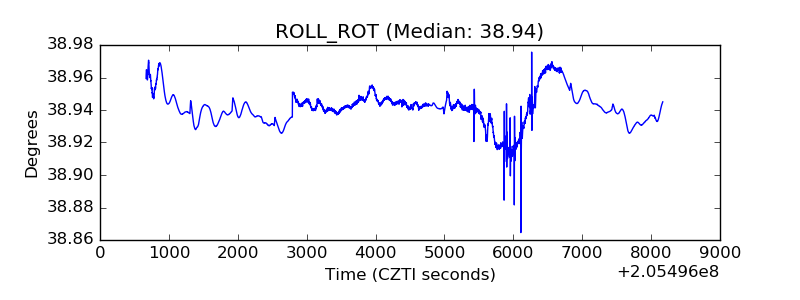 |
| _Roll_DEC | 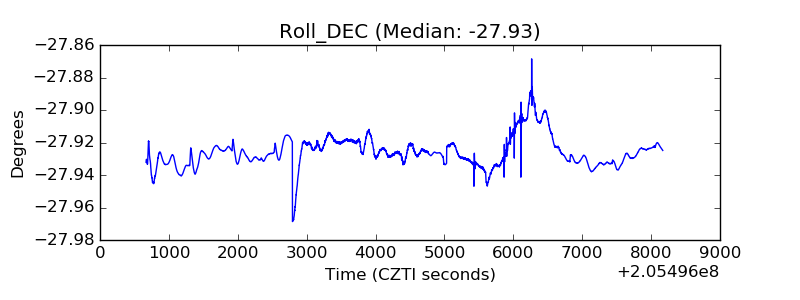 |
| _Roll_RA | 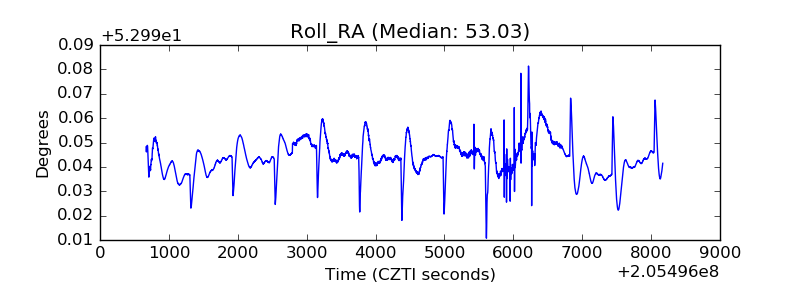 |
| Veto Counter | 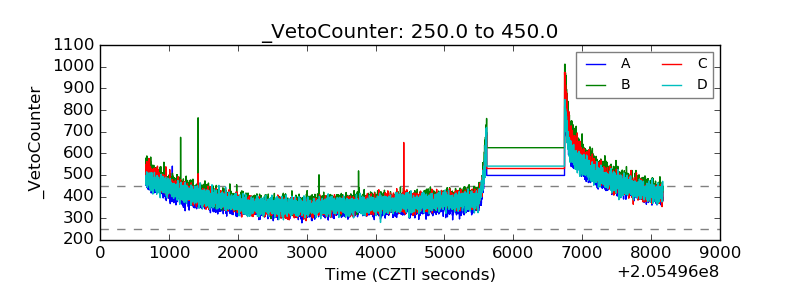 |